12 minute read
Reducing conservatism in fatigue crack growth assessments through testing
By Dominic Wynne, Technical Solutions Specialist, ROSEN Group, US
The pressure in an oil and gas pipeline is never constant: variations in the pressure are caused by operation conditions or changing customer needs. Repeat loadings cause cyclic stresses in pipelines, and these can create cracks, or cause existing cracks to grow by fatigue.
Pipelines can be subject to various types of repeat loading, for example from traffic loading, or vibration due to water flow. Variation in internal pressure is the most common concern for operators, and has been linked to a number of failures. This cyclic loading leads to progressive, accumulated damage in the steel, known as fatigue, which if of sufficient magnitude can lead to the initiation and propagation of cracks that can cause failure. Typically, pipeline fatigue is more of a concern for liquid pipelines where much larger magnitude pressure swings, and hence stress variations, are observed compared to those carrying a compressible gas product.
There have been a number of high-profile pipeline failures caused by fatigue cracking; for example a 40-inch diameter crude oil pipeline in France in 2009[ ]. These types of failure are rare , but it is reasonable to expect that the fatigue problem will get more difficult to manage as pipelines age.
Assessment methods for quantifying fatigue damage in pipelines are well established in the industry (e.g., API 579 or BS 7910). Fatigue life is reduced by orders-of-magnitude in the presence of a stress concentration; e.g., a geometric deformation such as a dent, or an anomaly such as a weld flaw. Methodologies such as API 579 or BS 7910 can explicitly consider the presence of an anomaly or the magnitude of a localised stress concentration.
A simpler ‘S-N’ approach is used to determine the fatigue life of a pipeline, usually at the pipeline’s design stage, which is based on empirical curves which link stress range (S) to predicted number of cycles to failure (N). The SD-N approach is limited to predicting the fatigue life of an anomaly-free seam weld or pipe body. More often than not, during an assessment of remaining fatigue life for an existing pipeline, the presence of an anomaly has to be considered explicitly. This could be an actual anomaly detected by ILI, or one that could be theoretically present in the pipeline, in the form of one that survived the pre-service pressure test, one sized below the ILI detection thresholds, or one that would have passed the pipe mill quality control requirements.
When calculating the remaining life of a crack-like anomaly in the presence of cyclic loading, the fracture mechanics approaches in API 579 and BS 7910 are required. These methods have been successfully applied for determining remaining fatigue life, in multiple industries, including the pipeline industry; however, the methods are known to be conservative. This article outlines an approach for reducing the conservatism in these assessments, allowing operators to safely extend anomaly remediation dates and reassessment intervals, supporting economical operation by reducing unnecessary digs.
Figure 1: 40-inch crude oil pipeline, long seam fatigue crack.
Fracture Mechanics Methods
Fatigue crack growth rate can be described as the crack growth per stress cycle. The relationship between crack growth and applied stress is represented by a sigmoidal curve with three distinct regions, Figure 1, which is typical of crack growth in-air. The first region, at the left-hand side of the Figure, is where crack growth rates are expected to be extremely low, or there is no growth at all. The second region is characterized by a linear relationship between the crack’s stress intensity factor (stress intensity is related to the applied stress and the size of the crack) and the crack growth rate. The final region describes the rapid crack growth leading to failure.
The central linear portion of the curve can be described by the Paris-Erdogan equation, which is a simple single slope relationship, and the most common way to model crack growth within industry. It is given by:
=A.∆Km
Where da/dN is the crack growth rate and ∆K the applied stress intensity factor range. A and m are empirical constants that relate to the
da dN
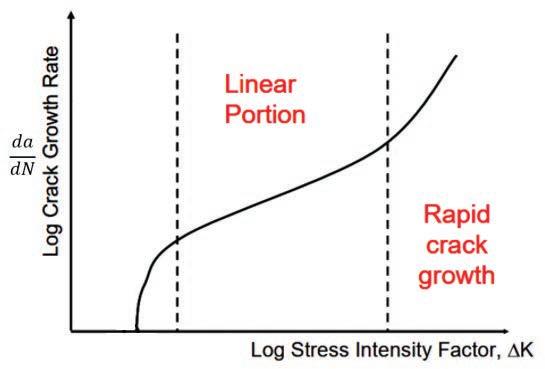
Figure 2: Crack growth versus stress intensity factor.
particular material or environment which the crack is in. Within the pipeline industry, this equation is widely used to determine the rate of fatigue crack growth and for estimating when a crack would reach a critical size. Dissecting this equation gives a basic understanding of where the conservatism in the assessments come from.
First, consider ∆K, which describes the variation in stress intensity at the tip of the crack in question. The variation in stress intensity is calculated based on the cyclic stress, and this is generally determined by simplifying cyclic pressure data (retrieved from a pipeline’s SCADA system) into an equivalent number of stress cycles at a single pressure using Miner’s rule, a shape factor, and the crack depth. An option for reducing ∆K and fatigue crack growth rate is by reducing the pressure cycling regime, specifically a smaller range between the maximum and minimum pressure; for example, by controlling pumping station sequences, valve configurations, etc. Reducing pressure range can produce dramatic increases in fatigue life, as crack growth rate is related to the exponent ‘m’ in the Paris-Erdogan equation. The value of ‘m’ is typically 3: this means that a halving of the pressure range produces a reduction in crack growth rate of (0.5)3 or an increase in fatigue life of 8. Similarly, if pressure ranges are reduced by a factor of 3, the increase in fatigue life is 3x3x3=27.
If changing the operation of the pipeline is impossible then we must look at how ∆K is related to the crack growth rate. This is where the focus moves to the two constants within the equation, A and m, which define the magnitude of fatigue crack growth versus ∆K. These are obtained experimentally by curve fitting fatigue crack growth data. A number of these constants are given by standards such as BS 7910 for different materials and environments, such as dry air or a marine environment. The impact of these empirically derived constants is therefore critical on determining the fatigue crack growth rate (FCGR). Recent test work carried out by the Pipeline Research Council International (PRCI) derived new constants to define fatigue crack growth in pipelines. 72 fatigue crack growth tests were carried out on 12 pipeline materials (including one ERW weld material) (ref. [ ]). The test work observed that in general growth rates in air were 2 to 3 times lower than the growth rates derived when the generic cross industry constants recommended in BS 7910 are considered.
What work can be done to reduce FCGR conservatisms
As discussed, reducing the level of pressure cycling is often not an option due to throughput requirements or operational constraints (e.g., line-packing, batch operation). One of the remaining options is to use less conservative crack growth constants. For situations where line pipe material is available, a series of tests can be completed to obtain pipeline specific fatigue crack growth constants, which can be expected to be less conservative than the generic constants. A series of three test types provides a comprehensive methodology for obtaining validated FCGRs.
Test 1 - lab test
Lab tests can be competed to determine pipeline specific constants. One popular technique is single edge notch bend (SENB) tests, where a sample of pipe is taken and flattened, a single notch added in the centre of the sample and clips added either side to provide the repeated loads. Crack growth is measured from the notch by direct current potential drop and correlated with the stress intensity factor to determine constants A and m.
During previous work, ROSEN completed SENB tests for an Australian client to determine FCGRs in-air. A comparison was made to the PRCI results, see Figure 2. The PRCI results shown are only those for parent material; other results in the programme for ERW bond lines have not been shown. The PRCI work fitted a more conservative single slope Paris law, rather than a less conservative two slope law. However, it can be seen that the mean of the ROSEN results is very close to the mean of the PRCI parent data. The upper bound of the ROSEN results is slightly above the corresponding upper bound of the PRCI data. Overall, it is considered that the ROSEN results and the PRCI results are consistent and support the view that the BS 7910 recommended upper bound growth rate is conservative for pipeline applications. The measured FCGRs allowed the client to make more informed future integrity decisions.
It is considered prudent to validate the derived rates with further testing if pipelinespecific laboratory derived constants are used in real life applications.
Test 2 - ring testing
For most small-scale laboratory tests such as SENB, the curved pipe segments are flattened, introducing tensile and compressive strains that change the behaviour of the material: these changes need to be understood before using laboratory-derived FCGRs for field applications.
‘Ring’ testing can be described as a 2-dimensional model of the (3-dimensional) pipeline structure, where a short ‘ring’ of steel is cut from the pipeline and placed inside a test tension rig. This ring can be pressure cycled to investigate the effects of fatigue loading.

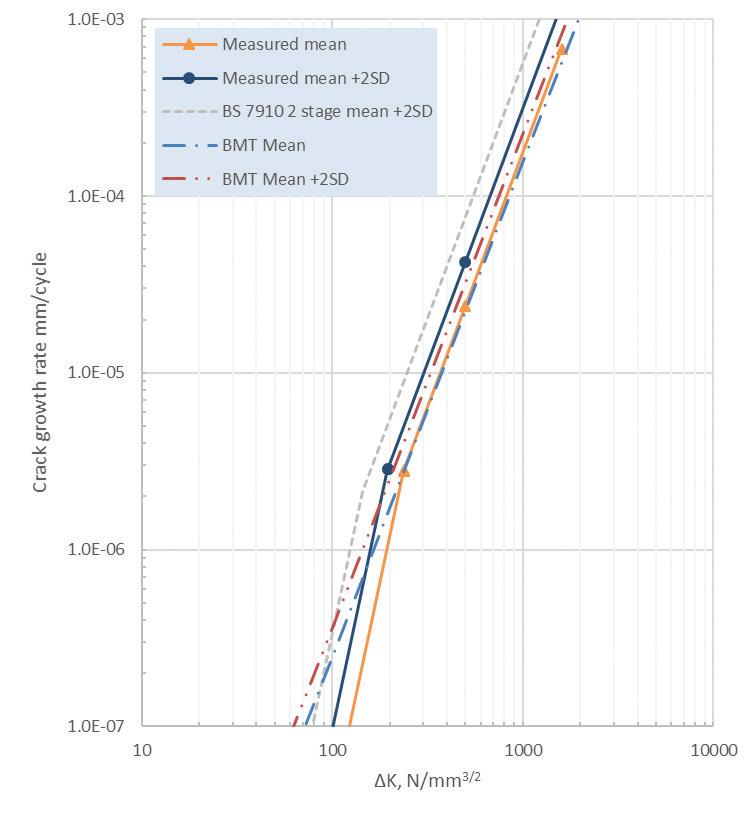
Figure 4: Measured FCGRs, PRCI results (BMT in Key), and BS 7910 FCGRs.
Introducing electro discharge machining (EDM) slits into the ring allows for the modelling of FCGRs as fatigue cracks can nucleate and grow from the edge of the slit. The rate at which these cracks grow can be measured using the direct current potential drop technique; the FCGR can then be compared to what would be predicted by the growth rate constants derived in Test 1. The testing also allows for the presence of other radial stress concentrations anomalies to be understood; e.g., pipe roof topping and ovalities.
The main benefit of ring testing is that it allows multiple model fatigue tests to be completed in a time effective manner and at a lower cost. Allowing for the FCGRs to be validated considering difference EDM slit sizes, pressure ranges and number of cycles. Also, as the anomaly modelled is considered infinitely long, it adds a layer of conservatism to what would be expected in a real-life situation.
Validating the predictions from the FCGRs determined in the small scale SENB lab tests with ring expansion tests allow for the full pipe wall to be tested under realistic hoop stress conditions, and without deformation in the simple SENB specimens in Test 1.
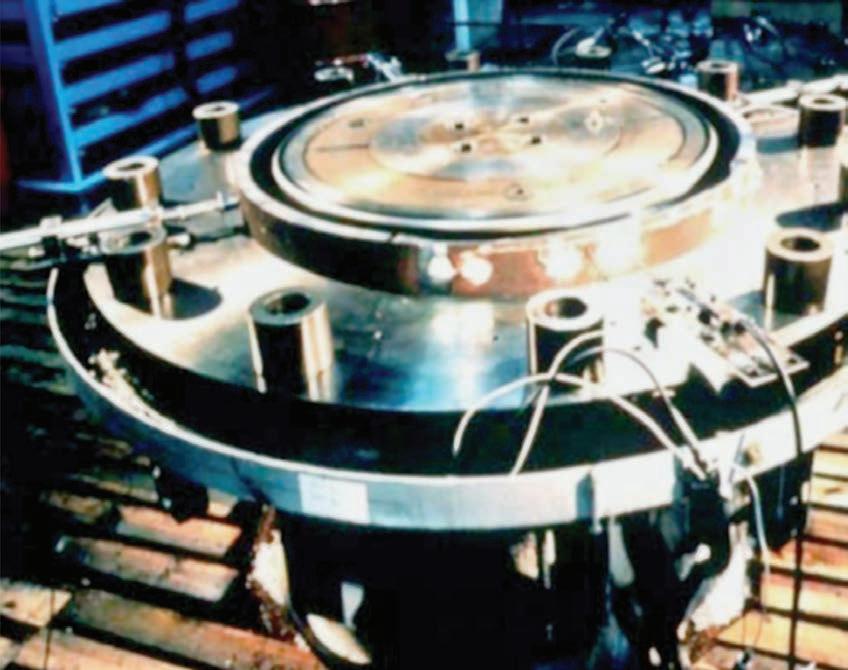
Figure 5: A ring tension test machine.
Test 3 - full scale test
The final step to confirming that FCGRs are suitable for use in critical decision making is by completing a full-scale fatigue test. This requires a sample pipe spool that would be turned into a pressure vessel by welding on two ends. EDM slits would be machined to provide initiation sites for fatigue crack growth. The vessel is then filled with a test liquid and a suitable pump used to apply repeated pressure loads, simulating operational pressure swings. Again, the rate of fatigue crack growth is measured and compared to that found in the SENB and ring expansion tests.
ROSEN completed a full-scale fatigue test for a client who wanted to understand whether the operational regime was sufficient to cause fatigue crack growth. The set up for the test can be seen in Figure 3. For this setup, fatigue crack growth was measured using the alternating current potential drop measurement technique. For this client, it was demonstrated that the operational regime was not sufficient to promote fatigue crack growth.
The full-scale test is the final stage in validating FCGRs, and complements Tests 1 and 2. FCGRs can be confirmed in a full-scale setup, and more realistic safety margins used. This allows an operator a better understanding and prediction of when and how cracks could grow by fatigue to an unacceptable size. Another advantage of a fullscale test is it allows for real anomalies taken from the field to be investigated for potential growth
due to fatigue cracking under different pressure cycling regimes. Using real anomalies also leaves the option of burst testing at the end of any test to validate models used to predict failure pressure.
Summary
FCGRs published in standards like API 579 and BS 7910 are necessarily conservative to cover the standards’ varied use. This conservatism has been quantified by the PRCI in the USA, and corroborated by the work completed by ROSEN in the UK. More realistic, and less conservative FCGRs can be obtained from laboratory tests. Simple bend tests will reduce conservatism, and ring testing (2-dimensional model of a pipeline) and full-scale tests with further reduce conservatism, providing a pipeline operator with robust and validated FCGRs which can be confidently used for cost effective future integrity planning.
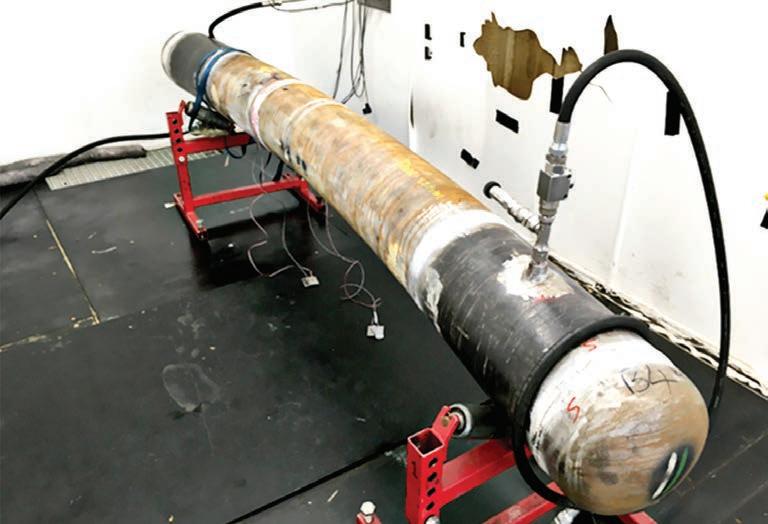
Figure 6: A full scale fatigue crack growth set up.
REFERENCES
i Dafea, et. al., “Investigation into the Failure of a 40” Diameter Crude Oil Pipeline”, IPC2021-90597, Proceedings of the 9th International Pipeline
Conference, Calgary, September 2012. ii PRCI – “Improved Methods for Estimating Remaining Fatigue Life of ERW Pipelines”, Project BMT 20147, final Report, 27 October.
For more information visit www.rosen-group.com


Standing up under pressure since 1968
For over fi ve decades, Pollard’s Sawdust Supplies has gained a reputation as a trusted national supplier of over 20 types of bagged and graded sawdust and wood shavings products which are used in a variety of industries including pipeline construction. Our pipeline bedding/dunnage bags are extremely durable and reliable. Our range includes 3 sizes, containing all-natural chemical free packing sawdust. The bags are capable of withstanding up to 15t of pressure and won’t explode or balloon under the weight of the pipe. Not only that, they’re far lighter than sandbags and are also biodegradable. NO BULLDUST - JUST SAWDUST!
Contact us for more information about our products, request a free sample for evaluation, or place an order. www.sawdust.com.au
