8 minute read
The Power of Genetic Recombination
OR... It’s Complicated” Sean McGrath
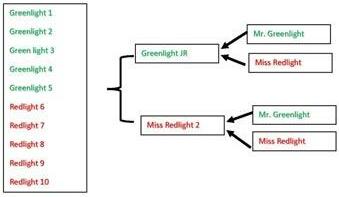
Perhaps the question I am most often asked regarding genetics is how full sibs or animals with the same pedigree can have different EPD. A good way to explain this is through a pedigree tree. In this example, we are going to breed Mr. Greenlight to Miss Redlight to create 2 full sibs (Greenlight JR and Miss Redlight 2) which we will then mate to produce a sample of 10 full sibs that represent just a few of the thousands of potential outcomes (Figure 1).
Advertisement
Figure 1. A pedigree tree showing 2 matings of Mr. Greenlight to Miss Redlight and the subsequent mating of full sib offspring Greenlight JR and Miss Redlight 2 to produce 10 calves.
Our logical mind may say at this point that these offspring should be very similar. After all, the pedigree is identical on both sides of the final mating. This would be a very tightly linebred scenario. Let’s follow our example through in a bit more detail and see what happens.
First, we need to understand that every calf is a combination of 1⁄2 of the genes from the sire and 1⁄2 from the dam. These genes are spread across 60 chromosomes or 30 pairs. For this example, we are going to simplify things and use 3 pairs of chromosomes to make our point. We will use Mr. Greenlight’s chromosomes as an example (Figure 2.). There are two pairs of regular chromosomes (Pair 1, Pair 2) and 1 pair of sex chromosomes (Pair 3). The sex chromosome will determine if the calf is a male or female. If Mr. Greenlight passes on the small chromosome in pair 3 the calf will be male. If he passes on a large chromosome from pair 3 the calf will be a heifer.
To further simplify we will assume that Mr. Greenlight is homozygous for every gene in his DNA. In other words, for every gene both of his copies are the same. We will assume the same thing for Ms. Redlight. This massive oversimplification means that the original animals in the pedigree can only pass on one version of each gene they possess.
In the first mating we get one male calf and one female calf. They each contain one gene copy from Mr. Greenlight and one copy of each gene from Ms. Redlight. The pedigree tree is shown fleshed out to show the actual chromosomes and DNA that are passed forward (Figure 3.). If we look at the example, it is apparent that even though Mr. Greenlight Jr and Miss Redlight 2 have the same parents (they are full sibs) that they have 1 chromosome in pair 3 that is completely different (circled). If they did not, they would both be the same sex. In this second generation, it also appears that the chromosomes and thus the DNA of these 2 full sibs are very close. Figure 2. Mr. Greenlight's chromosome pairs
Figure 3. Chromosome map of the pedigree tree for Mr. Greenlight and Miss Redlight matings and subsequent full sib matings.
In the next generation, things start to look more complicated. To understand this, it is important to realize that animals do not pass on an exact replica of one of their original chromosomes. During the process of meiosis (producing sperm and eggs) the chromosomes will trade parts of their DNA with the other partner in their chromosome pair. This is called random recombination and is very important as it produces much of the variation that allows animals and populations to adapt to changing conditions over time. This variation is a key driver of evolution and is what creates the differences that allow cattle breeders to select cattle that fit their long-term goals. Again, these 10 calves represent a very simplified example of the potentially infinite combinations that can occur just in this simple breeding example. Looking at the chromosome profile of the example calves, we can see DNA that ranges from exact copies of grandparent DNA, matches to parent DNA and combinations that looks vastly different from any previous generations. This is all happening in a full sib mating situation. If animals are less closely related, the phenomenon could be even more pronounced.
To flesh things out a bit further let’s examine 4 of the offspring from the chromosome diagram as examples (Figure 4, 5, 6, 7). We will assume for the purposes of our example that there are only 3 traits, calving ease which is all on chromosome 1, weaning weight that is contained on chromosome 2 and sex that is determined simply by which copy of pair 3 is received from the sire.
Let’s further assign a genetic value to the genes on each of the first 2 chromosome pairs (Table 1.). By using some simple math based on what DNA the calf received we can thus assign an EPD for Calving Ease and Weaning weight to our 4 examples and see how the same pedigree can result in a very different EPD.
Table 1. Genetic values for Green and Red genes for Calving Ease on Chromosome pair 1 and Weaning Weight on Chromosome pair 2
Figure 4, A male calf that received all Green genes His genetic value is CE 20 and WW +100. Genetically the calf is identical to the original Mr. Greenlight. Figure 5. A female calf that received 1/2 Green and 1/2 Red genes. Her genetic value would be the average of Green and Red with CE 0 and WW +75. Figure 6. A male calf with approximately 70% Green genes and 30% Red genes. His resulting genetic value is CE -8 and WW +85. Figure 7. A female calf with Red genes on pair 1 and Green genes on pair 2. Her resulting CE is +20 and WW is +100.
Looking at some of the potential outcomes shown in the chromosome chart, we can start to see that things can get complicated quickly. In real life, cattle have 10 times as many chromosome pairs, hundreds of times as many traits and thousands of times as many genes. Instead of the genes for complex traits like growth or fertility being contained on a single chromosome they are spread across the genome of the animal (Figure 8).
How Do We Figure Out the Complex Problem of What Genes are Passed On?
If we head back to the original comment regarding the most common question received regarding genetic evaluation and why an animals EPD may be different from a full sib or even from the parental average, I think the chromosome example starts to explain how some of that variation may occur. Through the process known as random recombination of genes, each new generation, every sperm, and every egg contain a unique portion of sire and dam DNA. This is extremely important for animal breeders as it lets us create/select genetics that can accomplish specific goals. For example, in our simplified 3 chromosome world, we can see how we could create a “curve-bender” animal with all red genes at pair 1 (easy calving) and all green on pair 2 (heavy weaning weight).
Fortunately, there is a lot of genetic overlap between animals, and so we can start to predict potential outcomes. The first basic step is to start with the assumption that offspring will be the average of the sire and dam. This is generally a safe place to start. The second step is to collect performance data on the animal and the other animals that it is managed with. If we managed the 10 offspring shown in our Chromosome chart together, we would expect to see some performance differences in Calving Ease and Weaning Weight. These differences can help to inform us about how much Green vs. Red genes each individual carries. In the real world it is a bit more complex, looking more like Figure 8., so we use more complex methods to help determine the DNA contained in each animal. If the animal has offspring, we can use the information from their performance to help us figure out the genetics of the parent stock with increased accuracy.
Finally, with today’s technology we can conduct a highdensity DNA test in which we go directly into the DNA of the animal and look at what components are present in the genotype of the animal. In some cases, this may be for a single gene such as colour (homozygous black for example) or it may be for a more complex set of traits spread across multiple chromosomes such as growth, longevity, or carcass merit.
As we determine more information about the DNA an animal contains it is possible that the animal may change from our original prediction or away from the parental average or even from full siblings. Thinking about genetic recombination and variation explains the importance of continuing to measure and collect the data that is crucial for understanding each new generation of genetics.
This simplified example also reveals some of the power of modern genetic evaluations to navigate through an animal’s genetic map and determine their relative genetic merit for various traits. This is a tremendously powerful tool for seedstock breeders when we are sorting through genetic recombination and variability to select towards specific goals.
The power of recombination is that it lets us breed some cattle that are beyond expectation. By measuring cattle and participating in genetic evaluation, we can then identify those cattle and use them moving forward to help reach our goals.
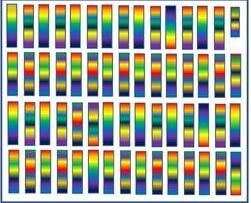
Figure 8. A more realistic graphic depiction of 30 chromosome pairs containing multiple genes per chromosome. Note that the calf is a male (Small Y chromosome in the top right)


