36 minute read
Discrete Element Modelling Overcoming the Challenges
The behaviour of bulk granular material is different from that of solids and fluids, making it difficult to predict the dynamic and even static behaviour. Until fairly recently, the design of bulk materials handling equipment relied on empirical-analytical approaches.
The Discrete Element Method (DEM) was introduced in the 1970’s as a numerical method for the modelling of granular materials as discrete particles. Over the years, advances in computer technologies have made it possible to use DEM as a design tool, either to solve existing problems in bulk handling systems or as a predictive tool to model and investigate the performance of new concepts and developments. However, there are still challenges that need to be overcome for DEM to be an effective tool in analysing large scale industrial applications.
Advertisement
Introduction
DEM models granular material as an assembly of individual or are discrete particles. The interaction between the particles
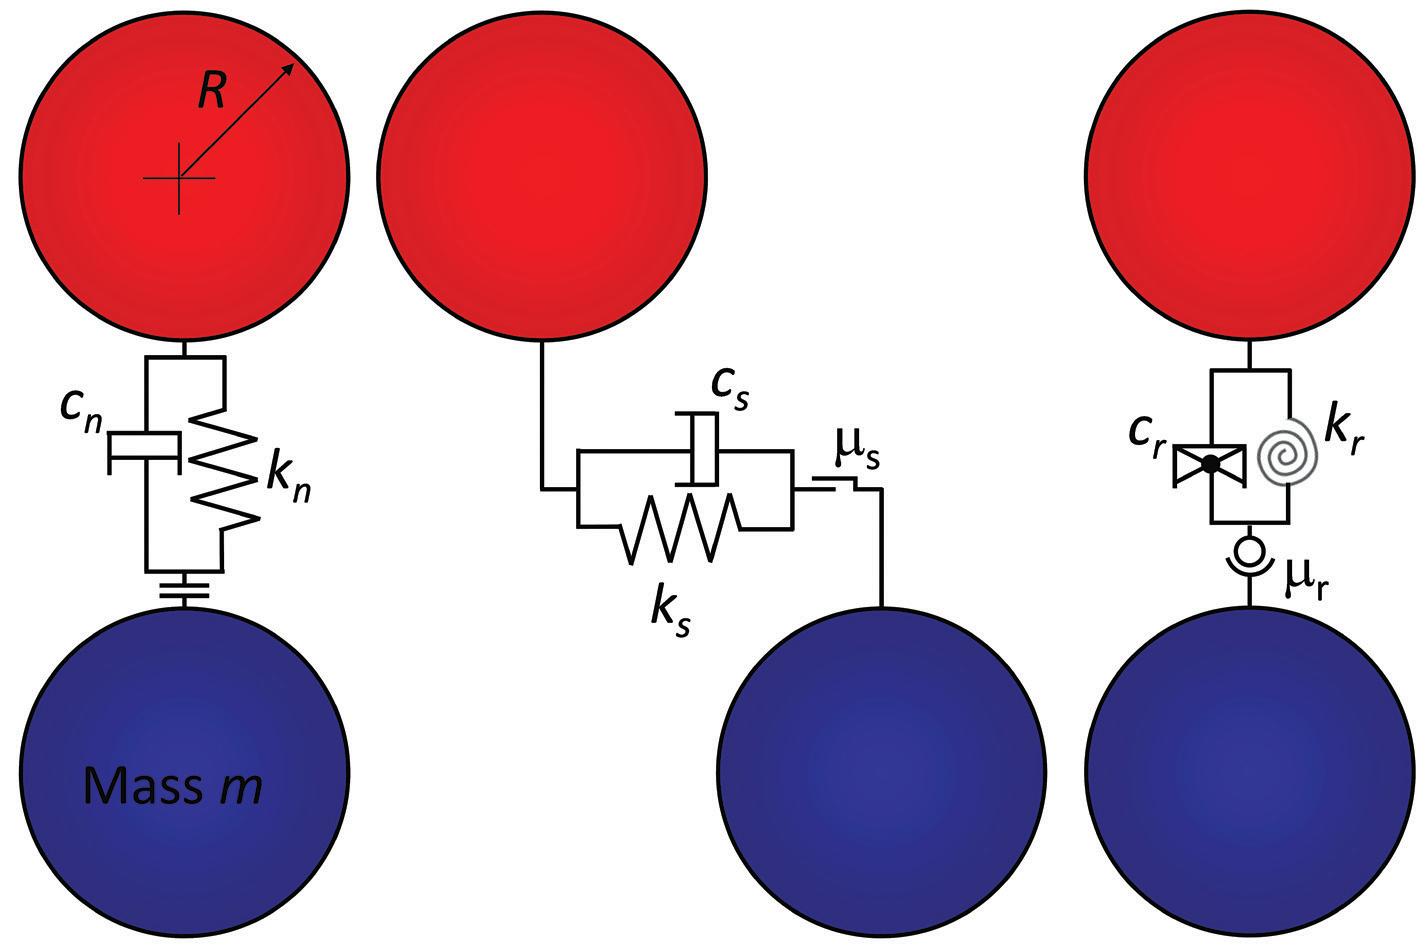
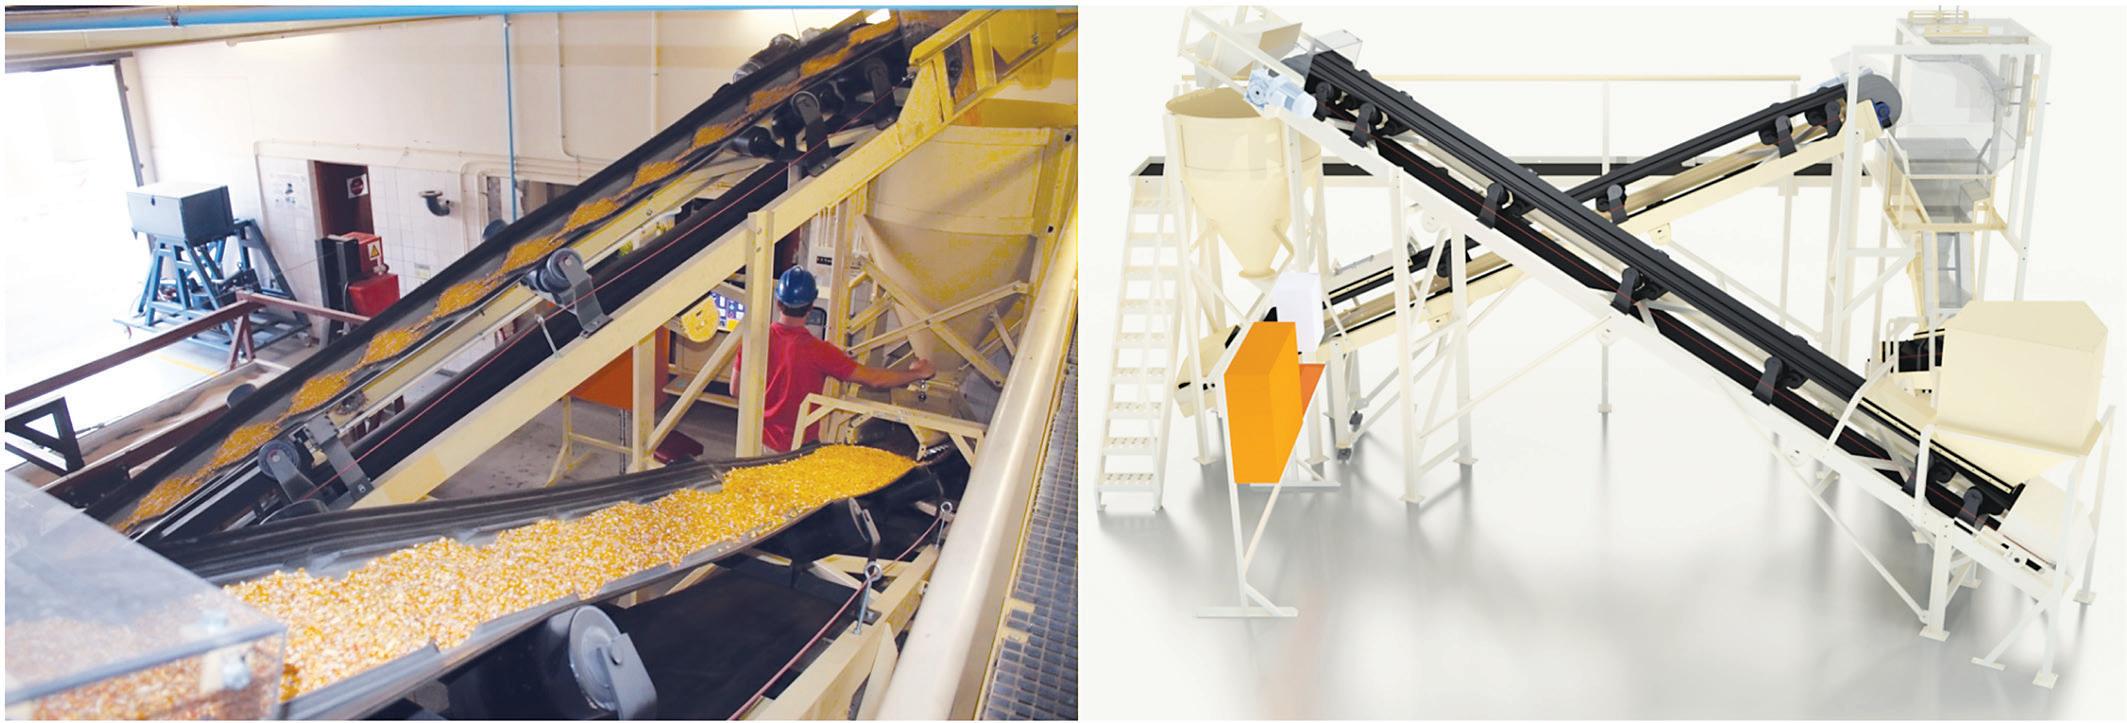
and between the particles and walls (used to define containing structures, equipment, etc) is described by a contact model as shown in Figure 1. The particles are considered rigid and allowed to overlap at the contact instead of deforming, as the physical particles would do. The contact model defines the relation between the forces and the overlap as defined by the stiffness, damping and friction at the point of contact. A single DEM time step consists of three phases: contact detection, calculation of contact forces and the integration of the equations of motion which includes updating the position and orientation of the particles. The most commonly used contact models include the linear and Hertz-Mindlin models. In the case of the linear model, the contact force is a linear function of the overlap while in the Hertz-Mindlin model the force is a function of the overlap to the power 1.5, resulting in a non-linear response or stiffness. In both models, the contact stiffness can be related to a combination of the elastic properties of the individual elements (particle and/or wall) in contact, namely Young’s modulus, the shear modulus and Poisson’s ratio. The force in the tangential direction is limited by a Coulomb type friction coefficient which allows for relative sliding between the elements at the contact. The friction is responsible for the dissipation of energy from the system which can be increased by introducing a damper (dashpot) at each contact. Rolling resistance in the form of a moFigure 1 – Schematic representation of the typical normal, tangential and rolling contact models for cohesionless materials ment acting at the point of contact can also be introduced. Similar to sliding Figure 2 – The large scale laboratory conveyor transfer facility at Stellenbosch University for testing chute designs and validating DEM models
friction, the magnitude of this moment is limited by a rolling coefficient of friction.
Application of DEM in bulk materials handling
DEM can easily model the discrete behaviour of granular materials which includes large displacements, gravity driven flow, forced flow, mixing and segregation. Typical industrial applications that can be analysed include belt conveying and transfer chutes where the flow of material can be modelled from the feeding belt, through the whole transfer chute and onto the receiving belt. Typical results include the particle trajectories and complete flow path, impact velocities and forces on the chute liners and the receiving belt (which can be used to predict rates of wear and dust liberation), the prediction of any blockage, build-up, spillage and off-centre loading. The Granular Materials Research Group (GMRG) at Stellenbosch University is currently undertaking studies to develop DEM procedures for accurate and efficient modelling of transfer chutes. The models are validated using a large scale laboratory conveyor transfer facility with transparent chutes and instrumented with flow sensors and high speed cameras as shown in Figure 2. The filling, static behaviour and dynamic discharge from bins, silo’s and hoppers can be analysed and used to predict the rate of flow, the flow patterns (mass flow and funnel flow) and the pressures exerted on the walls which can be used in structural design and analysis. Equipment can be analysed and improved or fully optimised. For example: ship unloading grabs, excavator and dragline buckets and bucket elevators. Other applications include feeders, mixers (blending), screens, crushers and tumbling mills.
Although most bulk handling systems and equipment can be analysed with DEM, models are only of practical value if the results are accurate enough to be of use as an effective design and predictive tool. This can be applied to industrial scale applications only if an appropriate set of model/material parameter values can be determined and the results obtained within a reasonable time frame. The behaviour of the particles in the model is governed by the parameter values which in general include particle shape, particle size, particle density, contact stiffness, friction (sliding and rolling) and damping characteristics. Determining the correct parameter values is referred to as DEM calibration. Most DEM codes make use of an explicit time integration scheme which requires the use of small time steps or increments which is inversely proportional to the square root of the contact stiffness. The typical size of a time step ranges from 10-4 to 10-6 seconds. Thus, to model minutes or hours of real time, a large number of time steps is required which, depending on the model complexity, can take up to hours, days or even weeks to complete. Methods to decrease the computational effort exist, but should be implemented with care. These include particle coarse graining where the particles are scaled up in size to reduce the total number of particles in the model and reducing the contact stiffness to increase the size of the time step. These measures should already be accounted for during the calibration phase and cannot be adjusted afterwards unless the calibration process is repeated or the model results compared with a benchmark.
Calibration of DEM parameters
Although most of the model parameters have a direct physical interpretation, research has shown that measuring the material properties at particle or contact level does not necessarily provide accurate results at bulk level. DEM models rely on simplifications and assumptions to ensure a solution can be obtained in a timely manner. For example, the particle shape can never be exactly modelled in terms of shape and texture, especially if natural materials are modelled as typically found in the mining and agricultural sectors,
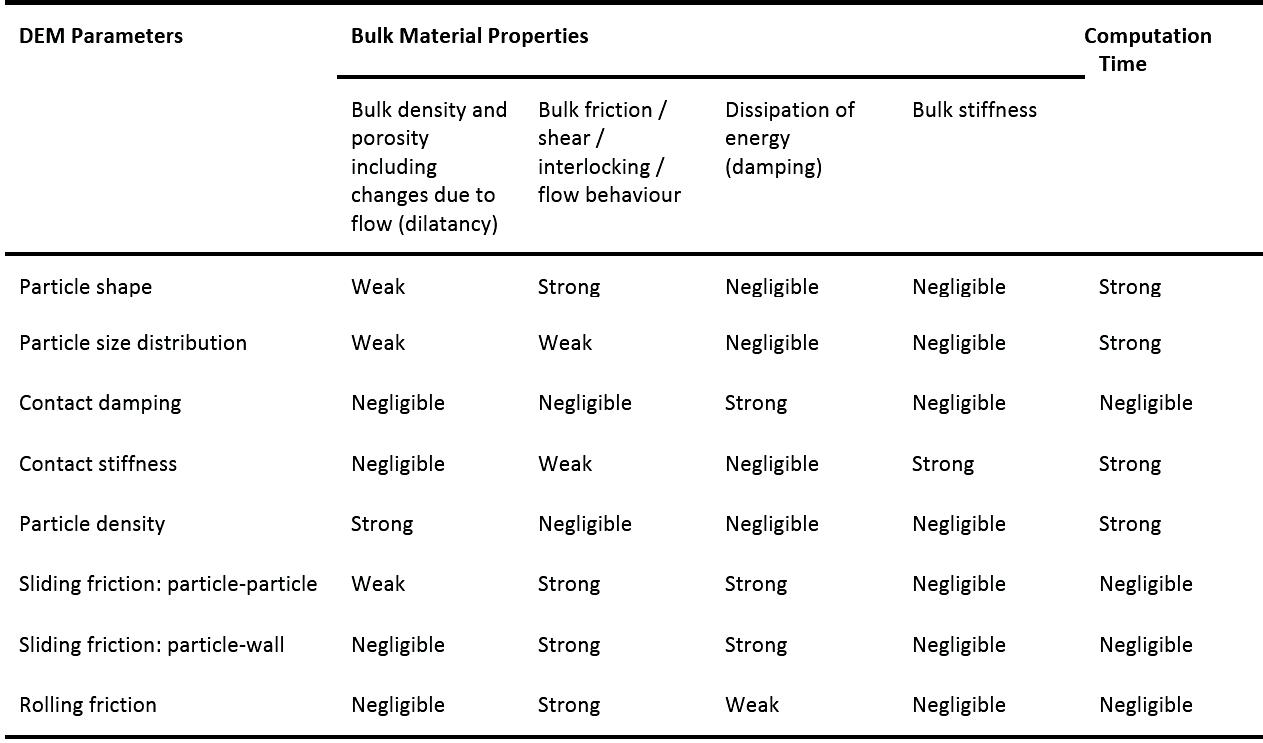
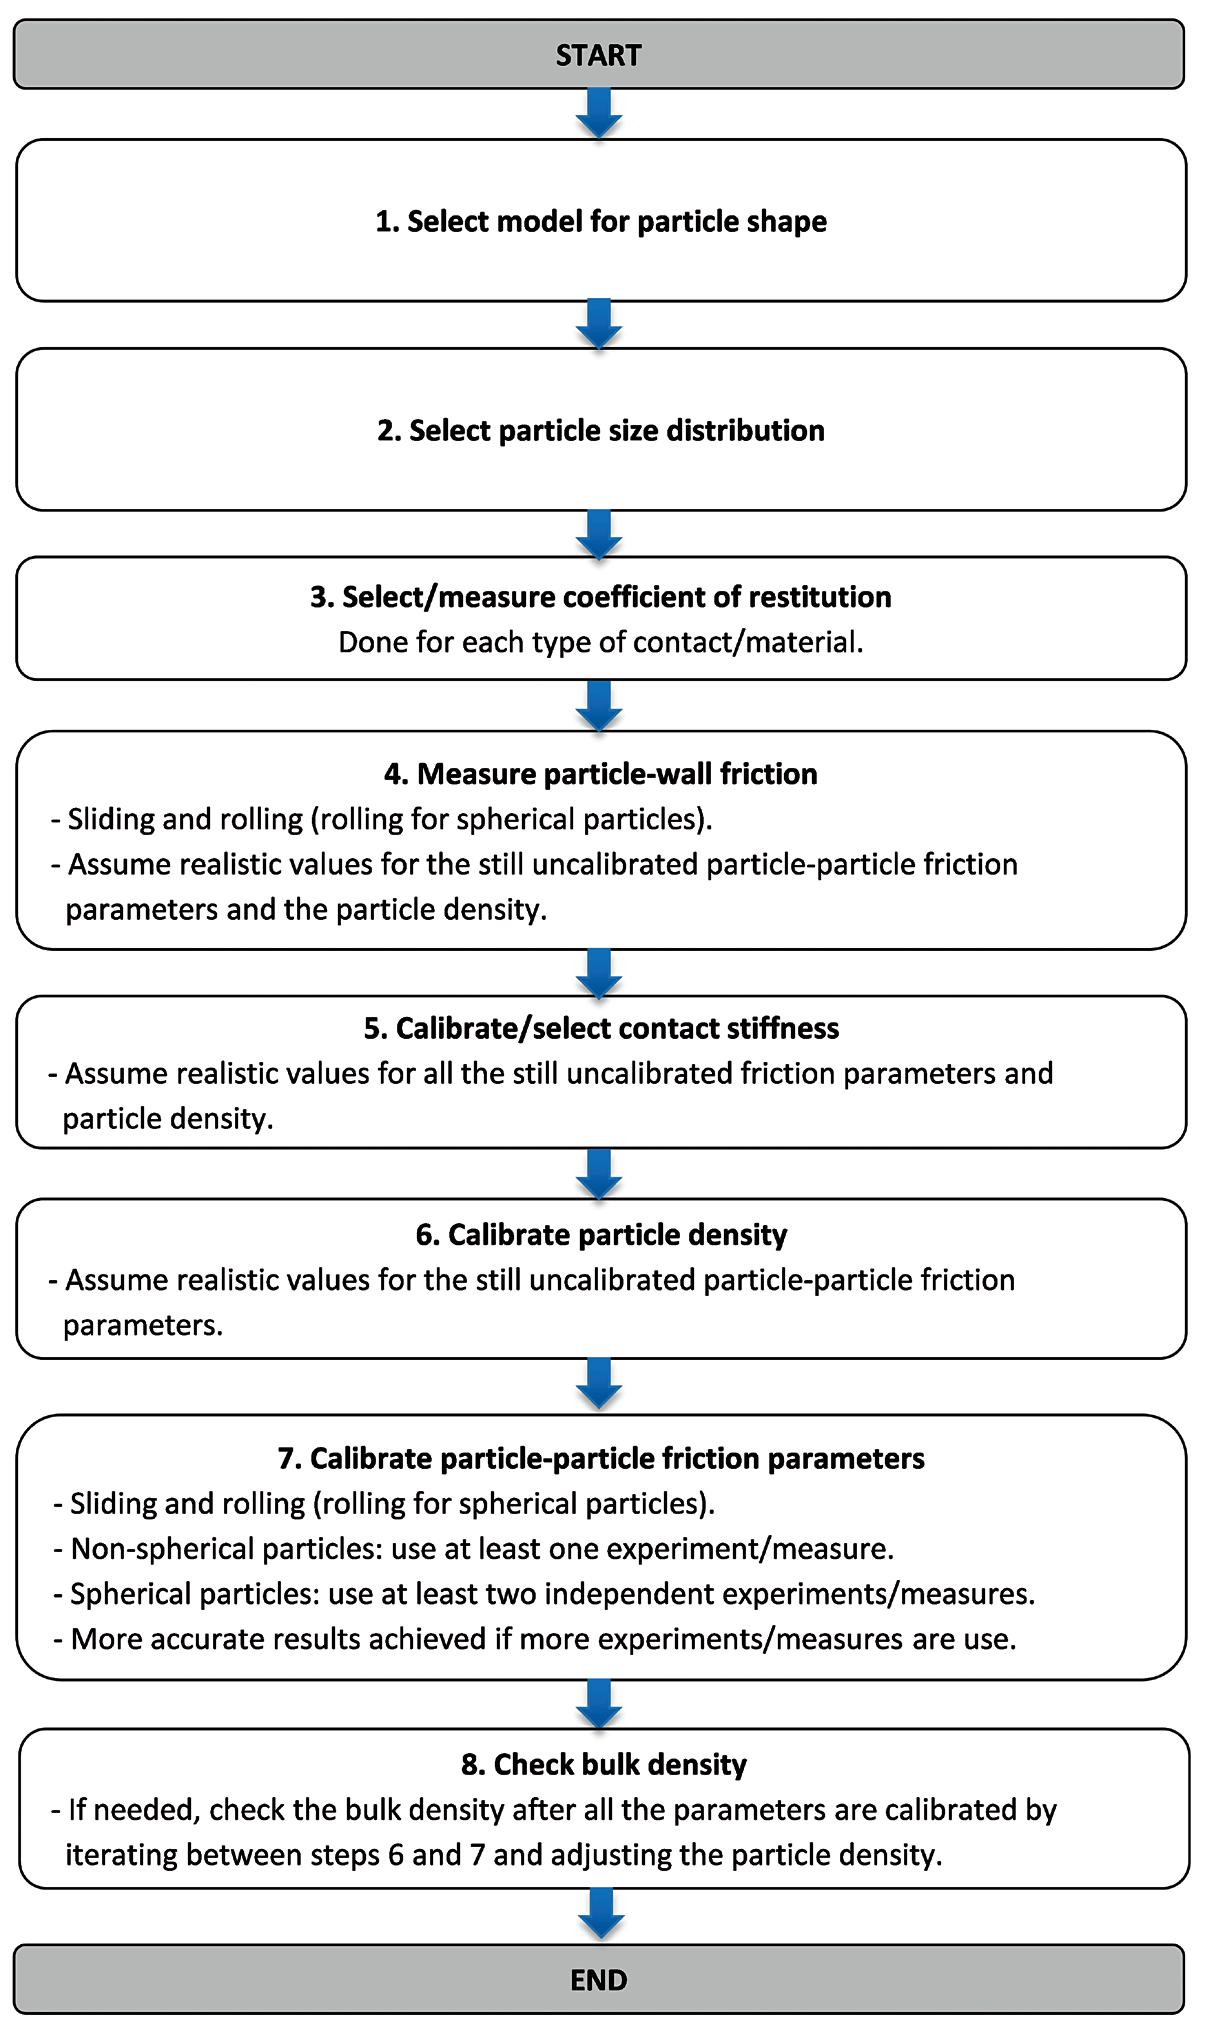
since including all these details would be computationally too demanding. Even if the shape could be exactly modelled, each individual particle in a bulk mixture will have a unique shape which is impossible to include in the model. Thus, some simplifications must be made regarding the modelled shape and surface texture. The shape influences the amount of interlocking between the particles, and this phenomenon in combination with the coefficient of friction, governs the flow properties at bulk level. Measuring the coefficient of friction is very difficult due to the size and shape of typical particles. Therefore if simplifications are made to the modelled shape, the coefficient of friction should be adjusted (from the physical value) to compensate for the lack of accurate shape modelling, ensuring that the bulk behaviour is accurately modelled. The same reasoning applies to the other parameters and it is important to understand the influence that each parameter might have on the predicted bulk behaviour. Due to the reasons highlighted above, the parameter values are usually obtained through a calibration process. During this process, laboratory or field tests are conducted to measure a number of bulk properties. The tests are then repeated in DEM, using the same geometry and constraints as in the physical tests while the parameter values are adjusted until the bulk behaviour in each of the tests is modelled with acceptable accuracy. Although this approach seems simple enough, the inter-relations between the parameters and the bulk behaviour adds additional complexity. For example, the particle-particle coefficient of friction influences not only the bulk friction but also the bulk density. Table 1 provides the qualitative relations between the parameters and the bulk properties for dry cohesionless materials under relatively low consolidation pressures. Since a number of parameters need to be calibrated simultaneously, a single test or experiment would not be sufficient because more than one combination of parameter values might provide the same bulk behaviour. A unique set of parameter values can only be obtained if the number of tests performed (bulk measures) is at least equal to the number of parameters to calibrate. However, research has identified tests that are either sensitive or insensitive to certain parameters which can then be used to calibrate and pin down the value of one specific parameter. The GMRG has worked on the development of calibration procedures and equipment for the last decade and is currently collaborating with international partners on a white paper to establish a standardised calibration process. The steps in this process are shown in Figure 3 and further discussed in this article. Note that the calibration sequence is important since it minimises the need for iterations. For now, the calibration is limited to cohesionless (dry) materials under relatively low consolidation pressures (less than 100kPa). However, ongoing research is undertaken to develop similar methods for cohesive (wet and sticky) materials. Such materials can be modelled by introducing cohesive forces to the contact model but is not the focus of this article
Particle Shape
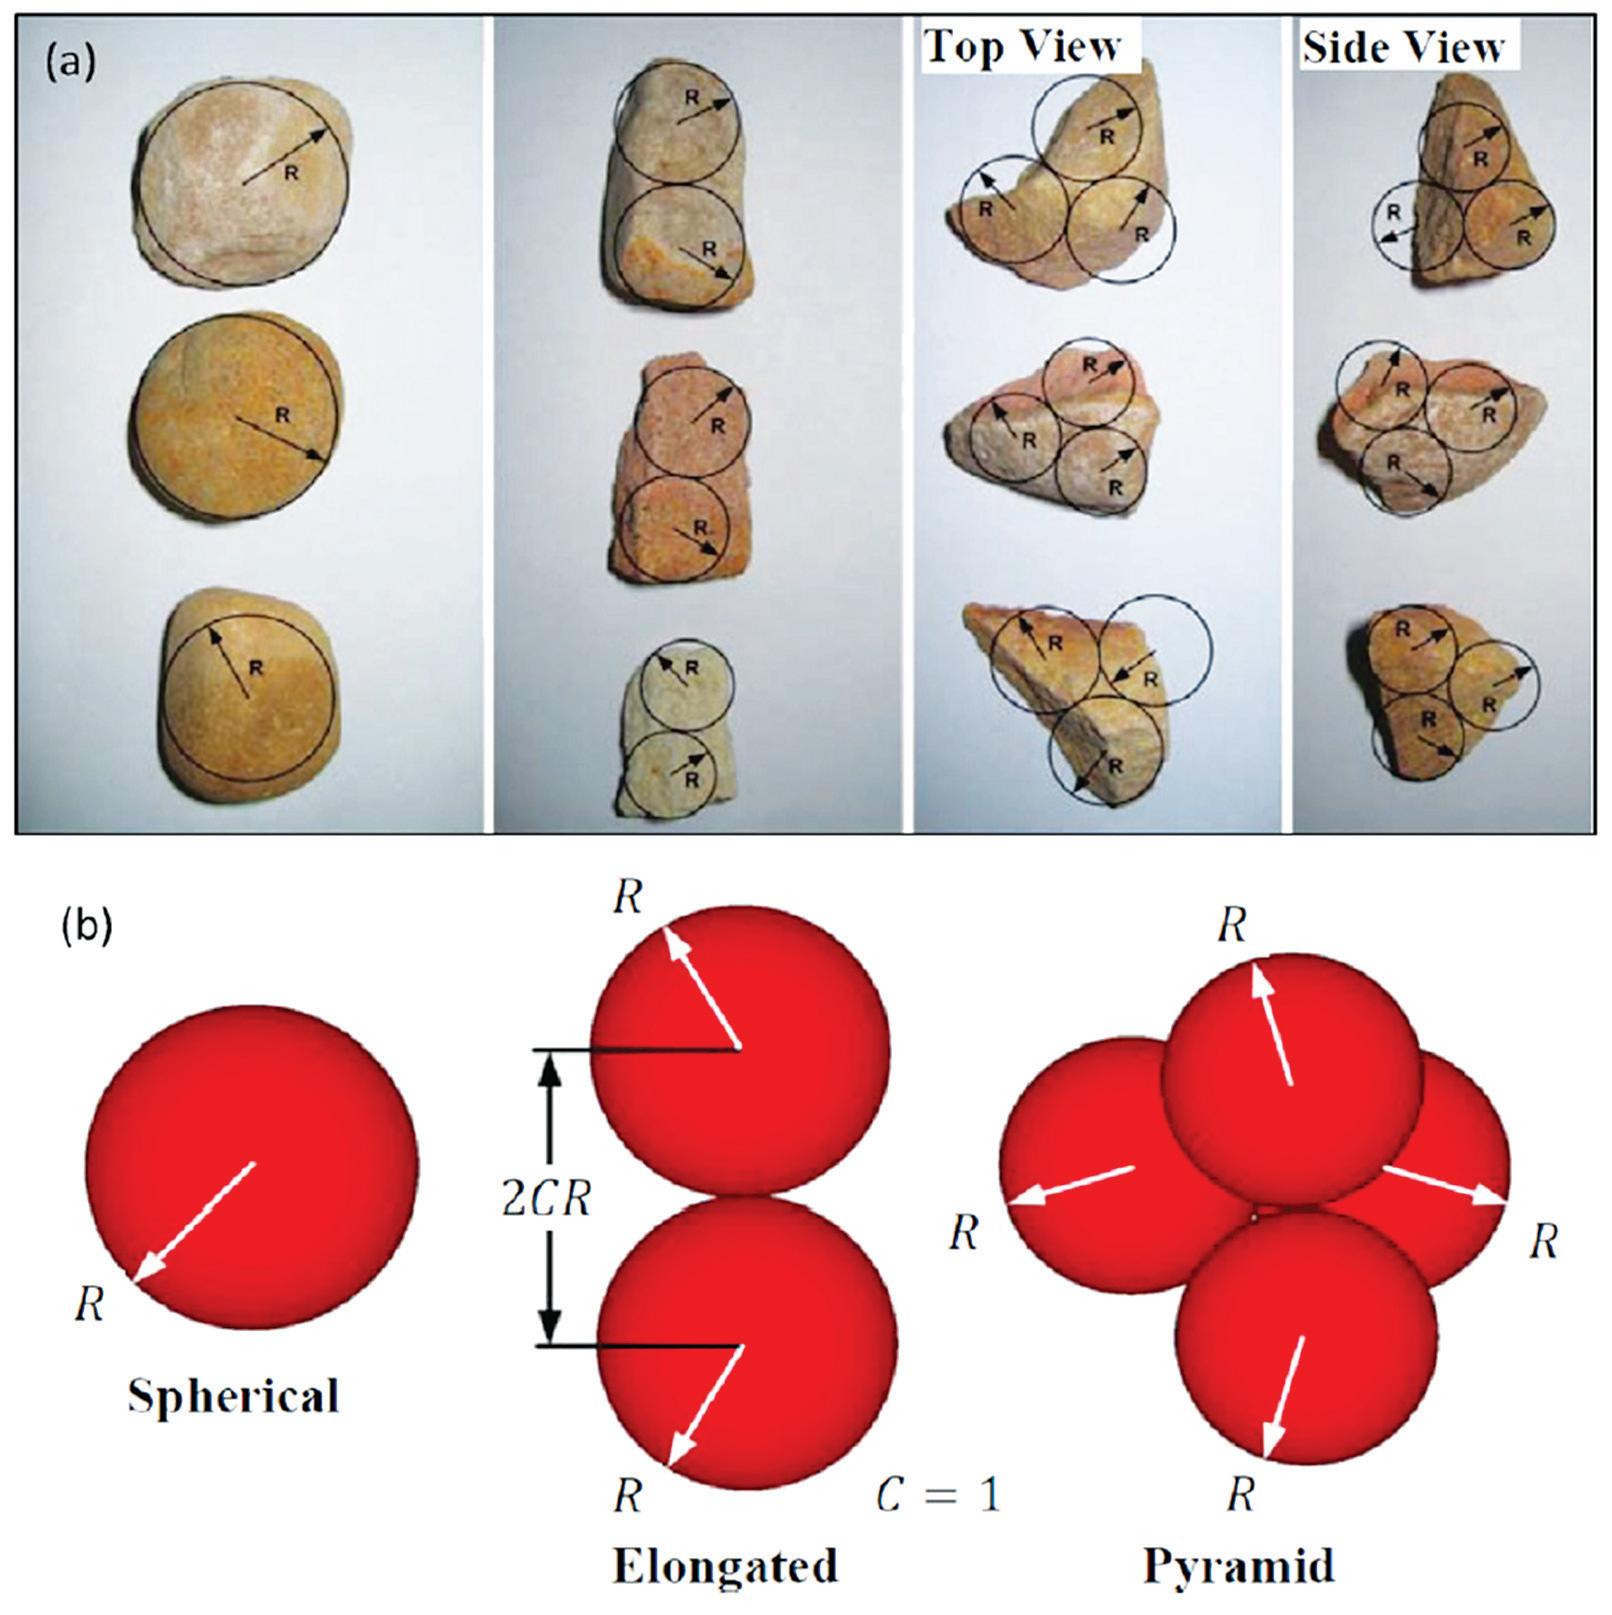
Computationally, spherical particles are the most efficient due to easy contact detection and overlap calculations. More complex shapes can be modelled by ‘gluing’ spheres together with any amount of overlap to form what is called multi-sphere particles, clumped particles or simply clumps. Other less efficient shape models include mathematical descriptions such as super-quadrics, polyhedrons and faceted particles. Although spherical particles remain the most efficient, they cannot account for the shape and rolling behaviour of real particles unless rolling resistance is incorporated in the contact model. Non-spherical particle models usually do not require the use of rolling resistance, unless the particle has a symmetry axis (for example an ellipsoidal shape) around which it can easily roll or if the material has a very high resistance to flow. Spherical particles can be used if the bulk material is relatively homogeneous in terms of particle size and shape. If non-spherical particles are used for large systems, it is proposed to use simple clumps comprising only three or four spheres in a triangular or pyramid shape, see Figure 4. The clumps can be created manually or the particles can be 3D scanned
and software used to fill the geometry with spheres in an optimised manner. If segregation, mixing, and complex flow patterns in screening processes should be analysed, more complex and realistic particle shapes should be considered. The chosen shape will influence all the other parameter values which should be re-calibrated even if a small change is made to the particle shape. The particle shape will influence the packing porosity and hence the modelled bulk density under static conditions, but also changes to the bulk density when the material is flowing where dilation or compaction could be observed. The bulk friction is also influenced by the particle shape in combination with the sliding coefficient of friction. Particle interlocking is higher for non-spherical shapes which will result in higher bulk friction values, for example the angle of repose. However, spherical particles with sliding and rolling friction can also produce accurate levels of bulk friction.
Particle size distribution
In large scale industrial applications, the number of particles can be in the order of billions to trillions. The computation time increases exponentially with an increase in the number of particles and for practical purposes using a high-end computer, the total number of particles should be kept well below one million. DEM software making use of graphics processing units (GPUs) can compute faster, but appropriate GPUs can be expensive and not readily available. The number of particles in the model can be reduced by modifying the particle size distribution (PSD) through ‘exact scaling’ (coarse graining) or ‘scalping’. In coarse graining, the whole PSD is scaled up, however, scalping is usually preferred where the finer particles are simply ignored and not included in the model. Modifying the PSD should be done with care since it can have significant effects on the results. The ratio between the size of the equipment and the particles should be kept to a maximum and as close as possible to that of the real system, while ensuring results can be obtained in an acceptable time frame. Care should be taken when modelling bin and hopper openings and transfer chutes for example. For small scale calibration tests, it is recommended that the geometry controlling the volume flow be a minimum of 10 to 20 times larger than the maximum particle size.
Contact damping
The contact damping is often expressed in terms of the coefficient of restitution (COR) which relates the velocity of a particle before and after impact. The bulk behaviour of the material is usually insensitive to the damping and values of COR = 0.2 to 0.4 are appropriate in most cases. COR can be measured via drop tests which will require the use of high speed cameras to obtain the velocity just before and after impact or the rebound height. This should be repeated for each possible contact interface and material type. However, this procedure shows high variability if the particles are not close to spherical and more sophisticated instrumentation might be needed to measure the 3D rebound path of the particles including particle rotation. Drop tests are also not suitable for particle-particle contact, but double pendulum impact testing can be considered. Values of COR determined from drop or pendulum tests can be directly used in the DEM model.
Particle-wall friction
The easiest method for measuring the particle-wall coefficient of sliding friction is the inclined wall test. In this test, a single particle is placed on a wall or plane manufactured from the material in question. The wall is then slowly inclined from the original horizontal position until the particle starts to slide. The particle-wall friction angle would be equal to the inclination angle q from which the coefficient of friction is easily calculated as mpw = tan(q). This test needs to be repeated for each of the interface material types. If the particle is close to spherical, it might roll and not slide down the incline. In this case it is recommended to glue a number of particles to a base plate, which is then
placed on the inclining wall. The inclining wall test will provide the friction values only for low contact forces. It is known that under higher pressures, the friction might be different and needs to be measured under similar conditions in a direct shear tester. However, this would require access to such an apparatus or laboratory to perform the testing. Values for the particle-wall coefficient of friction obtained in any of these two tests can be directly used in the DEM model without the need for further calibration.
Contact stiffness
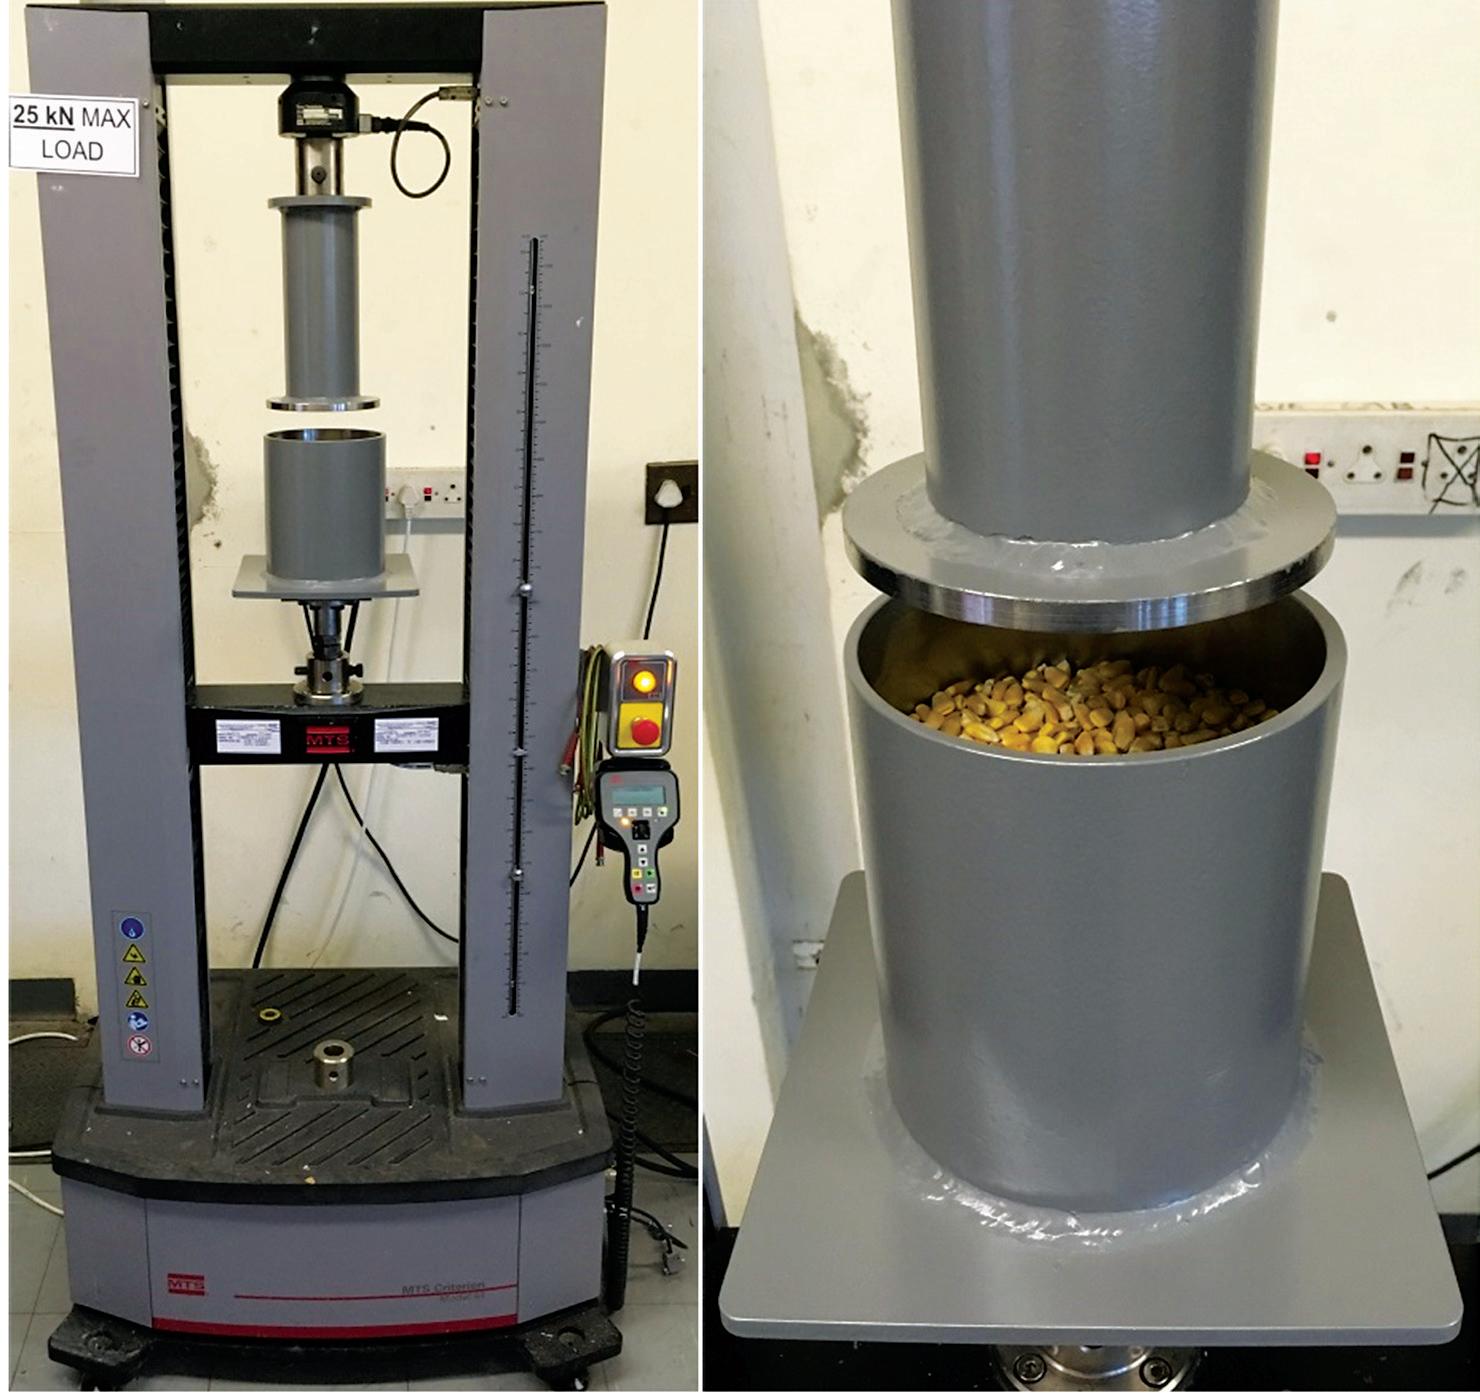
The values specified for the stiffness will depend on the specific contact model used. If the linear model is used, the stiffness is specified in the normal and tangential directions in units of N/m. These two stiffness values are independent of each other, although the tangential stiffness is usually taken between 0.5 and 1.0 times the normal stiffness. The value of the normal stiffness can be estimated using k n = 4.E.R where E is the effective Young’s modulus at the contact and R the radius of curvature (usually taken as the radius of the particle or that of a volume equivalent sphere). If the Hertz-Mindlin contact model is used, the user needs to specify the contact effective elastic properties namely Young’s modulus E, or the shear modulus G, and Poisson’s ratio (usually assumed as n = 0.3). Equipment is usually manufactured from hard materials such as steel or ceramics and it is sufficient to specify the particle-wall stiffness twice that of the particle-particle contacts. The contact stiffness and elastic properties are difficult to measure at contact or particle level and are best calibrated using a confined uniaxial compression test. A container (usually cylindrical) is filled with the material, closed with a lid and compressed, Figure 5. The load-displacement response is measured while the sample is compressed to a maximum pressure which should be of the same order as expected in the final application to be modelled. The slope of the load-displacement curve is defined as the bulk stiffness. The experiment is repeated in DEM under similar boundary conditions and the contact stiffness adjusted iteratively until the bulk stiffness is accurately modelled. The relation between contact stiffness and bulk stiffness is close to linear. The container should be large enough to minimise any wall effects and should be at least equal to 10 particles in diameter. The integration time step is inversely proportional to the square root of the contact stiffness and it is usually impractical to model large industrial scale applications without reducing the modelled stiffness. Research has shown that the stiffness can be scaled down by a factor of 10 when modelling bulk material flow under relatively low pressures. In some cases, the stiffness can even be reduced by a factor 100 without any significant loss in accuracy. Using the linear contact model, a minimum value of k n = 1.103 N/m is recommended for free flowing conditions under low pressures for materials with low bulk densities (less than 1 000kg/m3). However, a value between k n = 1.104 N/m and 1.105 N/m is appropriate in most cases. Using the Hertz-Mindlin model, the proposed minimum value for the shear modulus is G = 1.107 N/m2 .
Particle and bulk density
The bulk density should be accurately modelled if both the volume flow rate and mass flow rate are to be modelled accurately. For example, if a transfer chute is analysed and the throughput is specified in ton per hour, the DEM model can be setup to ensure the correct mass flow. However, to accurately predict any blockage and build-up, the volume flow rate should also be accurately modelled. Modelling the bulk density accurately ensures that both the mass flow and volume flow rates are accurately modelled. The bulk density can be measured by filling a container with known volume and weighing it to get the mass (weight). This process is then repeated in DEM and the particle density adjusted until the measured bulk density is achieved. Note that, depending on the accuracy of the particle shape, the particle density used in DEM will not necessarily be equal to that of the real particles. In modelling bulk materials handling, the aim is always to accurately model the bulk density rather than the particle density. Also note that at this stage in the calibration process, guesstimated values of the coefficients of friction are used which might influence the bulk density. For that reason, the density at the end of the calibration process should be re-checked and the
particle density adjusted until an acceptable level of accuracy is achieved (step 8 in Figure 3).
Particle-particle friction
The coefficients of friction at contact level should be calibrated in such a way that the bulk flow or frictional behaviour is accurately modelled. If spherical particles are used in the model, sliding friction alone will not be sufficient and rolling friction should be included. If non-spherical particles are used, sliding friction alone will suffice in most cases. In general any test or experiment which is sensitive to the particle-particle friction can be used to calibrate both the sliding and rolling friction. The tests that are commonly used include a number of angle of repose tests, direct shear tests and the draw down test as described below.
Angle of repose
The easiest test to perform is the bucket or cylinder lift test where an open ended cylinder placed on the ground is filled with material. The cylinder is then slowly lifted which allows the material to form a natural heap. One advantage of this method is that it is scale invariant and the ratio of the cylinder to particle diameter has no significant effect on the results. This is advantageous when up-scaled particles are calibrated, but care should be taken since the lifting velocity can influence the results in this case. Another approach is shown in Figure 6 where a large cylinder is filled with material. A smaller disk at the bottom of this container is then slowly pushed upwards through the material bed, allowing the material to form a heap. Note that the flow behaviour and kinetic energy involved in each of these tests are different and will not result in the same angle of repose. Therefore it is extremely important that when the test is repeated in DEM, the geometry and velocities used should be the same as those in the experiment. The angle of repose is also sensitive to the friction between the particles and the horizontal plane/wall on which the heap is formed. Any uncertainty can be eliminated by adding a ring to the wall so that a layer of particles is trapped inside. The two methods described here provide a static angle of
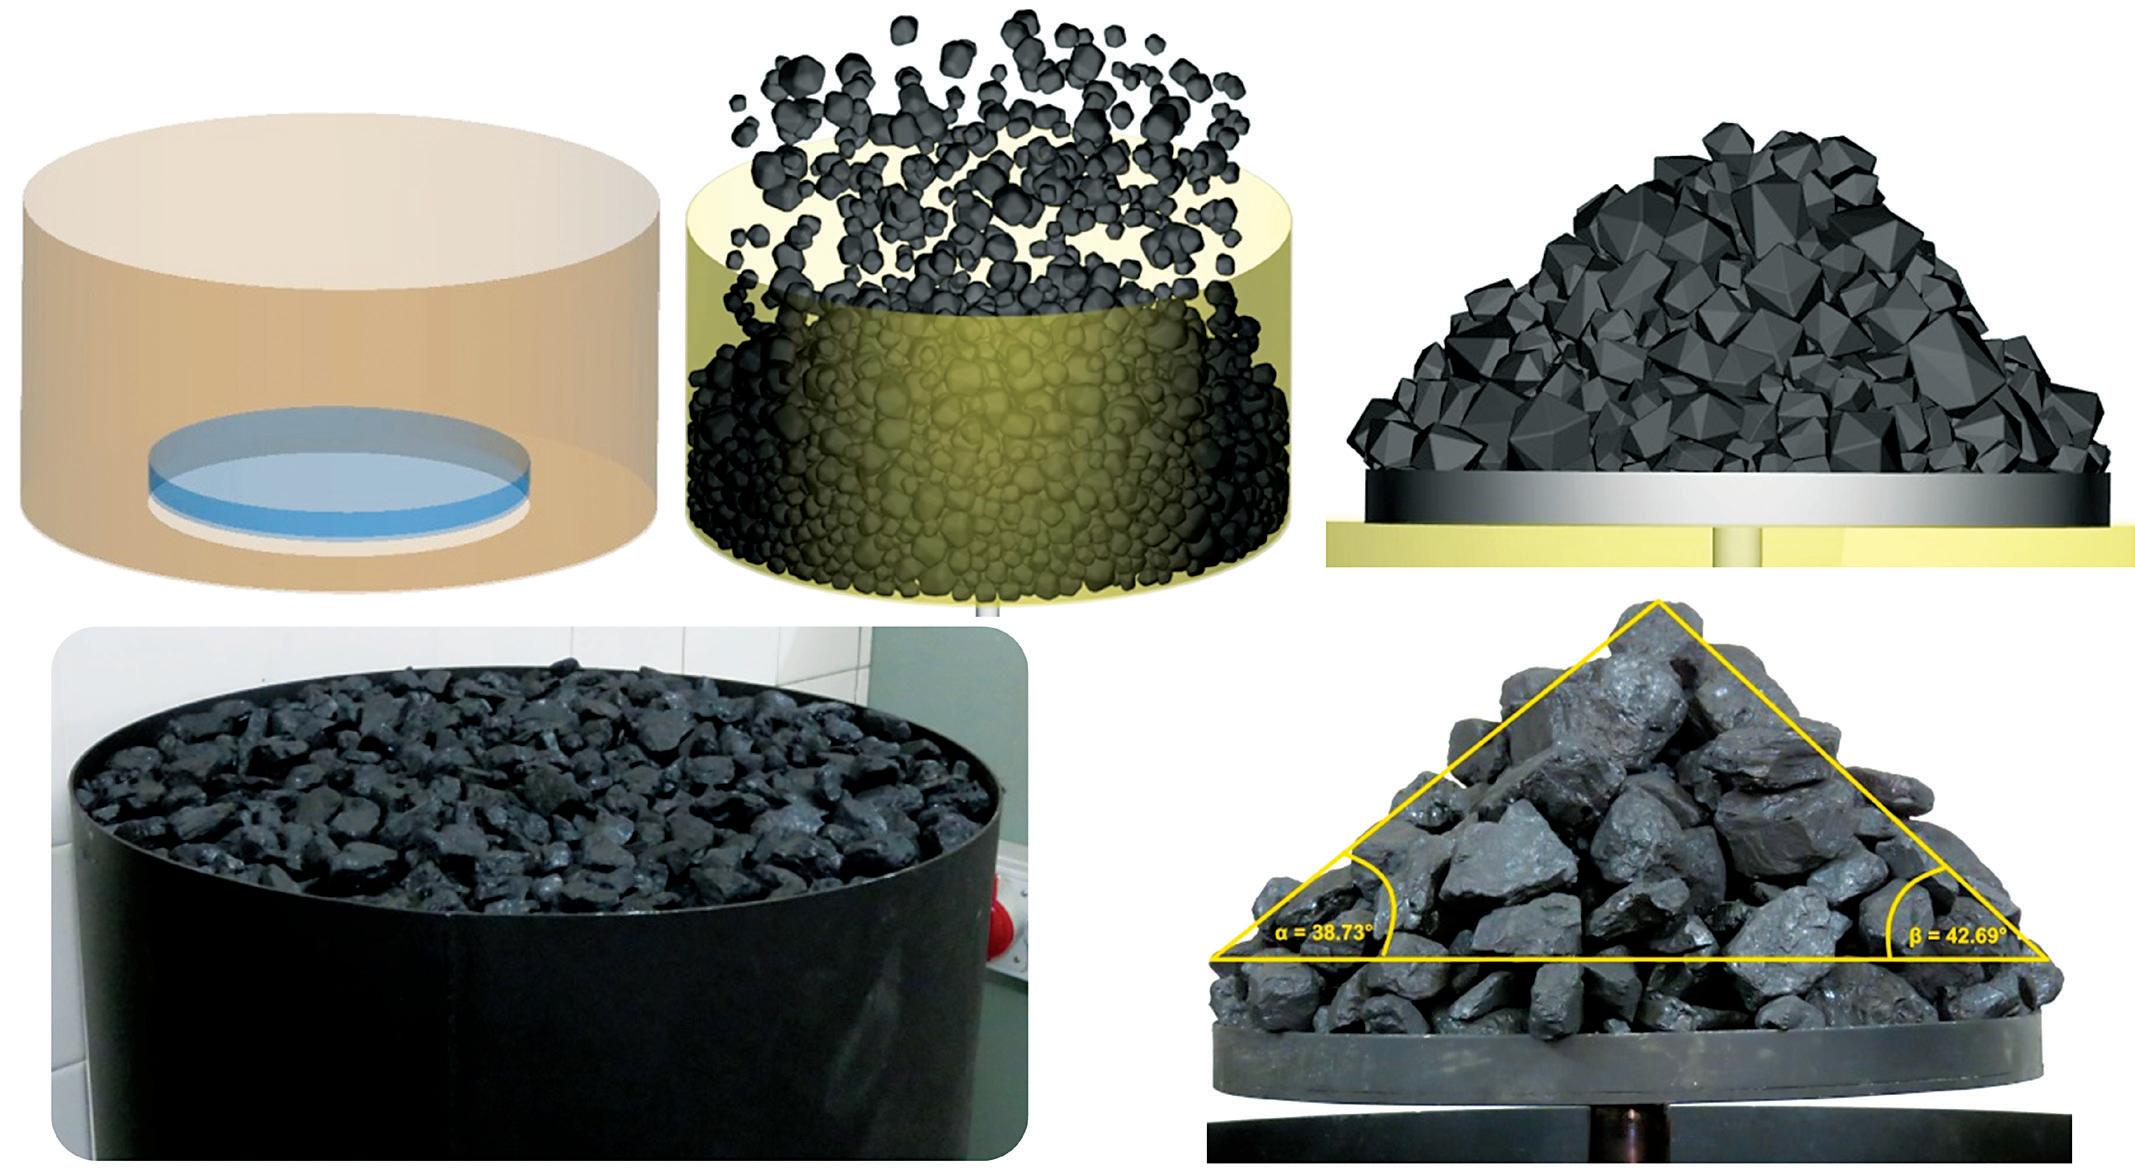
Figure 6 – Push-up angle of repose test of coal showing the DEM model at the top (not to scale) and the experiment at the bottom
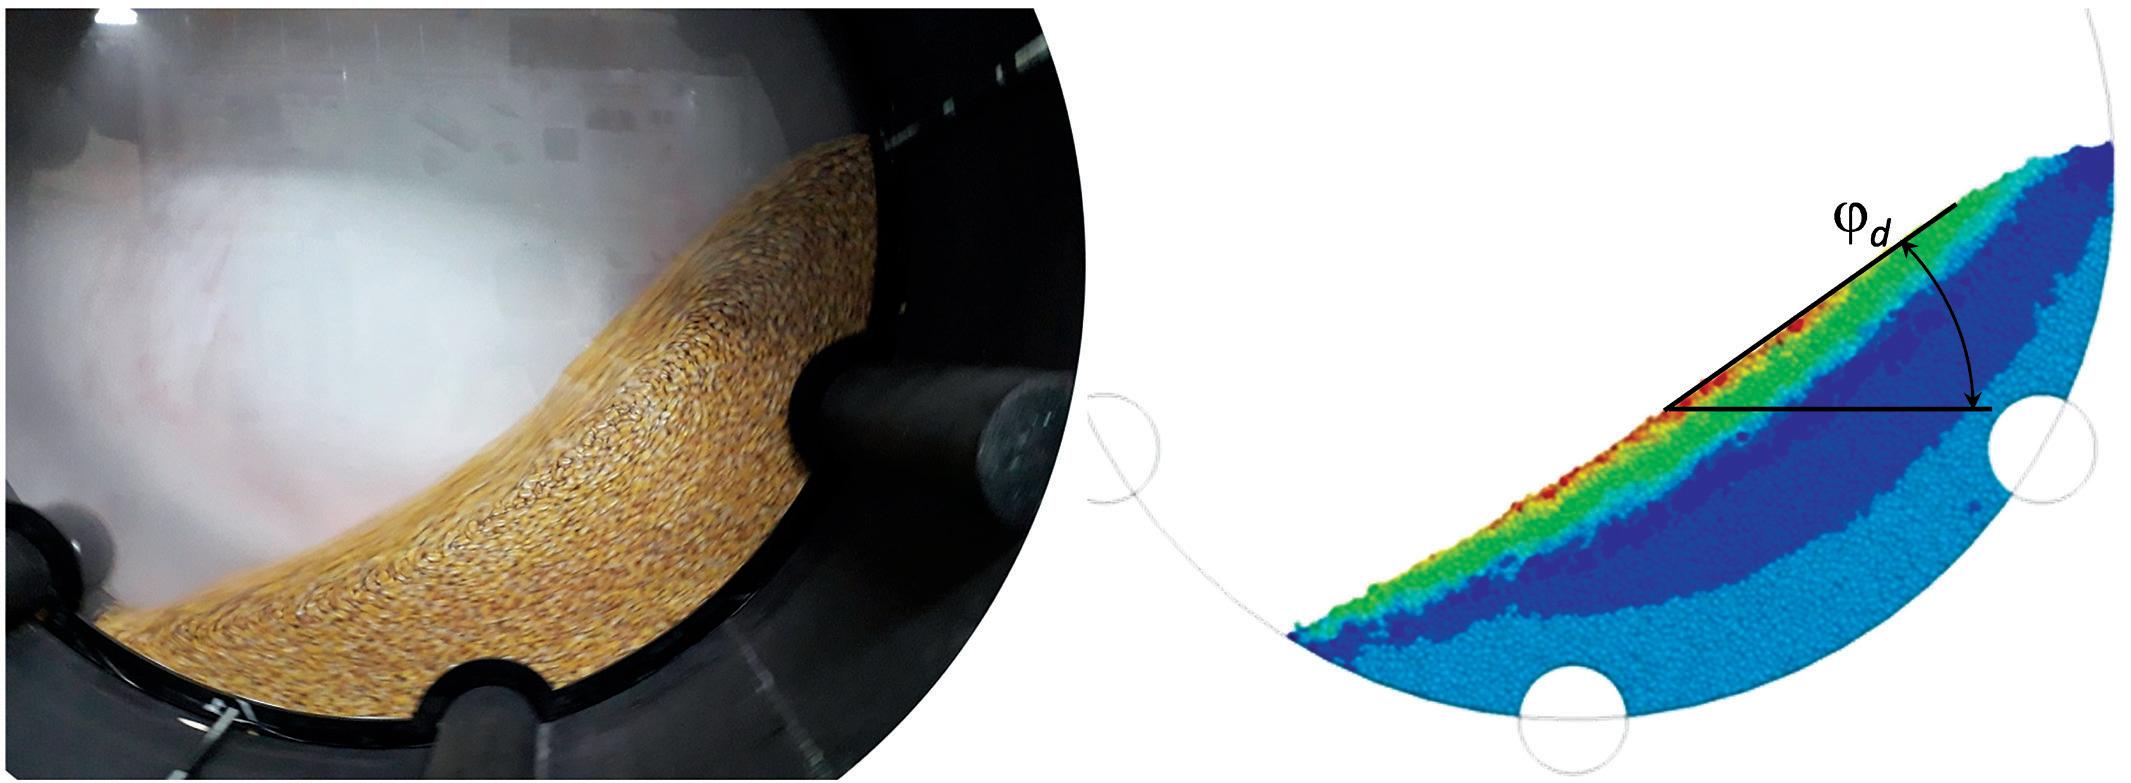
repose while a rotating drum can be used to measure the dynamic angle of repose, Figure 7. This test should be performed in the so-called rolling regime with the Froude number in the range 10-4 < Fr < 10-2 where Fr=w2 R/g with w the rotation speed, R the drum radius and g the gravitational acceleration. Furthermore, the ratio of the drum diameter to the particle diameter should be 25 or more for reliable results. Independent of the method used, the angle of repose is usually determined by taking pictures of the heap from various directions and image processing tools used to fit a straight line to a part of the slope, ignoring the most upper and lower extremities.
Direct shear tests
The direct shear test can be performed in a translational shear cell/box or an annular ring (rotating) shear cell, Figure 8. Geometrical constraints in the translational test limit the maximum shear strain which is unlimited in the rotating cell. In both cases, commercially available equipment is designed for geotechnical applications for particles not larger than approximately 15mm. Larger shear cells are available at research institutions for particles up to 50mm in size. Tests on cohesionless material can be performed by applying a normal load to the lid and translating/ rotating the bottom half of the box/cell to induce shear failure in the sample while measuring the shear stress. Repeating this procedure for at least three increasing normal loads, the Mohr-Coulomb failure envelope can be constructed from which the bulk friction and apparent cohesion can be derived. Direct shear tests are suitable for the calibration of materials which would be subjected to high pressures or levels of consolidation (> 100kPa) in the final application.
Draw down tests
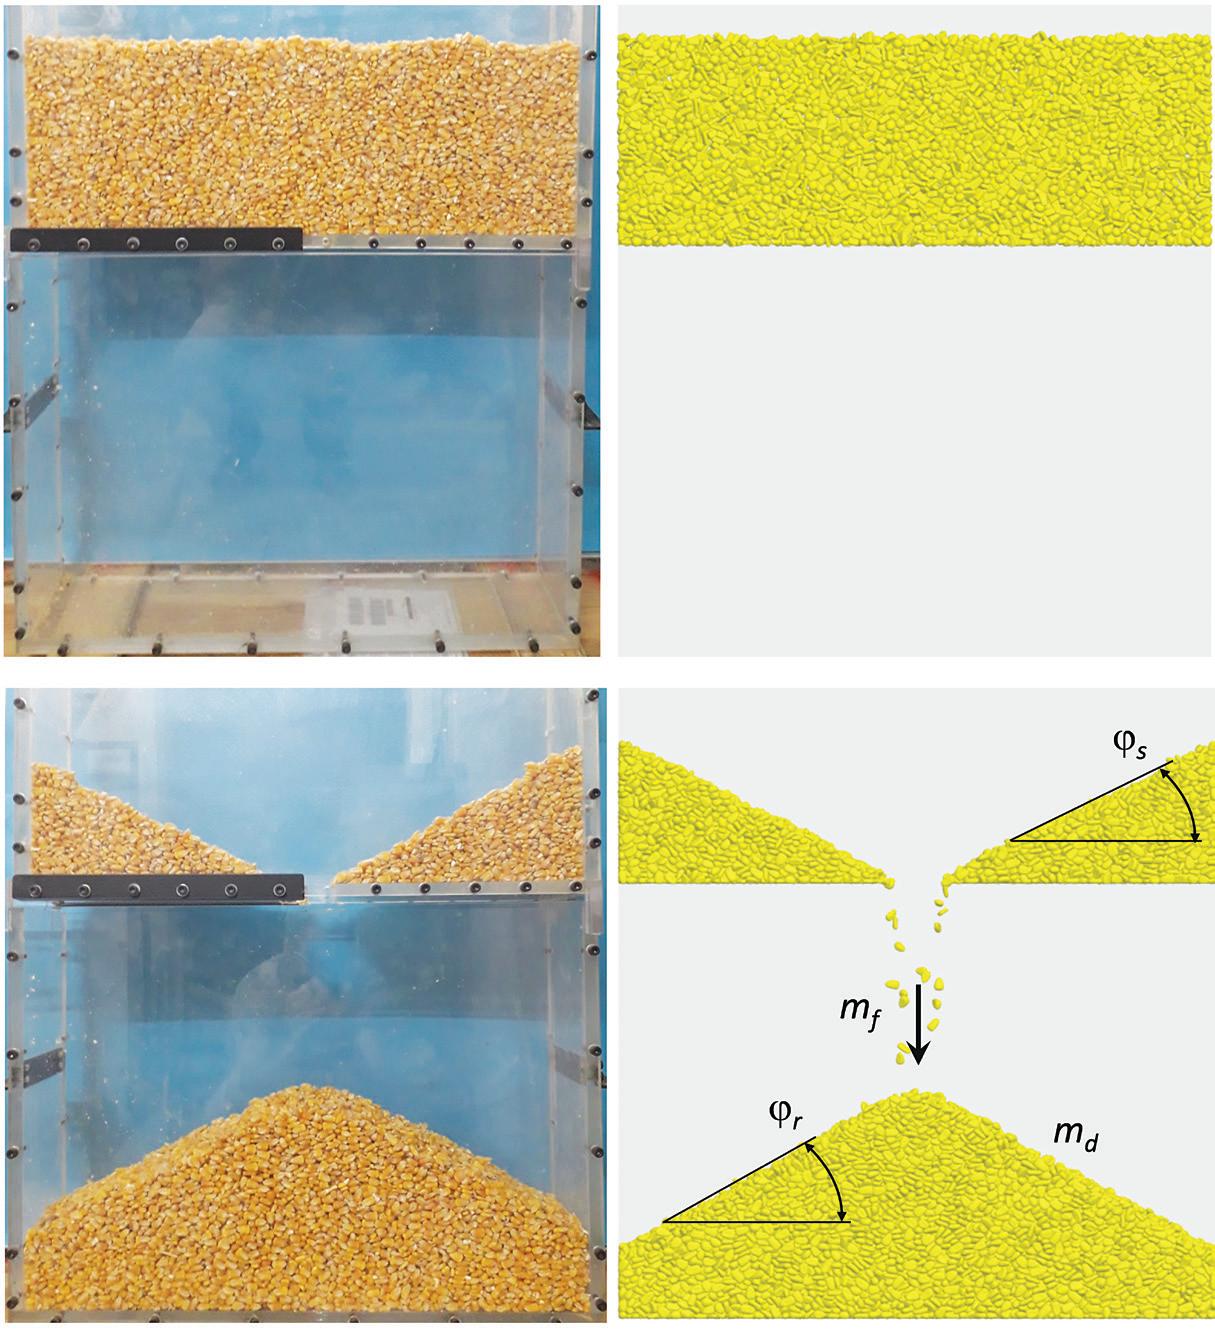
The draw down test (DDT) is a combination of a bin discharge test and an angle of repose test. The apparatus has an upper compartment which is filled with material and a trapdoor in
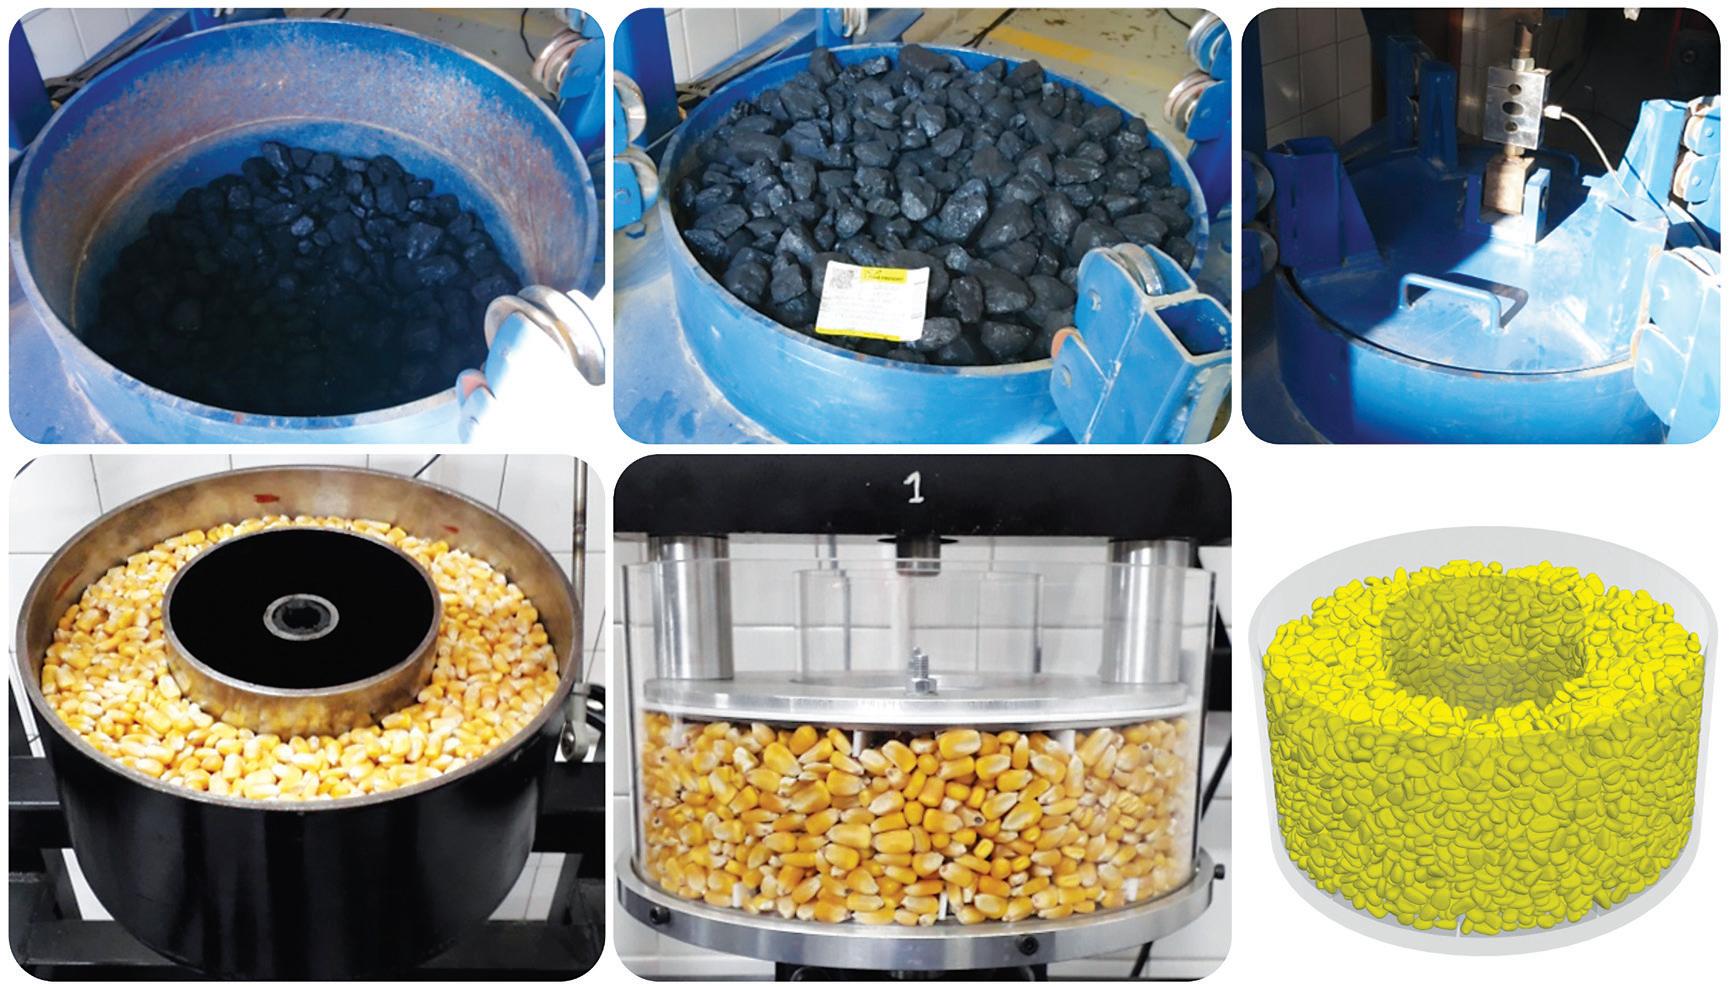
Figure 9 – Draw down testing of corn grains showing the experiment on the left and the DEM model on the right with the four bulk properties used for calibration the floor which is opened to allow the material to flow into the bottom compartment while the mass flow rate (kg/s) is measured, Figure 9. At the end of the test, the material in the upper compartment forms what is referred to as the shear angle and the material in the lower compartment forms an angle of repose. Depending on the material tested, these two angles can be significantly different. The two angles, the mass flow rate and the mass of the discharged material provide four bulk measures which can be used to calibrate the friction parameters. The draw down apparatus is easy to manufacture and should be large enough to eliminate any significant wall effects. The dimensions of the compartments and door opening should be at least 10 to 20 particle diameters.
A unique set of friction parameter values
Individually modelling the above tests, the bulk properties are sensitive to both the sliding and the rolling coefficients of friction. Furthermore, an infinite number of parameter combinations might provide the
Figure 8 – Top row: direct shear testing of coal in a large translational shear cell (diameter 590mm); Bottom row: an annular ring shear test with a steel and acrylic cell – all performed at Stellenbosch University
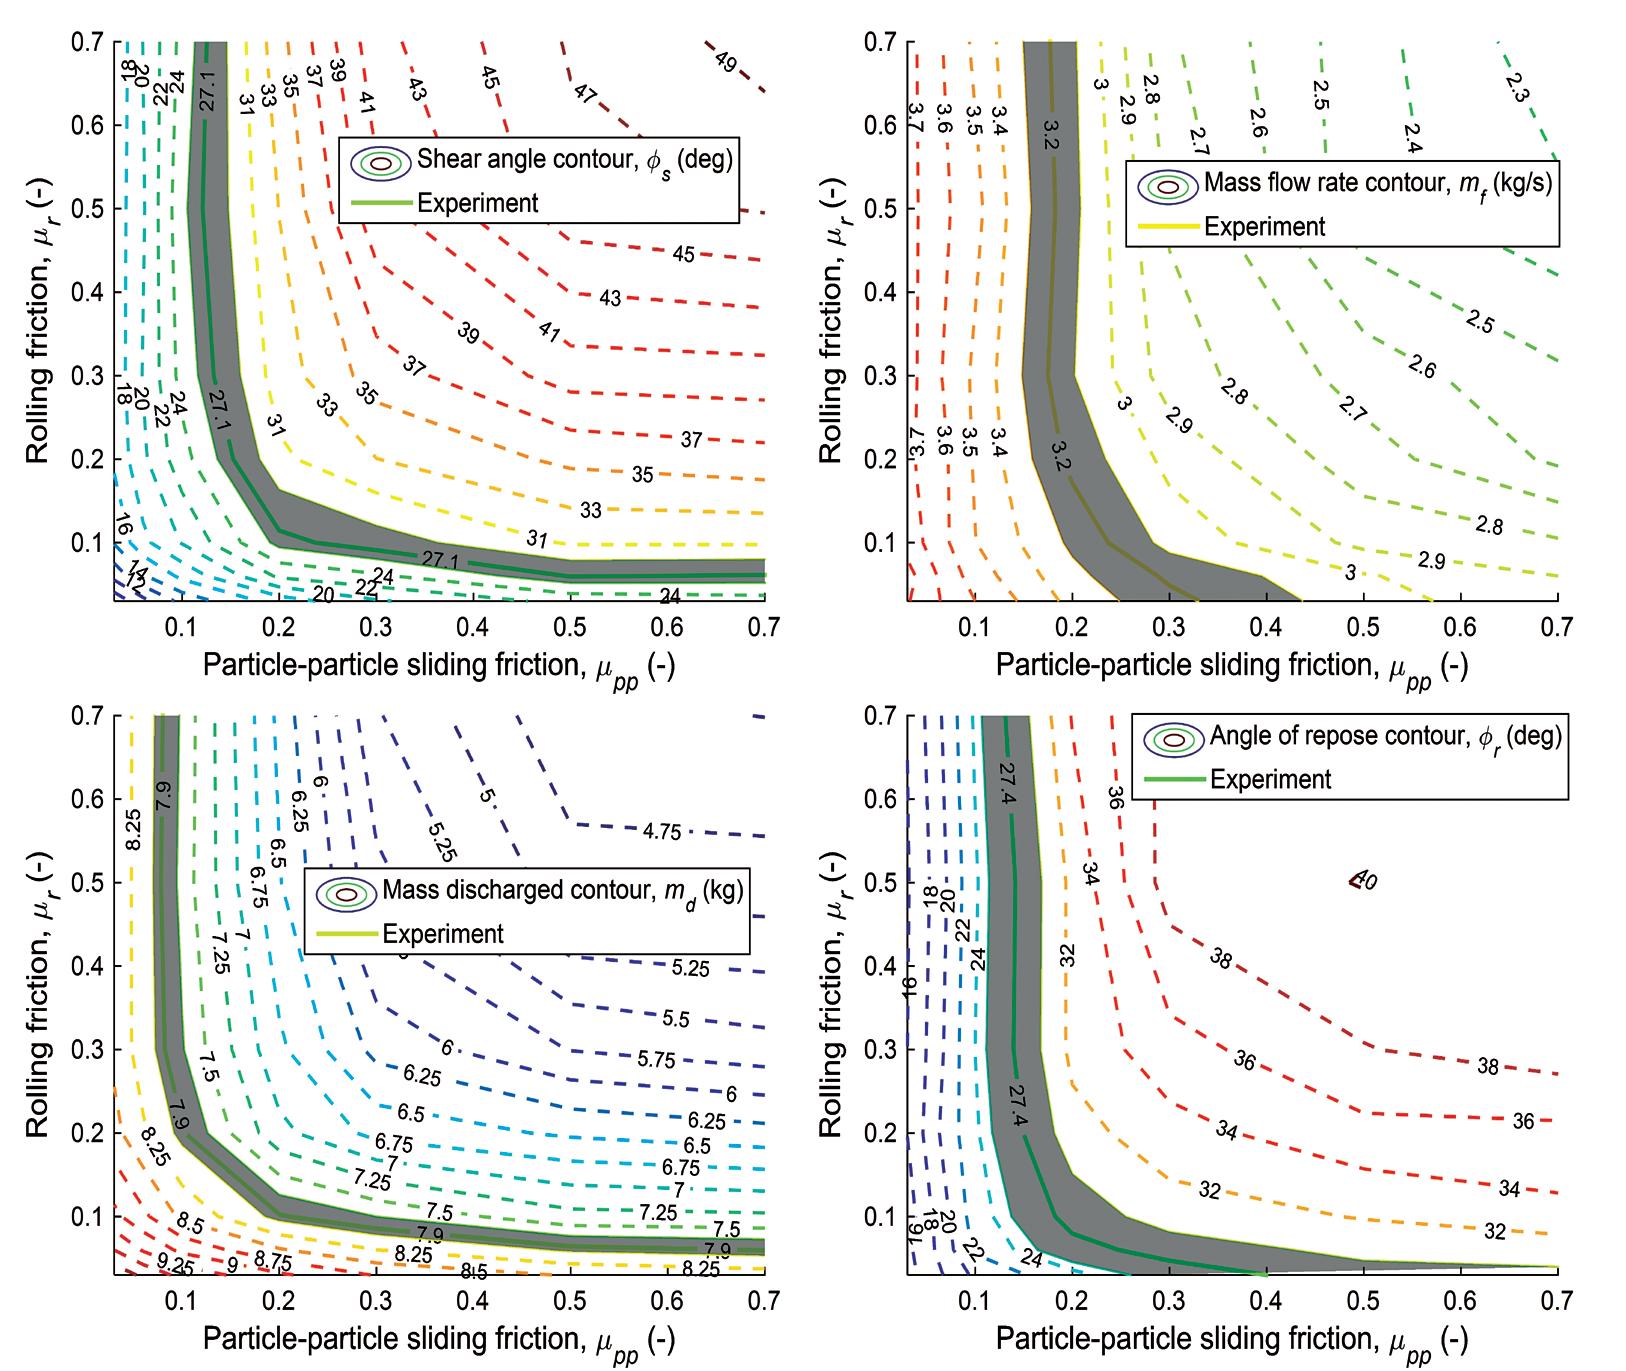
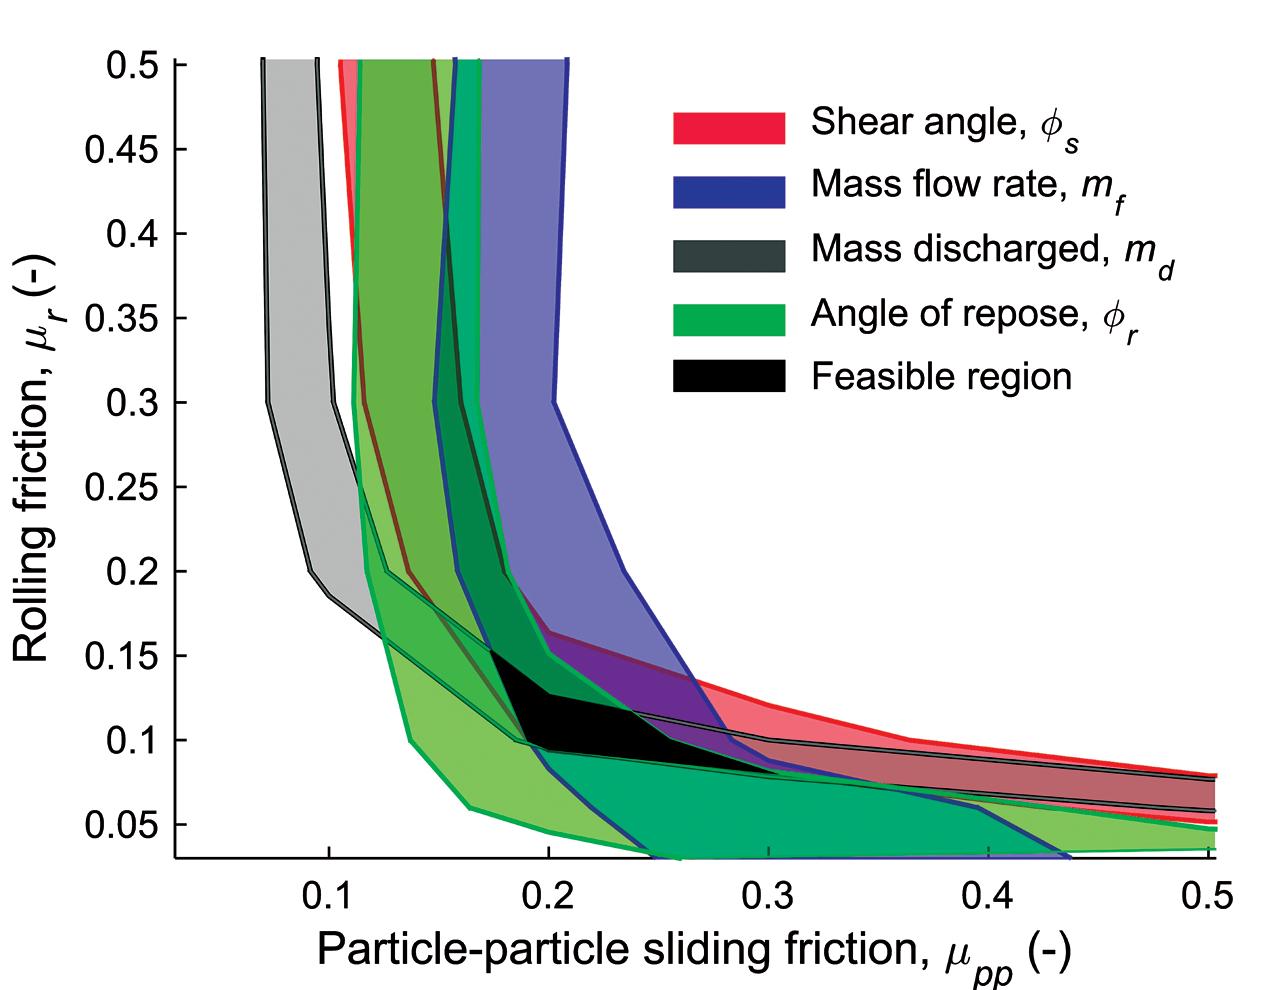
same bulk response, which raises the question: “Which parameter set is the correct one?” Finding a final set of parameter values relies on combining the different test results to identity a unique, or close to unique, parameter set which provides accurate results for all measures. Calibrating two parameter values in this way requires at least two independent bulk measures, but using more measures will help to refine the results. The draw down test provides four bulk measures in one single test: the shear angle, the angle of repose, the mass flow rate and the discharged mass. Varying the sliding and rolling coefficients of friction from 0.1 to 0.7 in a sensitivity study, the response surface for each of the four bulk measures can be obtained as shown in Figure 10 as contour plots. In each case, the region between the isolines representing the experimentally measured values (mean ± std) is highlighted to indicate the feasible region for this measure. Thus, any combination Figure 11 – Overlaying the isolines from each of the four bulk measures of the two parameters falling within this region in the draw down test to find the final set of parameter values would result in that bulk measure being accurately modelled. Isolating the feasible regions from each measure and direct shear test can also be used, or any combination and overlaying them on a single graph, a final parameter set of these. This approach provides transparency and the user can be selected with the sliding friction between 0.20 and can identify how sensitive the model is to each parameter. 0.30 and the rolling friction between 0.10 and 0.15 as shown However, completing a full sensitivity study to obtain the in Figure 11. Parameter combinations within this range will response surface for each combination of parameter values simultaneously satisfy all four measures. can be time consuming. Although the DDT alone provides enough information to Optimisation and design of experiment techniques can be used calibrate the two friction parameters, the angle of repose to get to an optimal parameter set more efficiently. Also note that the particle-wall rolling friction is usually taken equal to that of the particle-particle contacts which eliminates one parameter from the calibration process.
Conclusion
DEM can be used as a design tool only if accurate results can be obtained within a reasonable time frame. The accuracy of any DEM model depends on the input parameter values which should be carefully calibrated, while speed-up can be achieved by scaling the particles size and reducing the contact stiffness in the model. This article presents a tried and tested calibration procedure for cohesionless (dry) granular materials which will result in a set of parameter values suitable for modelling most bulk materials handling systems and equipment. Stellenbosch University Corné Coetzee Tel: (021) 808-9111 Email: info@sun.ac.za www.sun.ac.za
Figure 10 – Draw down model results showing the contour plots for each of the four bulk measures, from the top left: shear angle, mass flow rate, mass discharged and the angle of repose
“THE LINK FOR AFRICAN TRADING”

TRANSNET FREIGHT RAIL
www.transnetfreightrail-tfr.net


Longer Wear Life
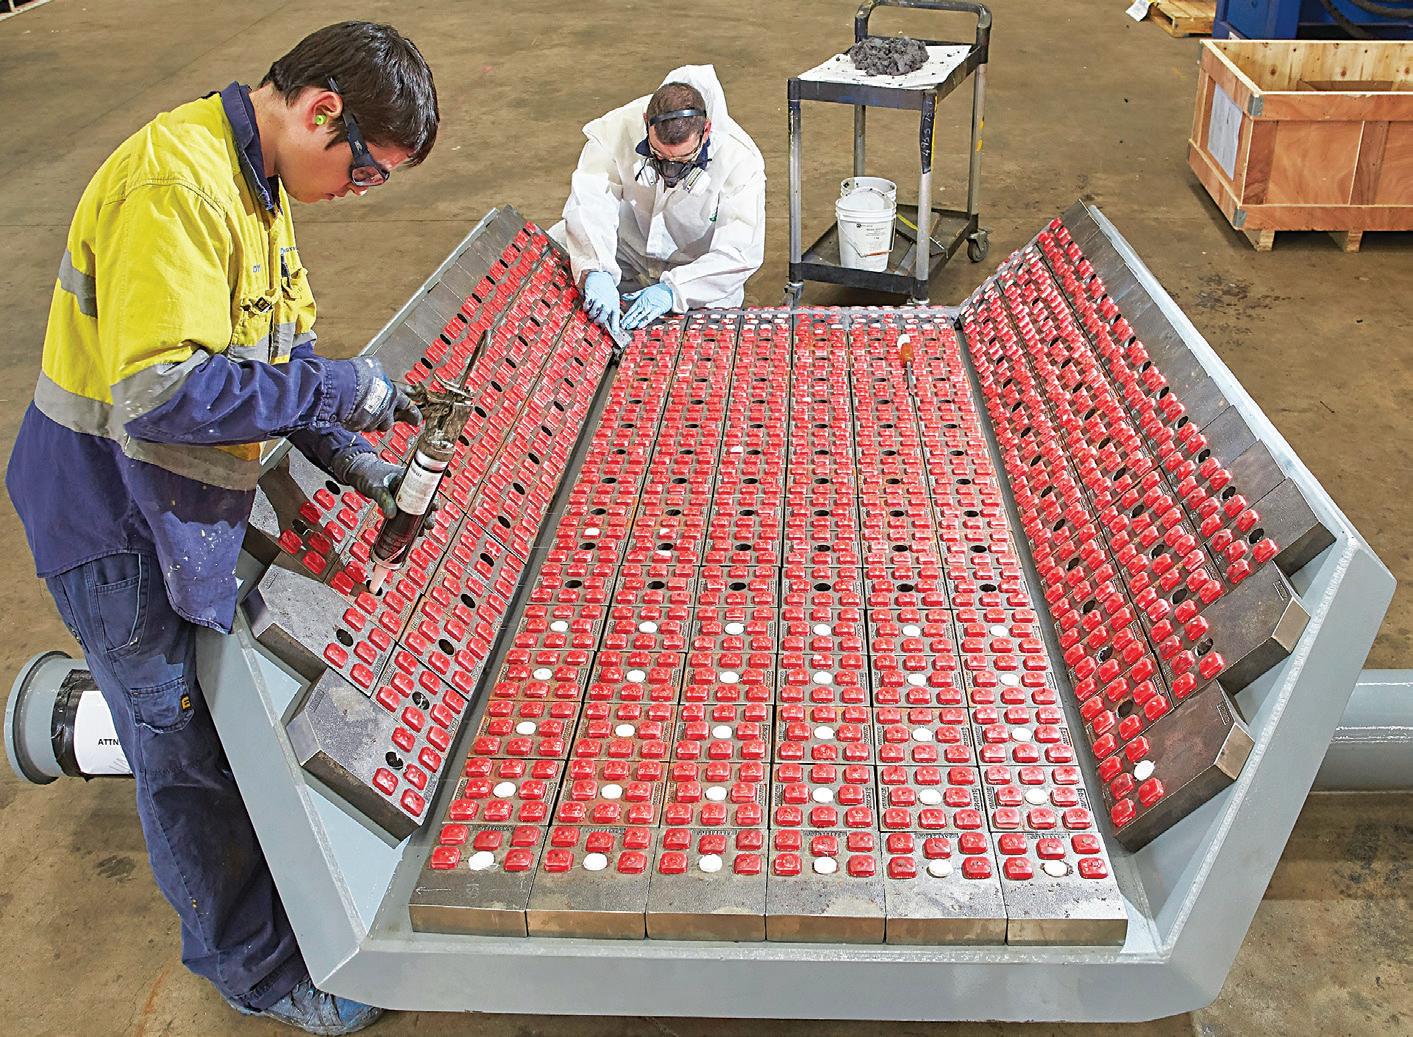
Trials of FLSmidth’s FerroCer modular impact wear panels will soon begin in Africa, following successful trials in countries such as Australia, Peru and India, where significant increases in wear life were recorded. Tests will be conducted on sites in Zambia and Mozambique. According to Zwerus Voges, Ceramic & Wear Solutions Specialist at FLSmidth, the FerroCer panels offer a cost effective solution, provide much better wear life than conventional panels and also deliver safety benefits to mine operators. “The design of the panel takes advantage of the wear characteristics of multiple materials, and its matrix combines the strength and malleability of steel with the abrasion resistance of ceramics,” says Zwerus. Each panel weighs only 5kg and can easily be handled by one person, meeting all the safety regulations for size and FerroCer panels being fitted to a conveyor weight. The compact shape also makes the panels safe and easy to install using standard hand tools. chutes, hoppers, bins, feed boxes and vibrating screen boxes Zwerus says the panels have delivered longer wear life in as well as reclaimer and loader buckets. various applications which has meant an increased uptime They have also excelled in nickel, gold, copper and zinc apfor customer operations. plications,” he concludes. FerroCer impact wear panels are particularly suited to high FLSmidth, Tel: (010) 210 4000 impact wear locations in a process plant, which include www.flsmidth.com
Enviro-legality
Environmental law in South Africa is a minefield as there are more than 108 different pieces of legislation that members must consult for environmental management guidance. The relevant legislation can be scattered in laws enacted by all three spheres of government: national, provincial and local. With ASPASA’s Environmental Legal Register, all the information that a business needs is at its fingertips in a single document. It has enough specialist input for members to identify the law applicable to its situation and sets out the exact legal requirement for that situation. This is a requirement, as the legislation is often phrased in a broad manner to be of use in a whole range of possible scenarios. The register has also been designed to meet the minimum requirements for such a document as set out by ISO 14001:2015. Members can trust the document to lead them towards sound prioritisation and compliance actions. However, the register is only applicable to open-cast mines. “Other industries will first have to join ASPASA so as to allow for further work to be done covering their needs,” concludes ASPASA director, Nico Pienaar. Aspasa Nico Pienaar Tel: (011) 791 3327 Email: nico@aspasa.co.za www.aspasa.co.za
LMI ACADEMY cc.
Merseta Accreditation No: 17-QA/ACC/0637/11
Reg. No. 2001/075895/23
P.O. Box 5907,Weltevredenpark 1715 E-MAIL: info@lmi-academy.co.za website: www.lmi-academy.co.za
Training offered at the LMI Academy or on site. • Lifting Machinery
Inspector
Qualification (LMI). • Registered CPD
Training. • The Rigging trade. • DMR 18 training. • Tackle training.
For further details contact: +27(011) 475 5876
Member of: LEEASA No. 810051
3D Scanning Technology
Local manufacturer of custom transfer points and chute systems, Weba Chute Systems & Solutions, has leveraged the latest technology to ensure high quality results for its global customer base. Managing director Mark Baller, explains that using threedimensional (3D) scanning technology during on-site assessments has enhanced the levels of accuracy which has minimised rework costs in design and manufacturing, and significantly reduced downtime during installation. “Implementing 3D scanning technology to our capabilities two years ago enabled our on-site technical teams to obtain accurate measurements from a safe distance, and allows us to inspect and survey large infrastructures in detail,” says Mark. “The technology allows us to consider all elements in on existing infrastructure and this plays an important role when replacing transfer points or chutes as we are able to create an accurate preliminary design and costing in the early feasibility stages of a project.” “Many companies offer 3D scanning, but do not have the in-house ability that Weba Chute Systems does to process and effectively use the data in a mining engineering environment,” Mark adds. “Leveraging this technology allows our engineers to get to the highest probability factor, so the project can be seamlessly executed and time overruns are not incurred during the constrained shutdown periods which are normal on these projects,” he concludes. Weba Chute Systems, Mark Baller Tel: (011) 827 9372, www.webachutes.com
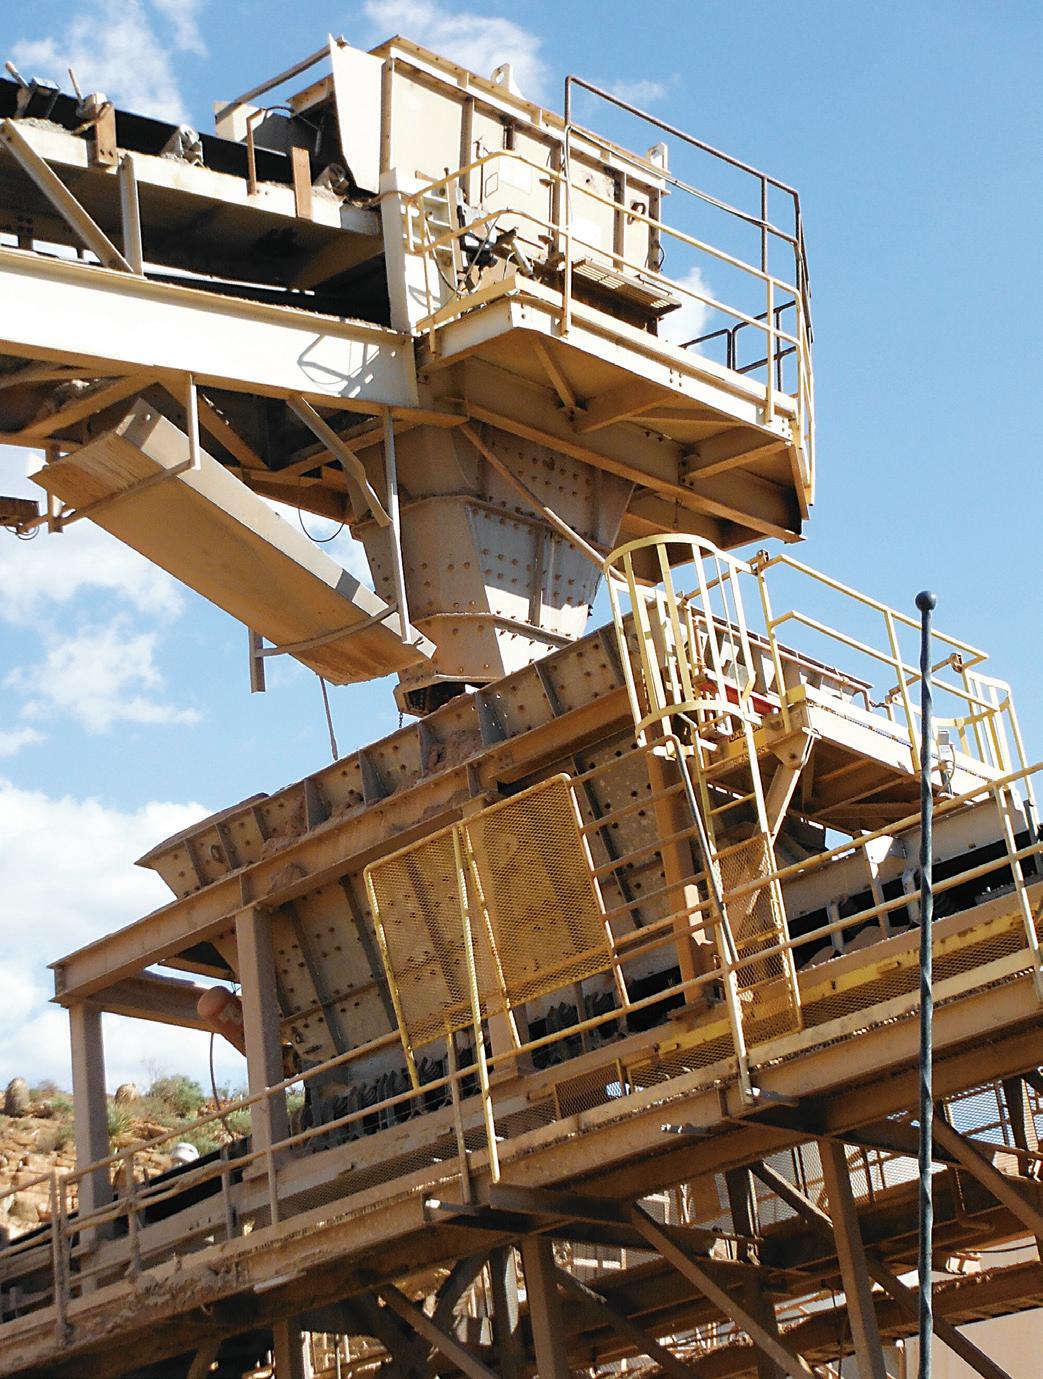
Weba Chute Systems leverages technology to ensure quality results for customer
Understanding Design Choices
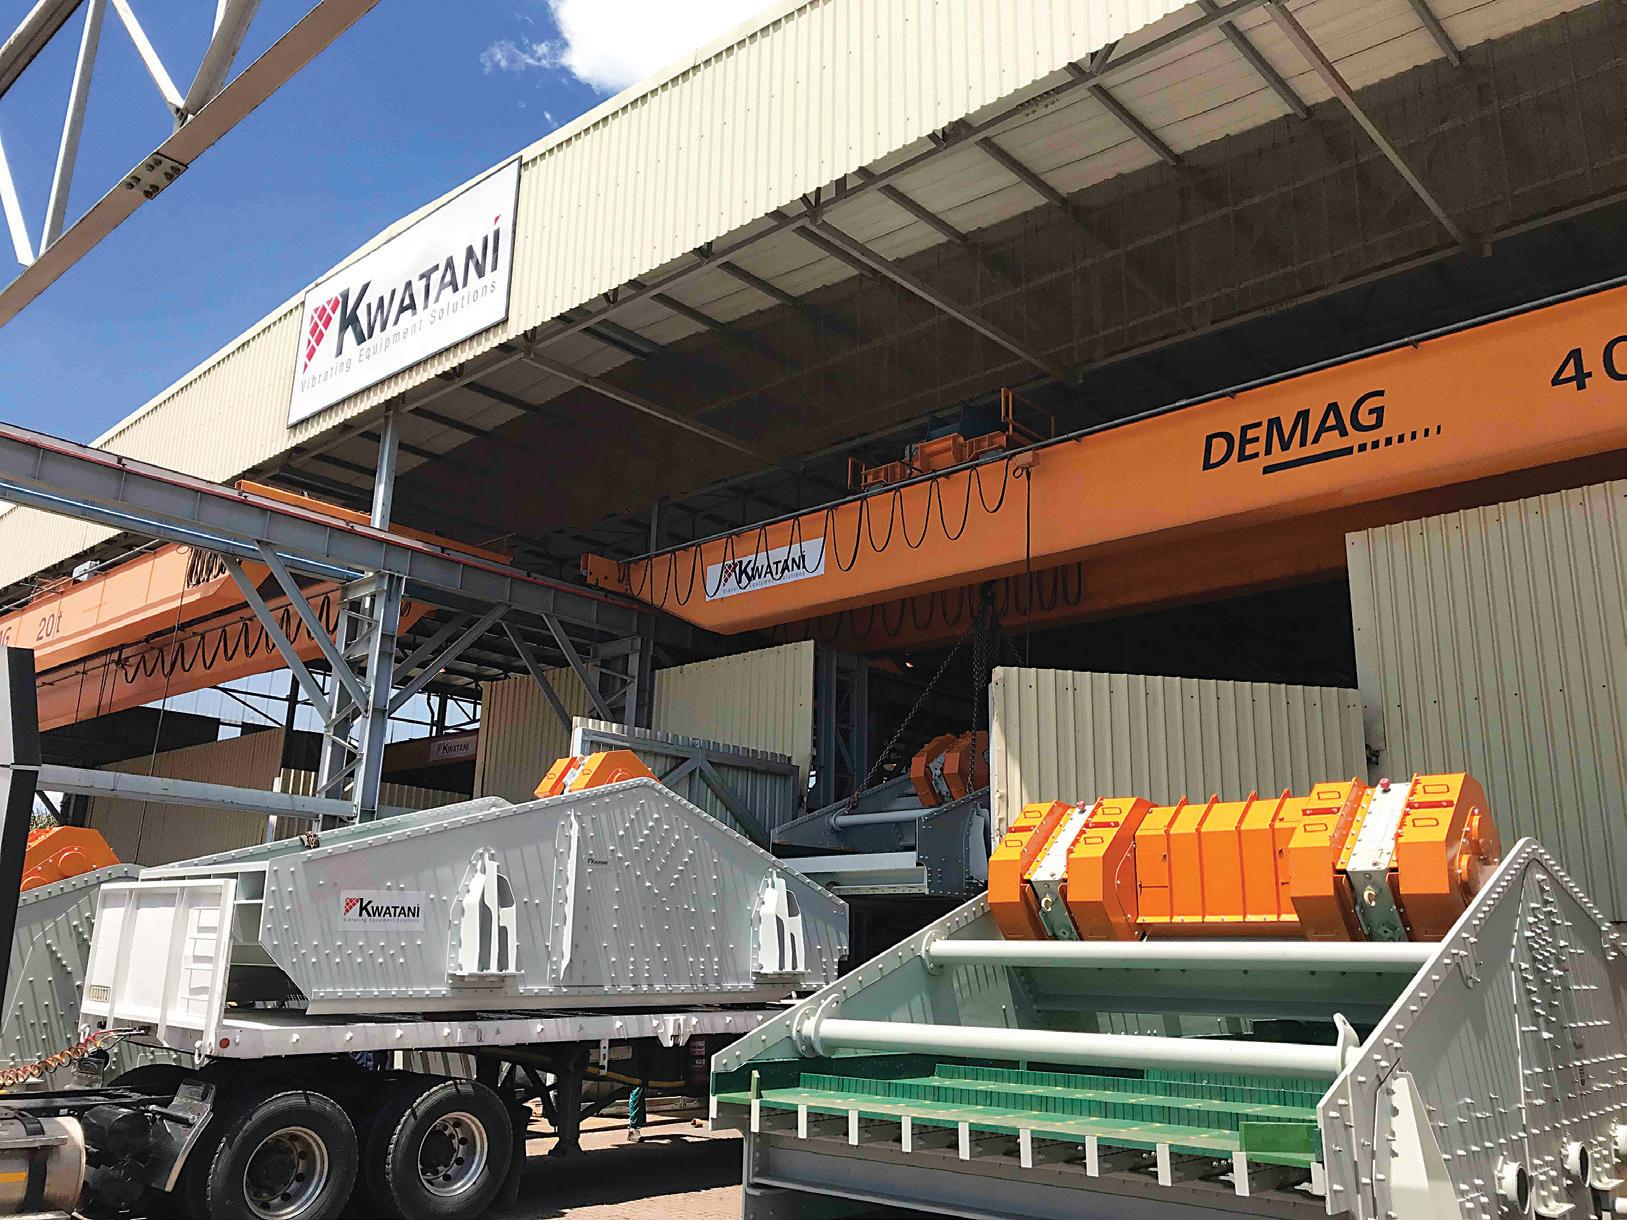
Don’t generalise about the advantages and disadvantages of different vibrating screen technologies, advises Kwatani CEO, Kim Schoepflin, the key consideration is the application. “When a customer considers their options for a screening machine, there are a number of good technologies from which to choose,” says Kim. “The appropriate technology choice will depend on the application, and we believe there is a space for every technology.” Brute force screening is the most common technology employed among mining screens. Its benefits include being generally cost effective, relatively simple to maintain and economic in terms of life cycle costs, all of which translate into lower Total Kwatani screens for a coal application being loaded for transportation to the end user cost of ownership. “Having the mechanical and metallurgical knowledge in- customer needs, and providing a solution that is engineered house, Kwatani can provide the technology that best suits for tonnage. the application,” she says. We are not tied to one technology, Kwatani, Tel: (011) 923-9000 and our primary focus is on understanding exactly what the www.kwatani.co.za
Crane Driver Elevator
Liebherr Maritime’s new LiUP crane driver elevator for mobile harbour cranes has an innovative drive technology and is powered by an electric motor with lithium-ion battery and energy recovery function. The in house elevator is designed to transport the operator in a safe and efficient way to his/ her workplace. The LiUP saves drivers energy and time compared with climbing up several stairs. Service engineers also save themselves the trouble of climbing up stairs to the crane cab to carry out maintenance work. The lift is capable of transporting up to two people or a payload of 200kg. The LiUP has several functions to protect the safety of crane operators and service technicians. The stopping positions are monitored by three limit switches, while a clamp brake reacts when the elevator starts moving too fast. Inductive sensors permanently check whether a guide rail is installed. Liebherr Philipp Helberg Tel: + 49 381 6006 5024 Email: Philipp.Helberg@liebherr.com www.liebherr.com
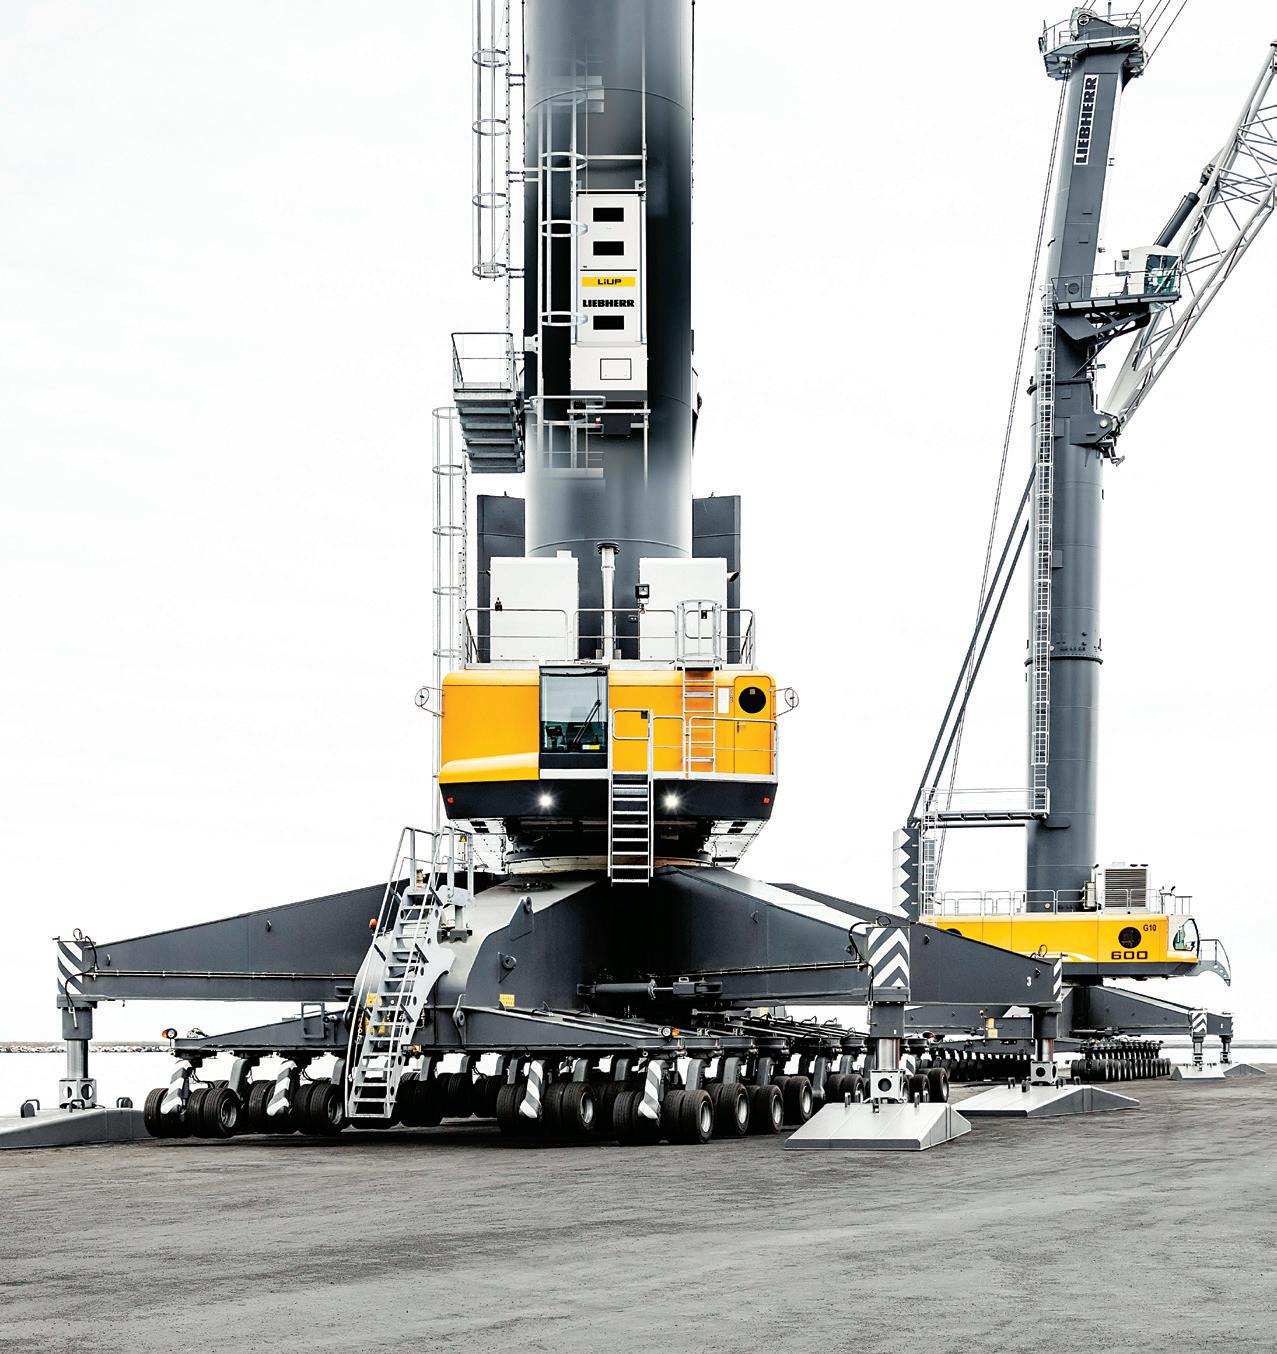
The LiUP is powered by an electric motor with lithium-ion battery

Digitalisation Strategy
Since early 2019 an artificial intelligence solution (AI), supported by Microsoft’s cloud platform Azure, has been integrated into the processes of the largest materials distribution and service provider in the Western world. "alfred" supports his colleagues at Materials Services in dynamically managing the global logistics network with 271 warehouse sites and more than 150 000 products and services. As with his namesake, Alfred Krupp, all information comes together at alfred. As a first step, alfred will help to optimise transport routes and thus save on the transport cost of thousands of tons of material per year. In addition, materials will be available more quickly at the right locations in the future. In the medium term, materials services will be able to make all processes along the supply chain more flexible, for example, in order to better take into account specific customer requirements for delivery speed, pricing or material quality. Klaus Keysberg, CEO of thyssenkrupp Materials Services, summarises alfred’s strengths: "Artificial intelligence is one of the technologies that will make a decisive contribution to competitiveness in materials distribution in the future. With alfred we are taking an important step towards making our processes even more efficient and optimising our value chain. At the same time, he gives us better insight into our customers' needs so that we can align our offerings accordingly. In the medium term, this holistic approach will also open up new business opportunities for us." "From procurement through warehousing and logistics to sales, we rely on integrated digitalisation concepts. While we simplify cooperation with our suppliers in the area of procurement by means of a cloud-supported platform, for example, we create possibilities for networking internal machinery with our self-developed IIoT platform toii. toii allows us to flexibly coordinate and optimise the processes of warehousing and logistics. In sales, we offer our customers access to 150 000 products and services at 271 warehouse sites sites in the world's largest virtual materials warehouse," Klaus says. As a link between all these areas, alfred fits into the ecosystem and ensures continuous optimisation of speed and service quality through intelligent data processing with corresponding recommendations.

thyssenkrupp Materials Services www.thyssenkrupp-materials-services.com
Putting a Shine on Cullinan
Osborn, a mining and quarrying equipment specialist has secured an order from Petra Diamonds for an apron feeder that will be employed at the diamond mining group’s Cullinan diamond mine in Gauteng. Eight Osborn apron feeders of the same size were installed underground at the Cullinan Mine as part of a previous order. These are successfully servicing the operation’s underground silos and crushing stations. A further five Osborn apron feeders have since been supplied to the operation’s process plant. “With their heavy-duty construction, Osborn apron feeders are designed to handle feed sizes of up to 1 500mm where no fines removal is required or where fines are removed by a separate dribble conveyor,” says Osborn East Africa area manager, Chris Slade. He explains that the Osborn apron feeder can be installed in a horizontal or inclined position (up to 15°), depending on space limitations and provides a reliable means of controlling the feed rate to prevent surge loads to primary crushers, belt conveyors and other plant and equipment. Petra Diamonds’ Cullinan Mine also employs Osborn screens and crushers. Seven new screens were ordered from Osborn when the mine set up a new tailings reclamation plant. “These heavy duty crushers are currently operating underground at Cullinan, while two jaw crushers have been supplied to Cullinan’s process plant,” concludes Chris. Osborn Engineered Products Chris Slade, Tel: (011) 820-7600, www.osborn.co.za
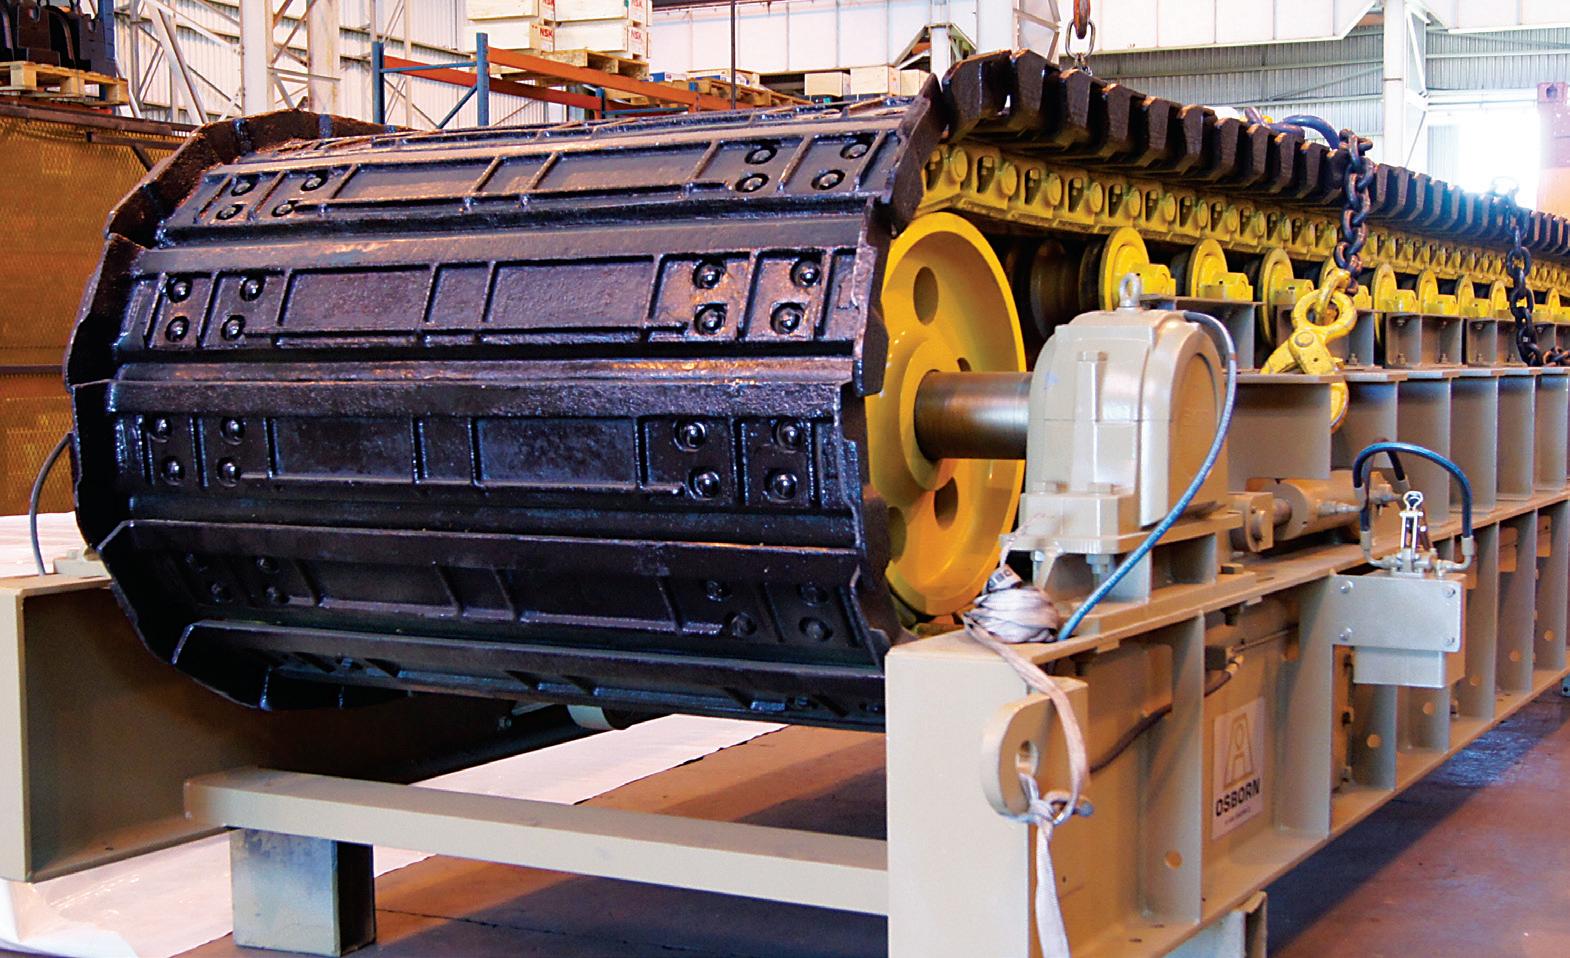
Stablilising South Africa’s Power Supply
South Africa could go a long way to cut the risk of future load-shedding by adopting a minimum efficiency performance standard (MEPS) for electric motors. According to Fanie Steyn, manager for rotating machines at Zest WEG Group, a MEPS would significantly reduce the peak power demand on the national grid. Importantly, the step could be made at no cost to government and would also bring substantial savings to the industry’s electrical energy costs. “The MEPS would phase out the least-efficient electric motor classes by setting a minimum standard for the efficiency of motors imported and sold in South Africa,” he says. “The essential challenge now is that about 280 000 electric motors are imported each year, many of which are low efficiency motors rated at IE1 level as standard.” Fanie highlights the great strides recently achieved in the efficiency of electric motors. Energy savings of between 2,1% and 12,4%, depending on the individual power rating can be made by converting from a standard efficiency IE1 motor to a premium efficiency IE3 motor. The capital cost differential is slight and is quickly recouped by lower operating costs. “It is estimated that as much as 30% of all energy produced globally is consumed by electric motors,” he says. “It is therefore easy to see why improving motor efficiencies has a huge impact on national energy consumption.” It is significant that more than 42 countries already have MEPS in place. These standards apply mostly to three-phase low voltage motors from 0,75kW to 375kW capacity. The MEPS is applied at import stage, so the process would be handled in the conventional manner by customs agencies. Zest WEG Group Tel: (011) 723-6000 Email: info@zestweg.com www.zestweg.com www.zestweg.com
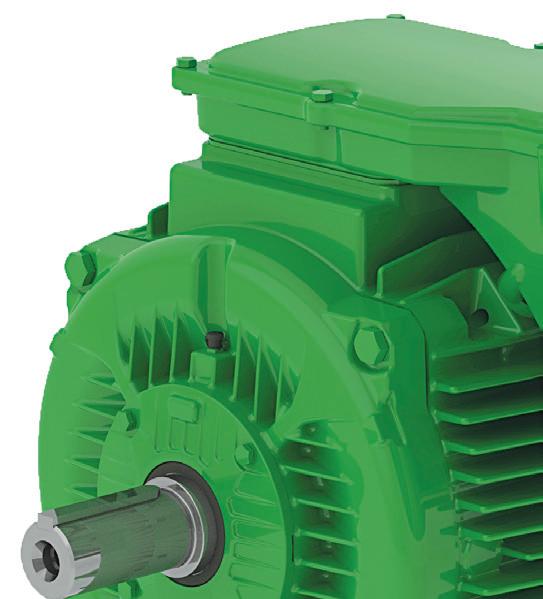
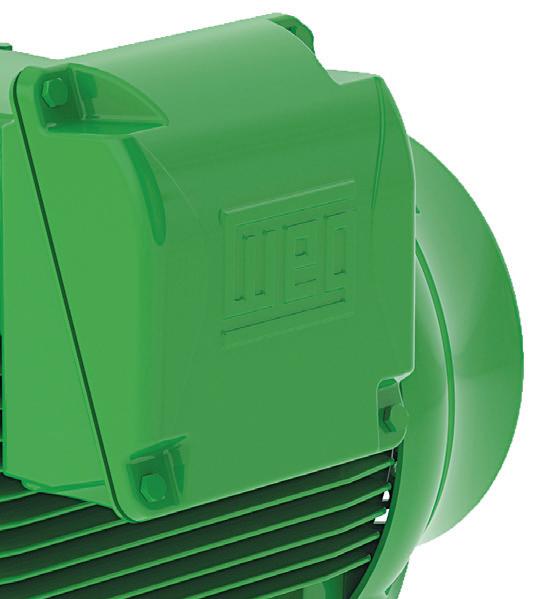

Implementing MEPS will have significant benefits for South Africa
ABSOLUTE MATERIAL FLOW CONTROL
CHUTE SYSTEMS & SOLUTIONS
• Optimum material flow • Up to 80% decrease in material degradation • Reduced dust and noise levels • Virtually maintenance free • Greatly reduced spillage • Significant reduction in belt damage
Tel: +27 (0) 11 827-9372 email: info@webachutes.com
www.webachutes.com

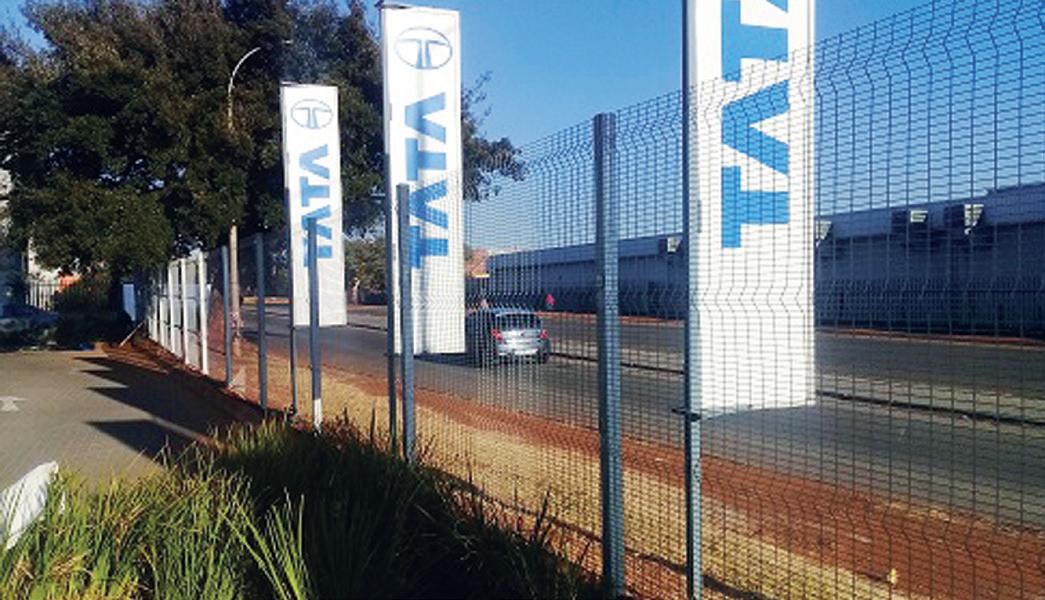
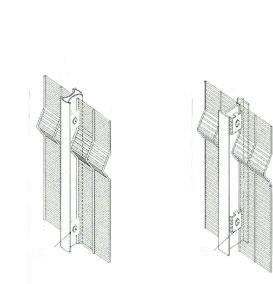
High security welded mesh Pallisade Gates Gate Automation Razor wire and more .... What is High Security Weld Mesh
HIGH Security Weld Mesh is wire fused and welded at a Horizontal distance of 76.2mm and a vertical distance of 12.7mm also known as 35B/3510 where 3 denotes 3”(distance between vertical wires), 5 denotes 0.5” (distance between horizontal wires), and B or 10 denotes gauge of wire

Salient Features
• Difficult to Climb: The spaces between the Horizontal wires are too narrow for fingers to have grip • Impregnable: Extremely difficult to cut with a hand cutter as the beak of a wire cutter will not be able to penetrate the horizontal wires
• Excellent Replacement option to Solid Wall as:
1. More economical than a solid wall 2. Faster to install than a solid wall 3. CCTV Camera has a clear view
• Further upgrade possible with electric security system • Anti-corrosive & low maintenance
Standards
• Manufactured according to BS EN 10016-2 • Wire Sizes in accordance with BS EN 10218-2 • Tolerance on Mesh Size in accordance wiht EN 10223-7 • Tolerance on Panel Size in accordance with EN 10223-4 • Welding Strength in accordance with BS EN 1461 • Zinc Coating in accordance with EN 10245-1 • Anti Corrosion in accordance with BS En 3900 E4/F4
Tensile Strength
• Wire has a tensile strenght of min 550 MPA

MARK: 083 454 6488 Email: mark@palifence.co.za
