2 minute read
Estimating Total U.S. Damages
A statistical model that incorporates DIRT data, One Call Systems International (OCSI) transmission data, and digging activity indicators is applied to generate the estimate of total U.S. damages. Estimated damages were up 4.5% year-over-year in 2019. While construction spending was flat, data shows more transmissions per construction dollar spent in 2019. This suggests that the trend of rising damages correlates with the rise in transmissions, and that the damage prevention system is becoming stressed.
Estimating the annual total of damages to buried utilities is a primary objective of the DIRT Report, because it helps the damage prevention industry understand the full scope of our challenges and successes. To generate the estimate of total U.S. damages, CGA’s Data Reporting and Evaluation Committee engages a consultant (Green Analytics) to develop a statistical model predicting total U.S. damage events based on DIRT data and a number of other variables which are statistically assessed for correlation with the number of reported damages by state. Appendix D explains in detail the process followed by Green Analytics.
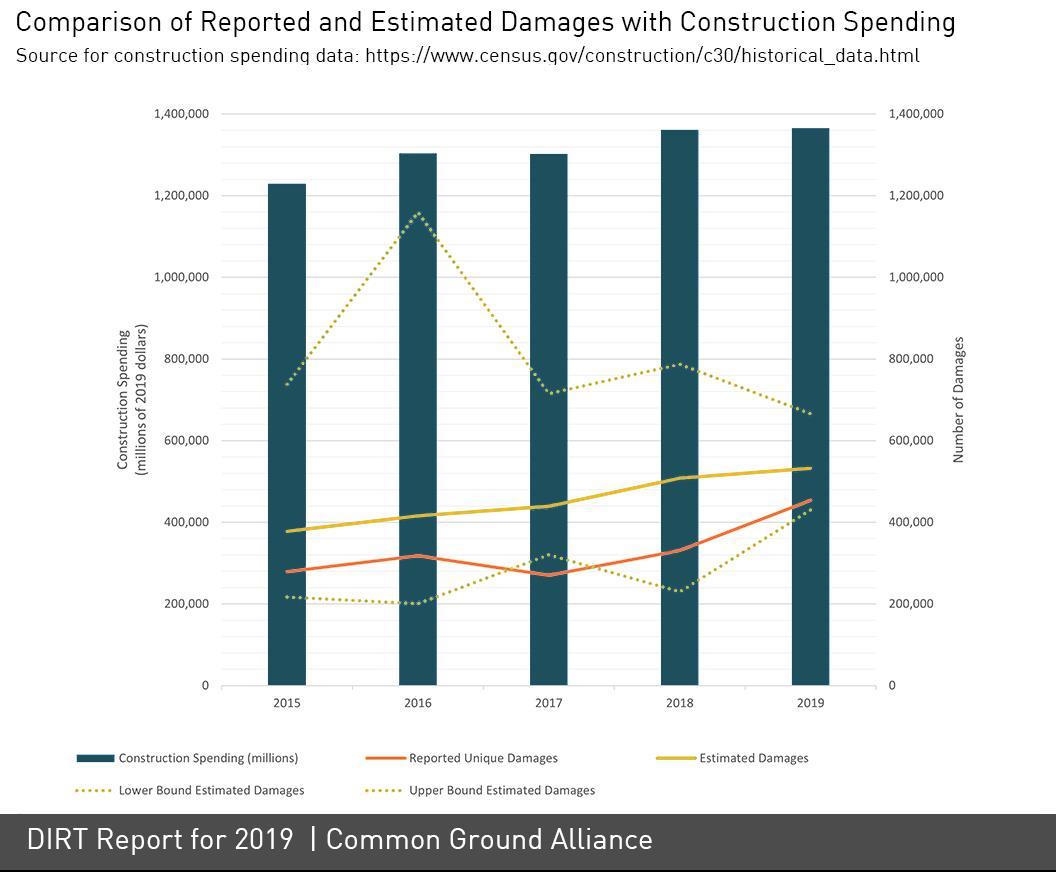
Table 3 presents key performance indicators generated using the prediction models. Indicators are presented for total estimated damages and one call transmissions for the U.S. over time. Figure 4 shows this information graphically.
Table 3—Key performance indicators for total estimated damages in the U.S., over time
Total Estimated Damages
Lower Bound Confidence Interval for Total Estimated Damages
Upper Bound Confidence Interval for Total Estimated Damages
Total Estimated Transmissions
Total Estimated Damages per 1,000 Transmissions
Total Estimated Damages per million dollars of construction spending (2019 $) 2016
416,000
201,000
1,159,000
221.9 M
1.88
0.319 2017
439,000
270,000
715,000
234.9 M
1.87
0.337 2018
509,000
230,000
787,000
244.3 M
2.08
0.373 2019
532,000
430,000
666,000
267.6 M
1.99
0.390
Figure 4 (Source for construction spending data: https://www.census.gov/construction/c30/historical_data.html)
While we expect variation in the number of estimated damages from year to year, the real value of this metric is in observing its overall trend, which has been moving upward since 2015. The large jump in estimated damages from 2017 to 2018 may reflect, in part, the faster rate of growth in the country’s economy during that time (the rate of economic growth in 2018 was 2.9%2 relative to 2.2% in 2017).
In 2019, the trend appears to be returning to its pre-2018 year-over-year rate of increase: Estimated damages were up 4.5% in 2019 compared to 2018, while transmissions were up 9.5%. Interestingly, 2019 digging activity variables seem to be showing that each construction dollar spent resulted in more one call transmissions than ever before, suggesting that the rise in damages may correlate with an increase in overall pressure on the damage prevention process. A number of factors could be contributing to the rise
2 Source: https://data.worldbank.org/indicator/NY.GDP.MKTP.KD.ZG?locations=US


