40 minute read
WINE AUSTRALIA
Science and technology evolve to give growers more weapons against fungal diseases
By Dr Liz Waters, General Manager Research, Development and Adoption, Wine Australia
With a third consecutive La Niña event forecast to bring wetter and cooler conditions to south-eastern Australia over the coming months, it’s an opportune time for grapegrowers to review and assess their preparedness for outbreaks of fungal diseases.
Fungal diseases such as powdery mildew, botrytis bunch rot and downy mildew are estimated to cost the Australian grape and wine sector — which is dominated by European cultivars that have little or no resistance to these pathogens — more than $200 million a year through yield losses and reduction in berry quality. With a heavy reliance on fungicides for disease management in vineyards, fungicide resistance is increasingly becoming a management issue for grapegrowers across the country.
In a context where there is also increasing market and consumer pressure to use less chemicals and farm more sustainably, as well as increasing costs and supply chain issues associated with chemicals, this is a concerning development.
Research to counteract the growing problem of fungicide resistance has generally taken two different approaches: breeding of more disease-resistant vines, and enhanced testing and monitoring systems that can diagnose resistant outbreaks early and enable better informed spraying and management decisions to maximise the effectiveness of treatments. Wine Australia is a partner in the recently funded Cooperative Research Centre for Solving Antimicrobial Resistance in AgriBusiness, Food and Environments (CRC SAAFE), which is geared towards the latter, more holistic approach. Work on fungicide resistance in grapevines will continue in CRC SAAFE and benefit from collaboration with other sectors and multiple disciplines.
Recently, agtech innovations have added to the arsenal of weapons at growers’ disposal. With support from Wine Australia,
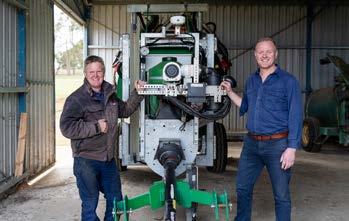
Ben Thomson (left), managing director of Best’s Wines, and Wine Australia program manager Dave Gerner, with the Smart Apply canopy sprayer technology, which accurately measures grapevine canopies and automatically adjusts spraying, reducing waste, chemical costs and environmental impacts.
Ben Thomson of Best’s Wines has been trialling and demonstrating the use of the Smart Apply canopy sprayer technology, developed by Smart Guided Systems, in the Grampians region. The sprayer uses LiDAR laser scanning to accurately measure grapevine canopies and automatically adjust spraying to reduce waste, chemical costs and environmental impacts.
Further afield, Saga Robotics, a Norwegian firm, is trialling an autonomous application of UV light treatment for powdery mildew, which has been shown to have success in eliminating mildew spores without chemicals. And in the US, AI combined with phenotyping is proving highly accurate in early identification of spores.
With Australian grapegrowers using more agroecological practices in their vineyards to find a beneficial balance between viticulture and the environment, disease-resistant vines offer a longer-term solution. Years of grapevine breeding by CSIRO and research partners overseas to identify disease-resistant genes that offer vines protection from specific pathogens and genetic technology advances have led to DNA marker-assisted breeding that is reducing the time needed for trials and outcomes.
Disease-resistant hybrid vines in NSW planted several years ago as part of the CSIRO program have performed well over the wet seasons of the past couple of years. Wine Australia will continue to support this foundational work, which will be increasingly important in the context of climate change and the environmental imperative to farm more sustainably.
While there will likely always be a need for some agrochemicals in the arms race against a wide range of pests and diseases that continue to evolve, science and technology are providing alternatives that, used in combination with common sense management and farming practices, can be highly effective in reducing the development of fungicide resistance.
Growers need to be vigilant and respond quickly to outbreaks as well as assess the value of varieties that are naturally more resistant to fungal infection and understand how to reduce the risk of fungicide resistance through the use of a mix of fungicides.
Beyond glutathione Protecting wine aroma and colour using a unique glutathione-rich inactivated yeast
By Florian Bahut1, Marion Bastien2, Jose-Maria Heras3, Eveline Bartowsky4 and Nathalie Sieczkowski2
Wine oxidation is a concern for every winemaker. Traditionally, sulfur dioxide is used to manage oxidation, but with increasing interest in reducing the use of SO2, natural alternatives are being sought. Glutathione, a tripeptide which is formed through the natural metabolism of yeast, is a potent antioxidant. Inactivated yeast rich in glutathione offer a non-chemical means to manage grape juice oxidation.
OXIDATION MECHANISMS THROUGHOUT WINEMAKING
Oxidation in oenology is a big word that covers many different dimensions, from the colour of a wine through to its aromatic composition to its longevity. It could be defined as “all the chemical or physical reactions happening in a must or in a wine in the presence of oxygen”. Managing oxygen is still challenging, so most of the solutions to reduce oxidation are dedicated to neutralising or minimising the first oxidation product, the quinones that are oxidised polyphenols.
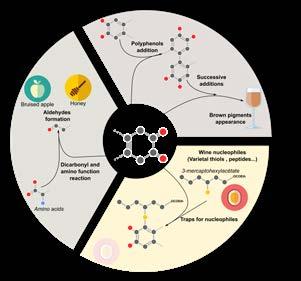
Indeed, quinones in wine are involved in many reactions leading to the accumulation of aldehydes (source of off-flavours), the first steps of wine browning and are involved in the trapping of varietal thiols (Figure 1).
Traditionally, sulfites (such as SO2) are used as the main antioxidant compound to reduce quinones back to polyphenols, but other compounds naturally present in wine are also able to trap quinones and thus minimise the oxidative damage. One of the most abundant and known of these compounds is glutathione.
GLUTATHIONE IN WINEMAKING
Glutathione is a tripeptide, which contains three constitutive amino acids: glutamate,
IN BRIEF
■With the growing trend towards reduced use of sulfur dioxide in winemaking, other methods of managing oxidation are being sought.
■In its reduced form, glutathione, a tripeptide, can scavenge quinones responsible for browning and aroma loss due to oxidation mechanisms.
■Although pure glutathione cannot be used in winemaking, inactivated yeast rich in reduced glutathione are approved for use.
Figure 1. Quinones at the centre of the main oxidative damage to the wine. The objective in using inactivated yeast naturally rich in glutathione is to compete with aroma compounds that could bind to quinone, notably nucleophilic addition, thus leaving the aroma compounds free to
contribute to a wine’s sensory qualities and minimise wine oxidation (adapted from Oliveira et al.
2011). ■ A new inactivated yeast naturally enriched with reduced glutathione was trialled on rosé for its effectiveness against oxidation and aroma compound loss.
1Univ. Bourgogne Franche-Comté, AgroSup Dijon, PAM UMR 02.102 Equipe Physico, France 2Lallemand SAS, Blagnac, France 3Lallemand Bio Spain 4Lallemand Australia
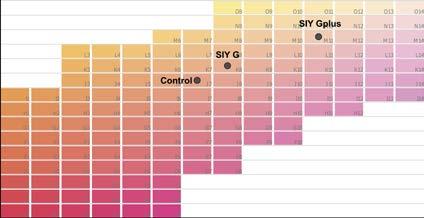
Figure 2. A comparative trial of the application of different inactivated yeast (SIY G, SIY GPlus [marketed as Glutastar]) at the time of clarification of a Syrah-Grenache rosé must (Provence, France).
cysteine and glycine. It is formed through the natural metabolism of yeast. In wine, glutathione can be present in a reduced (GSH) or oxidided form (GSSG). Glutathione is important in winemaking in its reduced form because it can scavenge quinones responsible for browning and aroma loss due to oxidation mechanisms (Lavigne et al. 2007). It is well known that GSH is a more potent antioxidant than ascorbic acid (Antoce et al. 2016), but there are still some uncertainties when applied in commercial winemaking (Schmidt et al. 2020). In addition, pure glutathione cannot be used in winemaking according to FSANZ and OIV regulations.
However, inactivated yeast rich in GSH are approved for use in winemaking. The International Organisation of Vine and Wine (OIV) has recently adopted and incorporated a monograph (OIV-OENO 603-2018) on inactivated yeasts containing glutathione into the international oenological codex. These yeasts are also authorised in the EU (EU 2019/934).
THE GENESIS OF A SPECIFIC INACTIVATED YEAST RICH IN GLUTATHIONE
Empirically, ageing on lees produces wines with better oxidative stability. This is attributed to the oxygen consumption and the release by yeast of many beneficial compounds (e.g., lipids, polysaccharides, peptides). The use of inactivated yeast can mimic ageing on lees since they can exhibit antioxidant properties without microbiological risks.
Several studies have shown that inactivated yeast containing glutathione are more efficient in preventing oxidation than GSH (Andújar-Ortiz et al. 2010, 2014, Comuzzo et al. 2015, Rodríguez-Bencomo et al. 2016, Pozo-Bayon et al. 2009, RodríguezBencomo et al. 2014, Gabrielli et al. 2017). More recently, it has been confirmed that inactivated yeast release a large amount of peptides with antioxidant potential which co-accumulate with the glutathione (Bahut et al. 2019). Thus, it is apparent that it is a combination of the GSH with peptides and nucleophilic components present in the inactivated yeast that are protecting wine aroma compounds.
A specific inactivated yeast (SIY) that has a high glutathione content is produced when a specific wine yeast strain is subjected to a process that ensures the synthesis of glutathione by the yeast and its accumulation in its reduced form in the yeast biomass before inactivation. A new specific inactivated yeast (SIY GPlus) with innovative metabolic characteristics has been developed. The large number and diversity of compounds released by the SIY have numerous winemaking implications, in particular on oxidative stability. This natural oenological tool is an alternative to traditional antioxidants.
IMPACT ON WINE QUALITY Protection of wine colour
A comparative trial was set up at the experimental winery of the Centre du Rosé (Provence, France) on a pilot scale using a Syrah-Grenache rosé must obtained by direct pressing to investigate the impact of SIY GPlus on rosé wine colour. Different must treatment strategies were evaluated at the time of clarification. The addition (30g/hL) of SIY GPlus was compared with a traditional specific inactivated yeast rich in glutathione (SIY G) and an untreated control. Wines were made under standard conditions and the different treatments were monitored until bottling. In particular, the colour was evaluated, and the results of the analyses are shown on the rosé wine colour chart in Figure 2. The lowest orange shade, considered to be higher quality, was obtained with the early treatment of SIY GPlus.
Protection of aromatic compounds
The positive impact of SIY GPlus was also observed on wine aromas. Numerous trials were carried out during white winemaking,
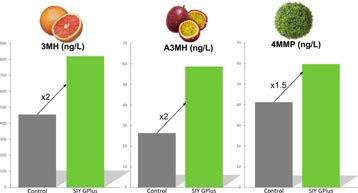
Figure 3. Application of SIY GPlus (marketed as Glutastar) before a cold juice stabulation of eight days at 4°C compared to a control with no addition – thiol analysis in bottled wines (Sauvignon Blanc, Loire Valley, France).
notably on Sauvignon Blanc. This grape variety is ideal for studying the oxidative stability of aromas, as thiols are key markers of oxidation.
One trial conducted in the Loire Valley (France) evaluated the impact of SIY GPlus (30g/hL) added to a Sauvignon Blanc must before a cold juice stabulation of eight days at 4°C. The winemaking process was the same and the aromatic compounds were analysed in the bottled wine. The results, presented in Figure 3, demonstrate the protective effect of SIY GPlus with varietal thiol levels higher than in the untreated control.
Another trial conducted on a Sauvignon Blanc (Loire Valley, France) evaluated the impact of the addition of SIY GPlus (30g/ hL) to free run juice at the press. The aroma index measured in the bottled wines based on Odour Activity Value (aroma compound concentration relative to aroma compound sensory threshold) (Figure 4, see page 18) shows that SIY GPlus provided better preservation of aromatic compounds and a higher vegetal thiolic perception as well as more citrus compared to the control.
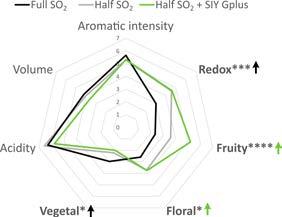
Another trial with SIY GPlus was undertaken in Chardonnay at the Institut Universitaire de la Vigne et du Vin (IUVV, Burgundy, France) in the context of decreasing the use of SO2. Grapes were harvested by hand and 2.5g/hL of SO2 was added in the free run juice at the press. After a cold settling (24 hours at 15°C), 2.5g/hL of SO2 addition (‘Full SO2’) was compared to SIY GPlus at 30g/hL (‘Half SO2 + SIY Gplus’) and a control with a half dose of SO2 (‘Half SO2’). The alcoholic and malolactic fermentations were managed in the same way and a sensorial analysis was conducted on bottled wines. As presented in Figure 5 (see page 18), the wine with half SO2 and SIY GPlus addition was significantly less reductive, less vegetal and exhibited more fruit and floral aromas. In addition, the total SO2 content in the final wines was divided by two for half SO2 treatments (19mg/L) compared to full SO2 (41mg/L).
SCIENTIFIC EVIDENCE BEHIND SPECIFIC INACTIVATED YEAST Metabolomic studies of different types of inactivated yeast to understand the mechanisms of protection
In the past, traditional chemistry and analytical methods were used to detect and quantify various groups of compounds such as sugars, proteins and lipids. More recently, new methods have been developed to target all the compounds present in a yeast cell or matrix, rather than a single target compound. Metabolomics makes possible the simultaneous analysis of all metabolites present and, subsequently, can be classified according to their element composition (C, H, O, S and N) and chemical families (sugars, proteins, lipids) (Figure 6 B and C, see page 18). Metabolomic analysis has been performed in collaboration with the PCAV team at the Institute of Wine and Vine, Dijon, France.
Metabolomics is a powerful tool that finds relationships between chemical composition and specific activity, such as antioxidant activity in our example. First, metabolomics analyses showed vast differences between various types of inactivated yeast based on both the yeast strains used and the culture conditions during production. SIY GPlus, marketed under the name Glutastar, exhibited an exceptional abundance of CHONS compounds. Further research showed that these compounds are related to peptides containing cysteine residues. These peptides are potent antioxidants as they have a free sulfhydryl function, such as glutathione.
The traditional DPPH antioxidant assay has been recently modified to measure antioxidant capacity in a wine like medium (Romanet et al. 2019). This assay has been applied to different samples of inactivated yeasts (Figure 6A, see page 18) and it showed two main results. First, the
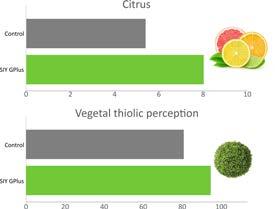
Figure 4. Application of SIY GPlus (marketed as Glutastar) in the free run juice of the press compared to a control with no addition – aroma index based on Odour Value, analysis in bottled wines (Sauvignon Blanc, Loire Valley, France).
antioxidant capacity of inactivated yeast is related to the absolute concentration of GSH and, secondly, the abundance of CHONS (thus peptides containing sulfur) appears to promote better antioxidant capacity.
Thus, it is the combination of a high natural GSH concentration and the unique peptide content in the inactivated yeast that protects wine against oxidation and preserves important varietal aroma compounds, thus confirming those original observations from the early-mid 2000s.
SUMMARY
Even though it is well known that glutathione (GSH) can protect wine against oxidation and aroma compound loss, its use in a pure form is not permitted in winemaking (FSANZ and OIV regulations). SIY GPlus, an inactivated yeast naturally enriched with GSH and other active compounds, offers this protection through both the presence of GSH, a trap for quinone, and with other active compounds (unique peptides, etc.) as traps for free radicals. Finally, implementation of SIY GPlus (Glutastar) at the earliest stages of the white or rosé vinification process ensures an improvement in wine quality by preserving colour and aromas throughout the process and through to bottling. This natural oenological tool can be an alternative to traditional antioxidants, thus enabling a reduction in chemical inputs.
Figure 5. A comparative trial of the application of different levels of SO2 with and without SIY GPlus (marketed as Glutastar) in the pre-fermentative stage in a Chardonnay (IUVV, Burgundy , France).
A B C

Figure 6. (A) The antioxidant capacity estimated using the DPPH assay for different inactivated yeast from traditional (control) to Glutastar; (B) Mapping of the unique chemical molecules released by a traditional inactivated yeast; and (C) Glutastar in a model solution and detected by high resolution mass spectrometry (Bahut et al. 2019, 2020).
REFERENCES
Antoce, A.O.; Badea, G.A. and Cojocaru, G.A. (2016) Effects of glutathione and ascorbic acid addition on the CIELab chromatic characteristics of Muscat Ottonel wines. Agriculture and Agricultural Science Procedia 10:206-214.
Alfonzo, A.; Prestianni, R.; Gaglio, R.; Matraxia, M. and Maggio, A. (2021) Effects of different yeast strains, nutrients and glutathione-rich inactivated yeast addition on the aroma characteristics of Catarratto wines International Journal of Food Microbiology 360:109325
Andújar-Ortiz, I.; Rodríguez-Bencomo, J.J.; Moreno-Arribas, M.V.; Martín-Álvarez, P.J. and Pozo-Bayón, M.A. (2010) Role of glutathione enriched inactive yeast preparations. Instituto de Fermentaciones Industriales CSIC, 1-8.
Andújar-Ortiz, I.A.; Chaya, C.; Martín-Álvarez, P.J.; Moreno-Arribas, M.V. and Pozo-Bayón, M.A. (2014) Impact of using new commercial glutathione enriched inactive dry yeast oenological preparations on the aroma and sensory properties of wines. International Journal of Food Properties 17:9871001.
Bahut, F.; Liu, Y.; Romanet, R.; Coelho, C.; Sieczkowski, N.; Alexandre, H.; Schmitt-Kopplin, P.; Nikolantonaki, M. and Gougeon, R.D (2019) Metabolic diversity conveyed by the process leading to glutathione accumulation in inactivated dry yeast: A synthetic media study. Food Research International 123:762-770.
Bahut, F.; Romanet, R.; Sieczkowski, N.; SchmittKopplin, P. and Nikolantonaki, M. (2020) Antioxidant activity from inactivated yeast: Expanding knowledge beyond the glutathione-related oxidative stability of wine. Food Chemistry 325:126941
Bahut, F.; Silvano, A.; Sieczkowski, N.; Coelho, C.; Nikolantonaki, M.; Schmitt-Kopplin, P. and Gougeon, R. (2019) Originalité d’une nouvelle levure inactivée spécifique au service de la stabilité ozydative des vins blancs et rosés. Revue des Oenologues n°173, October.
Comuzzo, P.; Battistutta, F.; Vendrame, M.; Páez, M.S.; Graziano, L. and Zironi, R. (2015) Antioxidant properties of different products and additives in white wine. Food Chemistry 168:107-114.
Gabrielli, M.; Aleixandre-Tudo, J.L.; Kilmartin, P.A.; Sieczkowski, N. and du Toit, W.J. (2017) Additions of glutathione or specific glutathione-rich dry inactivated yeast preparation (DYP) to Sauvignon Blanc must: Effect on wine chemical and sensory composition. South African Journal of Enology and Viticulture 38(1):18-28.
Lavigne, V.; Pons, A. and Dubourdieu, D. (2007) Assay of glutathione in must and wines using capillary electrophoresis and laser-induced fluorescence detection. Changes in concentration in dry white wines during alcoholic fermentation and aging. Journal of Chromatogr. A 1139,130-135.
Oliveira, C.M.; Ferreira, A.C.S.; De Freita, V. and Silv, A.M.S. (2011) Oxidation mechanisms occurring in wines. Food Research International 44, 1115-1126.
Pozo-Bayon, M.; AngelesAndújar-Ortiz, I. and Moreno-Arribas, M.V. (2009) Scientific evidences beyond the application of inactive dry yeast preparations in winemaking. Food Research International 42:754-761.
Rodríguez-Bencomo, J.J.; Andújar-Ortiz, I.; Moreno-Arribas, M.V.; Simó, C. and González, J. (2014) Impact of glutathione-enriched inactive dry yeast preparations on the stability of terpenes during model wine aging. Journal of Agricultural and Food Chemistry 62:1373-1383.
Rodríguez-Bencomo, J.J.; Andújar-Ortiz, I.; Sánchez-Patán, F.; Moreno-Arribas, M.V. and Pozo-Bayón, M.A. (2016) Fate of the glutathione released from inactive dry yeast preparations during the alcoholic fermentation of white musts. Australian Journal of Grape and Wine Research 22:46-51.
Romanet, R.; Coelho, C.; Liu, Y.; Bahut, F. and Ballester, J. (2019) The antioxidant potential of white wines relies on the chemistry of sulfur-containing compounds: an optimized DPPH assay. Molecules 24:1353.
Schmidt, S.A.; Bekker, M.Z.; Sanders, R.; Cuijvers, K.M.; Kulcsar, A.C.; Capone, D.L.; Puglisi, C. and Jeffery, D.W. (2020) There’s something about glutathione. Technical Review 246:5-12.

MANUFACTURERS OF QUALITY EQUIPMENT FOR THE WINE INDUSTRY
17 Tova Drive Carrum Downs Victoria 3201 Ph: 03 9775 0339 Fax 03 9775 0338 Email: info@fineweld.com.au
www.fineweld.com.au
• Storage and Settling Vats • Variable Capacity • Transportable Tanks • Grape Receival Bins • Conveyor Systems • Installations • Valves • Manways • Fittings • Stainless Steel Wine Barrels • Winery Design and Layouts • Winery 3D Modelling • Gantry – Stairs and Platforms • Drafting and Design • Installation
Trends in the composition of Australian wine 1990 to 2021 Part one: Introduction, titratable acidity and pH
By Peter Godden1 and Eric Wilkes2
This article provides an update to previously published analyses of trends in Australian wine composition and is presented in three parts. Part one, published here, focusses on titratable acidity and pH. Part two will cover alcohol and glucose plus fructose concentrations, while part three will include free, total, and bound sulfur dioxide (SO2) concentrations and the ratio of free to total SO2, as well as overall concluding remarks. Parts
two and three will be published in future issues of Wine & Viticulture Journal.
INTRODUCTION
Since its establishment in 1955, the Australian Wine Research Institute (AWRI) has accumulated a large body of knowledge on the composition of Australian wines. This includes a database of analytical results dating back to 1984, resulting from fee-for-service analyses of wine samples submitted to Affinity Labs (formerly AWRI Commercial Services, formerly the AWRI Analytical Service). That database represents a possibly unique resource in world terms and is periodically mined to examine compositional trends. Collated data have previously been published for mean alcohol concentration and mean SO2 and volatile acidity concentrations (Godden 2000 and the 2003 and 2004 AWRI Annual Reports). In addition, Godden and Gishen (2005) presented data for an extensive range of compositional variables in white and red wines, including comparative data regarding Australian state and grape varietal trends, and that analysis was extended up to the 2008 vintage by Godden and Muhlack (2010). To mark the 60th anniversary of the foundation of the AWRI, Godden et al. (2015) extended the data series to wines from the 2014 vintage, and the current publication extends it further by adding data for the vintages 2015 to 2021.
Data for the vintages 1984 to 1989 (1984 to 1994 for glucose plus fructose), which have been discussed in previous publications, are not republished here. Primarily, this is to increase the clarity of the plots for the most recent vintages. It also recognises the comparatively low sample numbers and consequent higher levels of uncertainty in the data for those earlier years.
Consequently, data from the analysis of 85,448 wines are included here: 35,871 white and rosé wines (with rosé wines included from 2004 onwards) and 49,577 red wines. A total of 7212 white and rosé wines and 14,604 red
IN BRIEF
■Packaged wines are submitted for analyses to Affinity Labs, the commercial arm of the Australian Wine Research Institute, to ensure they comply with the import and export requirements of destination countries.
■Periodically, the data from these analyses are mined to examine the compositional trends in Australian wine.
■The focus of the latest examination was on titratable acidity, pH, alcohol, glucose plus fructose concentrations, free, total and bound sulfur dioxide concentrations, and the ratio of free to total SO2.
■These latest analyses will be presented across three separate articles, with the first of these articles, presented here, focusing on titratable acidity and pH.
1Arrivo Wine, PO Box 151, Aldgate, South Australia 5154 2The Australian Wine Research Institute, PO Box 197, Glen Osmond, South Australia 5064 Contact: Eric.Wilkes@affinitylabs.com.au
wines from the most recent vintages were added to the data set reported by Godden et al. (2015). As with the 2015 publication, all additional data were generated from packaged wines which were submitted for analyses required to comply with the import and export requirements of destination countries. The new data includes multiple vintages of a broad cross section of Australian wines from commodity to icon status and producers of all sizes, with a wide geographical and varietal spread. Up to the 2003 vintage, the data includes both domestic and exported wines.
While representing a wide cross-section of wines from producers in all states of Australia, the sample of wines analysed cannot be considered perfectly representative of Australian commercial wine because it is a self-selected sample of wines submitted by clients of Affinity Labs and represents only exported wines from 2004 onwards. However, while Godden and Muhlack (2010) noted that the dataset was somewhat skewed towards higher priced wines and towards smaller sized wine producers, that appears to be increasingly less so over time. Data added for the 2015 paper and for the current publication includes an increasing proportion of commodity and entry-level wines from most of Australia’s largest wine producers, as well as from thirdparty exporters. Therefore, due to the size and geographical spread of Affinity Labs’ client base and the number of wines analysed, the data are considered in all probability to be strongly representative of trends in the composition of all Australian wine.
DATA PRESENTATION
The data are presented in two formats— interval plots and box plots—with the plots for white and rosé wines shown in green and the plots for red wines shown in red. The interval plots show the mean of the data for each year, plotted as a line joining the means, together with vertical error bars to indicate the standard error for a 95% confidence interval. In the box plots, the centre horizontal line marks the median of the data for each year. The upper edge of the box represents the third quartile (below which 75% of the data resides), with the lower edge representing the first quartile (below which 25% of data resides), calculated according to the method of Tukey (1977). The ‘whiskers’ (the vertical lines extending above and below the box) show the range of observed values that fall within 1.5 IQR (Interquartile Range) beyond the box, where IQR is defined as the absolute value of the differences between the values of the two whiskers. Values beyond the whiskers (outliers) are shown as circles when they fall outside of 3.0 IQR beyond the box, with darker circles indicating overlapping results.
RESULTS AND DISCUSSION
The plots presented here summarise the analytical results recorded in the database when they were generated in mid-2022. New analytical results are continually added, especially for the most recent vintages and, consequently, some results for individual analytes presented here differ slightly from those in previous publications, without impacting the overall trends. That any such differences when additional data are added are so marginal, might reinforce the representative nature of the overall data set.
For each compositional variable, plots are presented for white and rosé wines combined, and for red wines. Data for rosé wines were first included in this series by Godden et al. (2015) from the 2004 vintage onwards. The proportion of rosé wines included in the data presented here for white and rosé wines is 8.13% compared to 7.08% in 2015. This represents a notable change in the nature of samples submitted for analysis compared to data presented in 2005 and 2010, from which the very few rosé wines which had been analysed at those time-points were removed, and reflects the dramatic growth in the rosé category internationally in recent years (Peres et al. 2020).
TITRATABLE ACIDITY
Titratable acidity at pH8.2 (TA) is a measure of all the acids that are present in the wine, chiefly tartaric, succinic, malic and lactic acids. TA is a good indicator of the amount of acid present in grapes as well as wine and is, therefore, often used to monitor the degree of ripeness of grapes, with TA decreasing with increasing ripeness. TA also affects the sensory properties of wine and, in some circumstances, might be used as a quality control measure to detect wine spoilage when volatile acids may be formed. TA can be adjusted by winemakers through the addition of allowable acids, which are purified from grapes, or by the addition of allowable mineral salts, such as potassium carbonate, which have the effect of reducing TA.
The mean and the distribution of TA concentrations in white and rosé wines remained largely stable between 1990 and 1995, and then again between 1996 and 2010, with no apparent effect from the inclusion of rosé wines from 2004 onwards (Figures 1a and 1b). However, from 2010 the mean values fluctuated markedly up until 2016, with a low of 6.25g/L in that year, followed by a steady increase to a high of 6.53g/L
10
TA g/L, pH 8.2
5
1990 2000
Vintage
2010 2020
Figure 1a. Mean titratable acidity concentration at pH8.2 in white and rosé wines 1990-2021 (rosé wines included from 2004 vintage onwards).
1990 2000 2010
2020 Vintage Figure 1b. Median (horizontal line) and distribution of titratable acidity
concentrations at pH8.2 in white and rosé wines 1990-2021 (rosé wines included from 2004 vintage onwards).
in 2020, with corresponding shifts either upwards or downwards in the distribution of concentrations, but without marked changes in the makeup of those distributions. Comparison of the distributions of TA in rosé wines and white wines showed that the average TA was approximately 0.4g/L lower for rosé wines than white wines (data not shown). Previous papers in this series have stated that of all the compositional variables discussed, TA is the one over which the winemaker has the greatest control. However, that does not appear to explain such shifts in the distributions year to year, and it is possible that increasing climate variability is responsible for the comparatively high degree of variability seen since 2010.
If that were the case, similar year to year trends might also be expected with red wines. However, while year to year variability in TA concentrations has also increased markedly in red wines (Figure 2a), little relationship is seen between the trends for red wines and those for white and rosé wines. Of note is a marked above-trend increase of mean TA in red wines in 2018. That 2018 was a high TA year is confirmed by Cowey (2018), which indicated that during the 2018 vintage acid additions often resulted in a rise, instead of a decrease, in pH and a much higher TA than expected. This observation was attributed to markedly higher-than-usual potassium concentrations in fruit that year.
As demonstrated in Figure 2a, mean TA concentration in red wines increased steadily from 5.8g/L in 1990 to 6.49g/L in 2007, before a general downward trend became established. As with white and rosé wines, those upward and downward trends were mirrored by corresponding year-on-year shifts in the distribution of concentrations and were most likely winemaker driven according to the desired wine styles of the day. However, winemaking intervention seems unlikely to solely account for the substantial year-toyear variation seen on the downward trend since 2008. It is noted that while there is only an indirect relationship between TA and pH, no corresponding year-on-year variability is seen in the pH data presented in Figures 3 (a) and (b) and 4 (a) and (b). While it is not possible to state definitively the cause of the recent year-on-year variability in the formerly comparatively stable measure of TA, in the absence of other explanations, increasing year-on-year climate variability may be a contributing factor.
PH
The measure of pH is one of the most important analytical measurements in grapes and wine for several reasons. It provides a good indication of the degree of ripeness of grapes, has an important effect on the metabolism of microorganisms in wine and influences the flavour, colour, mouthfeel, and physical and microbial stability of wine. Lowering pH increases the proportion of sulfur dioxide (SO2) in the ‘free’ form as opposed to the ‘bound’ form, and it is the free form which confers the greatest microbial and antioxidant ability (Boulton et al. 1996). Wine pH can be adjusted to some extent by winemakers through the addition of organic acids, such as tartaric acid to lower pH, or by the addition of
6.4
6.2
6.0 15
10
TA g/L, pH 8.2
5
5.8
1990 2000
Vintage
2010 2020
Figure 2a. Mean titratable acidity at pH8.2 concentration in red wines 1990-2021. Figure 2b. Median (horizontal line) and distribution of titratable acidity concentrations at pH8.2 in red wines 1990-2021.
0
1990 2000 2010 2020
Vintage
4.5
4.0
pH
3.5
3.0
1990 2000
Vintage
2010 2020
2.5
1990 2000
Vintage
2010 2020
Figure 3 (b). Median (horizontal line) and distribution of pH values in white and rosé wines 1990-2021 (rosé wines included from 2004 vintage onwards).
1990 2000
Vintage
2010
Figure 4 (a). Mean pH values in red wines 1990-2021
2020
4.5
4.0
pH
3.5
3.0
2.5
1990 2000
Vintage
2010 2020
Figure 4 (b). Median (horizontal line) and distribution of pH values in red wines 1990-2021.
allowable mineral salts, which increase the pH.
Godden et al. (2015) noted an apparent trend of rising pH in the more recent vintages of white and rosé wines but found no statistically significant differences between the means. However, with increased sample numbers for those vintages, and the consequent reduction in statistical uncertainty, that upward trend to a peak pH of 3.31 in 2014 is now confirmed, but with a fall in subsequent years (Figure 3a). As with previous analyses, the markedly low pH in 2009 remains an outlier, probably due to the low sample numbers available for that vintage and the consequent large error. For this reason, that data point may probably be discounted. It should be noted that although upward and downward trends are apparent in the mean pH of white and rosé wines, with a slight upward shift in the distribution of pH values in rosé compared to white wines (data not shown), the quantum difference between vintages is small, with a difference of 0.08pH units covering the range for the averages in the entire data series between 1990 and 2021. As such, this is a stable measure, as illustrated by the distribution in Figure 3b, with only minor shifts up or down in the entire distribution year-on-year.
The story is different with red wines, with the steady upward trend in the mean pH continuing from that noted in the 2005, 2010 and 2015 publications, to a peak of 3.6 in 2016, with a downward trend becoming apparent in subsequent years. Likewise, the 2010 and 2015 papers in this series noted a marked narrowing of the distribution of pH concentrations up to the 2014 vintage, but that trend has also reversed since 2015, with a greater number of outlier wines at the lowest end of the distribution (Figure 4b).
The trend to higher pH in red wines seen from 1990 to 2016 probably reflects winemakers’ choices, because higher pH results in wines which are ‘softer’ in the mouth, with higher perceived viscosity and lower perceived acidity (Gawel et al. 2014). However, at the same time, higher pH also increases the risk of wine instability, particularly microbial instability, largely through reducing the proportion of free SO2. Therefore, Australian winemakers who are choosing to increase the pH of their wines should be aware of the increased associated risk of microbiological spoilage and oxidation, especially considering the downward trends of total SO2 concentrations in both white and rosé wines and red wines, which will be presented in part 3 of this article.
ACKNOWLEDGEMENTS
This work was supported by Australian grapegrowers and winemakers through their investment body Wine Australia, with matching funds from the Australian Government. The AWRI is a member of the Wine Innovation Cluster in Adelaide, South Australia.
The authors thank Affinity Labs for access to the database and for extracting the raw data, Anne Lord and Rosanne Dunne from AWRI Information Services for help with literature searches, and Geoff Cowey, AWRI Senior Oenologist, for supplying reference material and for discussion of the data. Ella Robinson is thanked for editorial assistance.
REFERENCES
Cowey, G. (2018) Ask the AWRI: Winemaking with high pH, high TA and high potassium fruit. Aust. N.Z. Grapegrower Winemaker 657:80-81
Boulton, R.B.; Singleton, V.L.; Bisson, L.F. and Kunkee, R.E. (1996) Principles and practices of winemaking. New York, USA: Chapman and Hall
Gawel, R.; Day, M.; Van Sluyter, S.C.; Holt, H.; Waters, E.J. and Smith, P.A. (2014) White wine taste and mouthfeel as affected by juice extraction and processing. J. Agric. Food Chem. 62:20,008–20,024
Godden, P.W. (2000) Persistent wine instability issues. Aust. N.Z. Grapegrower Winemaker 443:10–14
Godden, P.W. and Gishen, M. (2005) Trends in the composition of Australian wine 1984–2004. Blair, R.; Francis, M. and Pretorius, I. (eds.) AWRI: advances in wine science: commemorating 50 years of The Australian Wine Research Institute. Glen Osmond, SA: The Australian Wine Research Institute: 115–139
Godden, P.W. and Muhlack, R. (2010) Trends in the composition of Australian wine 1984–2008, Aust. N.Z. Grapegrower Winemaker 558:47–61
Godden, P.W.; Wilkes, E. and Johnson, D. (2015) Trends in the composition of Australian wine 1984-2014. Aust. J. Grape Wine Res. 21(S1):741–753
Peres, S.; Giraud-Heraud, E.; Masure, A-S. and Tempare, S. (2020) Rosé wine market: Anything but colour? Foods 9(12):1850
Tukey, J.W. (1977) Exploratory data analysis. Reading, Massachusetts, USA: Addison-Wesley.
Under pressure Tank method sparkling wine production
By Rachel Gore, Director, Free Run Consulting Email: rgore@freerunconsulting.com.au
Rachel walks readers through the differences between the carbonation and charmat sparkling wine methods.
There are many different ways to create bubbles in wine. Some are quite simple while others are more complex. Each method results in a different carbonation level and, ultimately, a different style of sparkling wine.
The degree of carbonation in sparkling wines directly affects our perception of their taste. The higher the pressure, the finer the bubble. The sensation that carbonation in wine gives to the consumer is why carbonation matters. The bubbles cause a physical stimulus in a wine drinker’s mouth and can make a wine taste crisper and more refreshing. Because carbon dioxide is soluble in wine (as it is in water), all wines contain some dissolved carbon dioxide.
A wine bottled with <1 additional atmospheres of pressure where bubbles appear on the sides of the bottle or glass when the wine is opened is termed ‘beady’. A wine with 1-2.5 atmospheres of pressure that is slightly sparkling is termed ‘semi-sparkling’ and a wine that has 3 or more atmospheres of pressure can be labelled a ‘sparkling’ wine.
In this article I will focus on the differences between the sparkling wine processes achieved in tank i.e., carbonation vs charmat.
CARBONATION METHOD
The carbonation method simply takes a still wine and carbonates it with carbon dioxide in a pressurised tank. The wine is then bottled under pressure.
Carbonation occurs when carbon dioxide dissolves in an aqueous solution. However, carbon dioxide doesn’t easily dissolve under everyday conditions. To make this happen, manufacturers need to increase the pressure of the vessel the liquid is in and keep it at a low temperature. Under these conditions the liquid is able to trap carbon dioxide molecules, making it fizz.
When carbon dioxide dissolves in a solution, water and gaseous carbon dioxide react to form a dilute solution of carbonic acid. This reaction is reversible which means it can go forwards and backwards. When sparkling wine is in a sealed bottle, the high pressure inside the bottle forces the chemical reaction in the forward direction, forming carbonic acid. The forward reaction continues until the concentration of the reactants and products no longer change. In other words, when the two chemical reactions are in equilibrium. Once you open the bottle, the pressure is released which shifts the chemical reaction backwards. The dissolved carbon dioxide starts coming out of the solution forming bubbles which release the carbon dioxide into the air. The escaping carbon dioxide lowers the carbon dioxide in the wine and because of this lower concentration, the carbonic acid turns back into carbon dioxide and water. The result is a new equilibrium.
Below are two methods used in the wine industry today to achieve carbonation.
Membrane contactors
Membrane contactors have been around since 1992 and were developed for the perstraction (membrane extraction process where two liquid phases are contacted across a membrane) of substances from liquids. The technology allows the implementation of liquidliquid, liquid-gas or liquid-gas-liquid separations (Sengupta et al. 1998). The main component of the system is a hydrophobic, porous, hollow, fibre membrane system that allows only gases like oxygen, nitrogen and carbon dioxide in their gaseous phase through the membrane barrier of micro pores.
Membrane contactors facilitate mass transfer between two fluids. For wine gas management, wine flows on one side of the membrane and a gas (or vacuum) flows on the other side. Wine doesn’t pass through the membrane because the membrane is hydrophobic and has very small pores (0.03um).
The method of introduction of CO2 with membrane contactors is quite different from other carbonation techniques. It involves bubbleless diffusion. There have been suggestions that this technique results in bubbles that are finer and more like those in bottle fermented sparkling wine than with other in-line carbonation methods, however, this is questionable. While there may be bubble differences immediately after carbonation using a membrane contactor compared to other in-line carbonators, it seems likely that the bubble dynamics will be the same after CO2 equalises in bottle for weeks or months prior to consumption.
Using the membrane contactor system a winemaker is able to control the gas concentration simultaneously with recirculation in the tank, in transfer from one tank to another or directly in-line with

the bottling. With this tool, it is possible to adjust the exact amount of carbon dioxide, either decreasing or increasing the concentration, by reducing up to 95% of the initial oxygen and nitrogen concentration in one passage at 25°C wine temperature. At lower temperatures the efficiency is reduced (Schmidt and Waidelich 2007).
Sparging
This process involves very fine bubbles of an inert gas being bubbled through the wine. Wines are sparged with gas either via a gas line connection to a valve at the bottom of a tank, via a submersible bubbler or in-line during a wine transfer between tanks or during tank circulation. The gas is injected under pressure into the wine and for best results the liquid should be under slight pressure. Turbulence increases contact of the wine with the sparging gas and therefore increases sparging efficiency.
The gas-liquid interface is critical in the process of sparging wine, and a high surface contact area can be achieved by dispersing very fine bubbles of gas throughout the liquid. The small bubble size is achieved using stainless steel sinters connected to a gas line. Sinter sizes can vary from 2-100um. Wilson (1985) showed that sinter pore size influences sparging efficiency with 2um being more efficient than 15um at the same gas flow rate, presumably due to smaller bubbles being released with the 2um sinter. It is unusual then that the 15um sinter tends to be the most commonly used in the wine industry. This may relate to difficulties in achieving sufficient gas flow rate through finer sinters either due to the size of the pores or clogging of those pores. Sinters do have some advantage over membrane contactors for gas adjustment. They are much cheaper to buy and can work with turbid wine.
CHARMAT METHOD
This method of sparkling wine production was first patented by an Italian, Federico Martinetti, in 1895, and it was, unsurprisingly, known as the metodo martinetti. In 1907, after some tweaks and development, it was patented again in 1907 by a Frenchman from Bordeaux, Eugène Charmat, which is where it gets one of its modern names. It’s also referred to as cuve close (in French), the tank method, granvas (Spanish) or autoclave (Italian).
In Champagne (and other premium sparkling wine) production areas, the still base wine undergoes a second fermentation in bottle. This fermentation (and subsequent ageing) can be anywhere from 15 months up to many years. Vintage Champagne is required to spend a minimum of three years in bottle.
Charmat is a method used for creating sparkling wine where the base wine undergoes its primary fermentation in stainless steel tanks, creating fruity still wine with relatively low alcohol. The wine is then moved to a pressurised stainless-steel tank called an autoclave where it will undergo secondary fermentation.
This secondary fermentation is known as ‘Pris de Mousse’, or the ‘formation of bubbles’, and is a very important step whether it is done in bottle or in a pressurised tank.
The main aim of the secondary fermentation is to obtain a sparkling wine with about six bar of pressure at 10°C. At the start of secondary fermentation, an initial concentration of around 1-2 million live yeast cells/ml of wine are required to breakdown 24g/L sugar. This consumption of sugar is accompanied by an increase in alcohol levels of between 1.2% to 1.4% by volume, with a final concentration of carbon dioxide of between 10-12g/L.
Base wines are usually made from dry white wines but also with rosé or even red wines. For a successful secondary fermentation, various wine parameters must be met: • pH >2.9 • free SO2 <15mg/L • temperature >10°C
Malolactic fermentation can be used in the base wine to assist with deacidification.
In the case of potentially unstable base wines, suitable fining products must be used followed by tartrate stabilisation in order to prevent the crystallisation of potassium bitartrate or calcium tartrate, as these may cause serious problems later.
In most cases, careful filtration may be carried out after stabilisation in order to ensure the wine’s clarity. During the stabilisationfiltration stages of the base wine, care must be taken to minimise oxygen exposure.
The preparation of the yeast culture for the secondary ferment is critical in the success of the fermentation. Secondary fermentation is re-fermentation. The base wine, with its 11-12% alcohol by volume, its low pH and SO2 content make it a lot more hostile than grape must. In the case of Charmat, the secondary fermentation happens in a pressurised tank, so the presence of CO2 and pressure prevents yeast growth. The selection of a yeast strain intended for secondary fermentation is
fundamental. The yeast culture is prepared in several phases: Phase 1 – the rehydration and protection of the yeast Phase 2 – the ‘yeast starter’ phase, lasting 12-24 hours helping the yeast acclimatise to the alcohol Phase 3 – the ‘multiplication’ phase lasting around three days which helps the culture propagate in order to obtain an active fermentation.
Secondary fermentation generally takes place at 12-25°C over approximately 10 days. Ageing is not always practised but where it is desired, it takes place in a tank fitted with an agitator and the duration depends on the character of the sparkling wine desired. Stabilisation by refrigeration at -2°C may either be on the base wine or at this stage. The wine is filtered at low temperatures and then transferred, under pressure, to a buffer tank preserving the dissolved carbon dioxide. The dosage liqueur is now added to the tank if required. The quality of the end product depends heavily on the attention paid to the preparation of the dosage liqueur. This liqueur can be made with cane or beet sugar dissolved in the base wine, MCR (rectified must concentrate) or perhaps some ‘reserve’ or high-quality wine.
Bottling is carried out at the same pressure with the bottles then corked, caged and labelled.
Wines made using the Charmat method have a distinctly fresh, fruit-driven character with stronger secondary or yeasty flavours — especially those fermented for a shorter time. The bubbles are typically larger and coarser than the bubbles found in traditional method wines and while bottle fermented sparkling wine can vary across individual bottles, those made in the Charmat method will be uniform across the batch.
Some may argue that the tank methods used to make sparkling wine that have been discussed in this article are of a lesser quality than sparkling wine made using the traditional method, but while the process is more affordable (and therefore more popular with lower quality wines), they are still methods than can be used to make premium sparkling wines.
REFERENCES
Blank, A. and Vidal, J-C. (2012) Gas management by membrane contactor: ester and higher alcohol losses, and comparison with porous injector in Proceedings of 34th World Congress of Vine and Wine at Porto.
Nordestgaard, S. (2018) Gains in speed, labour and gas consumption for winemakers. Aust.NZ Grapegrower Winemaker 648:61-67.
Sengupta, A.; Peterson, P.A.; Miller, B.D.; Schneider, J. and Fulk Jr, C.W. (1998) Large-scale application of membrane contactors for gas transfer from or to ultrapure water. Separation and Purification Technology 14( 1-3):189-200.
Schmidt, O. and Waidelich, G. (2007) Neues Verfahren zur optimierung der gehalte an gelösten gasen im wein sowie der alkoholreduzierung. In: Proceedings of the Intervitis Interfructa Congress for Process control Poster Presentation.
Wilson, D.L. (1985) Sparging with inert gas to remove oxygen and carbon dioxide. Aust. N.Z. Grapegrower Winemaker 256:112-114. WVJ
DIRECT PITCH !
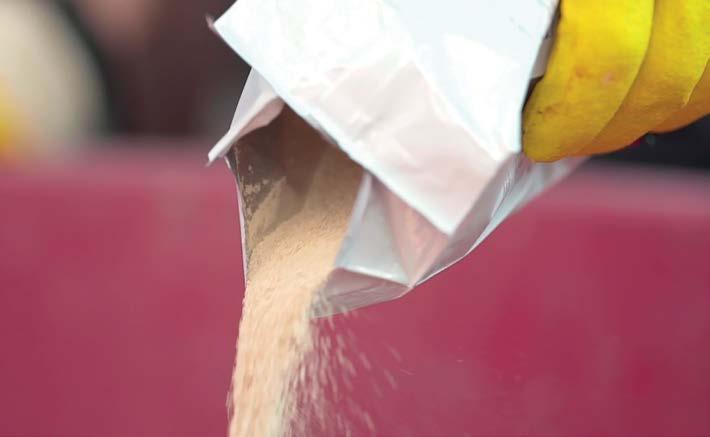
Fermentis E2U™ yeasts are so efficient and secure that you can pitch them directly. You save time, gain comfort and act green, consuming less water and energy. If you prefer, you can choose to rehydrate them beforehand: we guarantee the same final results.


