3 minute read
Building on Current Standards


BUILDING ON CURRENT STANDARDS
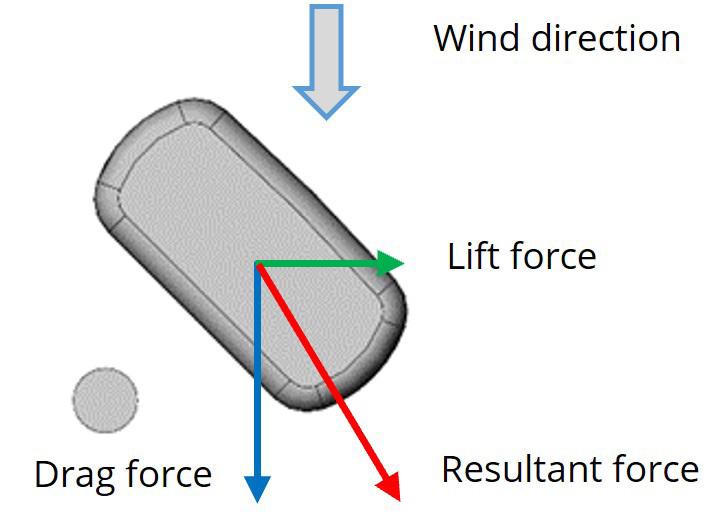
To date, one of the biggest limitations for equipment designers has been that the standards used by civil engineers to design towers and supporting structures (EN1991-1-4 / TIA222) do not easily translate for Base Station Antennas. The shapes covered by the above standards are symmetrical and the calculated wind load force is typically equivalent to drag force only, and does not account for the lift force. This has limits when applied to antenna design. Of course antennas still need to adhere to these standards from a legal perspective, but more is needed to be able to give customers a clear view of the wind loading capabilities. This led to the development of the P-BASTA12 recommendations. These have been developed with antenna vendors to “standardize” the measurement processes between the different antenna vendors and give meaningful information to customers looking to maximize the potential of cell tower sites. It recommends changes to wind tunnel testing which in turn allows calculations to take into consideration lift force factors and better inform the decision making process. Rather than looking at the drag force in three positions (front/side/rear) using the European Standard EN1991-1-4 method or TIA-222 methodology which uses Effective Projected Area and a shielding coefficient to calculate the drag force of the wind at any direction, the P-BASTA12 recommendations look at the resultant force which is the vector sum of the drag force and the lift force. The drag force is parallel to the direction of flow, while the lift force is perpendicular to the direction of the flow and results from an asymmetry in the flow around the antenna. The total force is the combination of the two vectors (drag and lift) which gives the resultant force. This is tested in a wind tunnel environment and provides calculations of force distribution, drag and lift components in all directions. By adding this into the equation, we are provided with more accurate wind load values, giving a clearer picture of wind load capabilities and full transparency to operators as they make decisions on how to approach tower loading.
Advertisement
Figure 1: Antenna in test configuration Figure 2: Drag, Lift and Resultant force
NOTE: P-BASTA is not a substitution for existing standards, the associated requirements still need to be met from a legal perspective. P-BASTA is instead a recommendation for Base Station Antenna Standards which complements existing regulations.
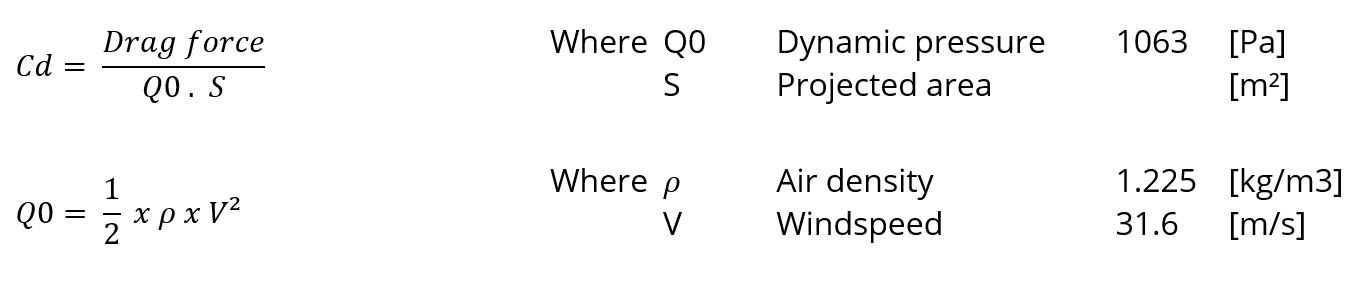
The wind tunnel experiment provides more accurate results, as the test accounts for the unequal round corners and unsymmetrical shapes. This is demonstrated below with a comparison of the drag coefficient between wind tunnel and the standard EN1991-1-4 for different antennas. The drag coefficient Cd is calculated using the following formula:
FRONTAL POSITION LATERAL POSITION REAR POSITION
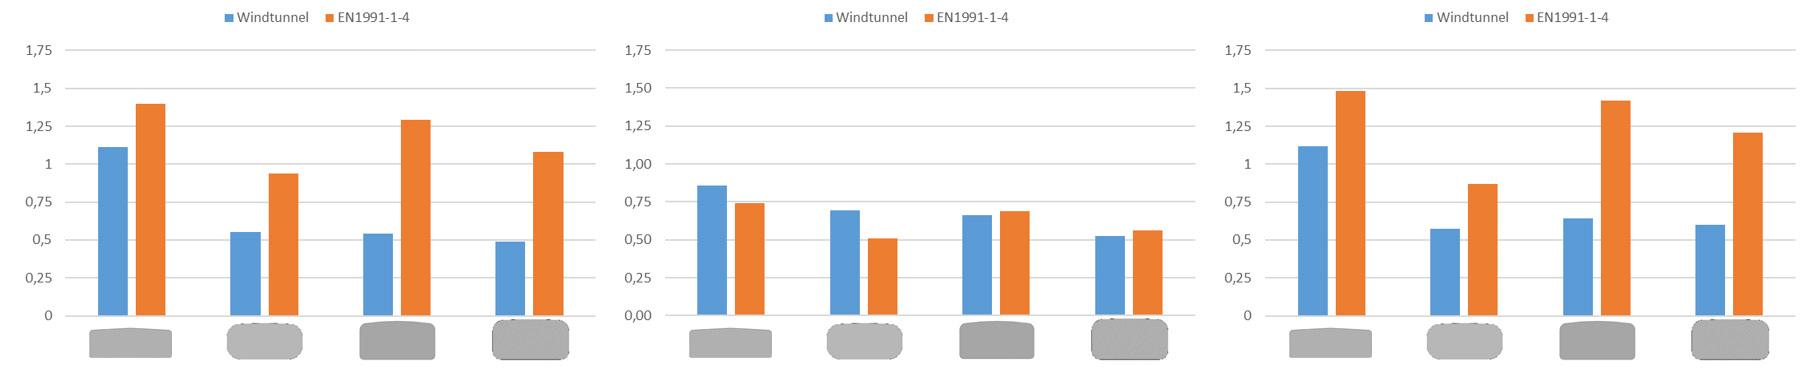
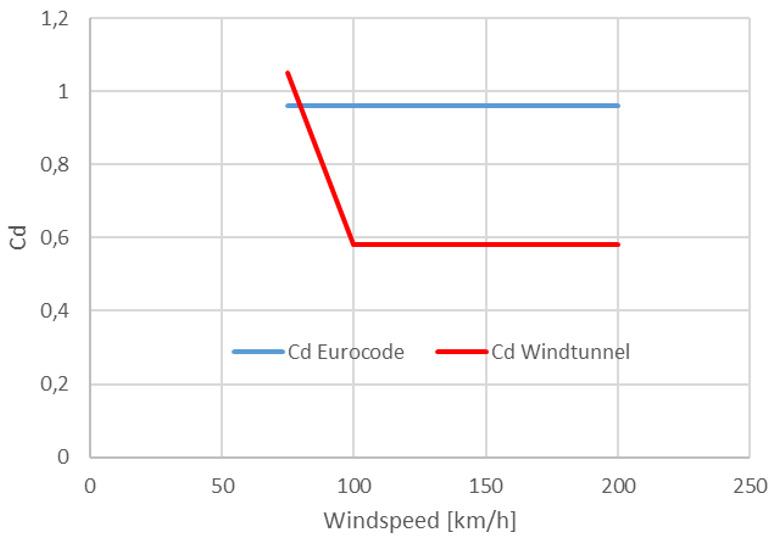
We observed that for both frontal and rear position the measured drag coefficient can be more than two times lower than the standard. The reason for this discrepancy is that the standard does not consider the critical Reynolds number* characterized by a drop in the drag. This phenomenon is visible when you perform a windspeed sweep on the antenna. Depending on the antenna shape, a decrease of the drag coefficient should be observed followed by a convergence. This convergence is important to accurately conduct windspeed interpolation. By taking the time to refine measurement techniques to ensure the most accurate possible test results, we are now able to look at pushing the wind loading efficiency of base station antennas.
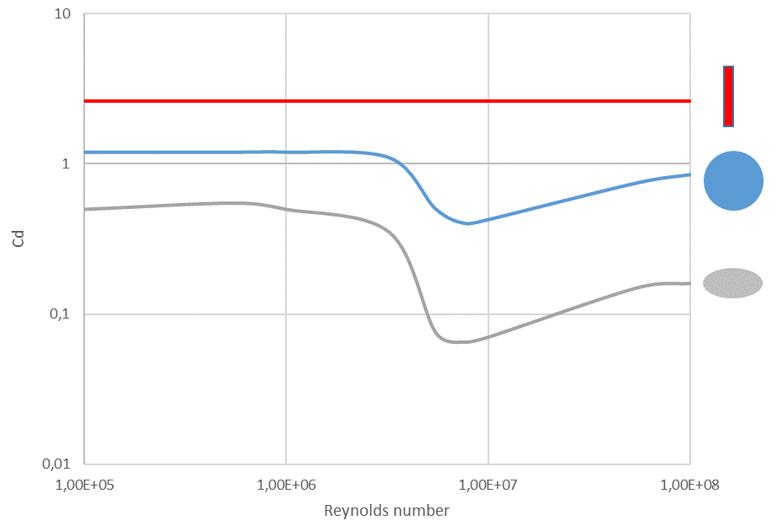
Figure 3: Drag coefficient vs Reynolds number Figure 4: Comparison drag coefficient vs windspeed