4 minute read
AAA Selection Tools


Expected Progeny Difference (EPD), is the prediction of how future progeny of each animal are expected to perform relative to the progeny of other animals listed in the database. EPDs are expressed in units of measure for the trait, plus or minus. Interim EPDs may appear on young animals when their performance has yet to be incorporated into the American Angus Association National Cattle Evaluation (NCE) procedures. This EPD will be preceded by an “I”, and may or may not include the animal’s own performance record for a particular trait, depending on its availability, appropriate contemporary grouping, or data edits needed for NCE.
Growth
Calving Ease Direct (CED), is expressed as a difference in percentage of unassisted births, with a higher value indicating greater calving ease in first-calf heifers. It predicts the average difference in ease with which a sire’s calves will be born when he is bred to first-calf heifers.
Birth Weight EPD (BW), expressed in pounds, is a predictor of a sire’s ability to transmit birth weight to his progeny compared to that of other sires.
Weaning Weight EPD (WW), expressed in pounds, is a predictor of a sire’s ability to transmit weaning growth to his progeny compared to that of other sires.
Yearling Weight EPD (YW), expressed in pounds, is a predictor of a sire’s ability to transmit yearling growth to his progeny compared to that of other sires.
Yearling Height EPD (YH), is a predictor of a sire’s ability to transmit yearling height, expressed in inches, compared to that of other sires.
Scrotal Circumference EPD (SC), expressed in centimeters, is a predictor of the difference in transmitting ability for scrotal size compared to that of other sires.
Maternal
Calving Ease Maternal (CEM), is expressed as a difference in percentage of unassisted births with a higher value indicating greater calving ease in firstcalf daughters. It predicts the average ease with which a sire’s daughters will calve as first-calf heifers when compared to daughters of other sires.
Maternal Milk EPD (Milk), is a predictor of a sire’s genetic merit for milk and mothering ability as expressed in his daughters compared to daughters of other sires. In other words, it is that part of a calf’s weaning weight attributed to milk and mothering ability.
Cow Energy Value ($EN), expressed in dollars savings per cow per year, assesses differences in cow energy requirements as an expected dollar savings difference in daughters of sires. A larger value is more favorable when comparing two animals (more dollars saved on feed energy expenses). Components for computing the cow $EN savings difference include lactation energy requirements and energy costs associated with differences in mature cow size.
Carcass
The genetic evaluation produces a single set of EPDs for carcass weight, marbling score, Ribeye area and fat thickness. The units of measure are in carcass trait format and analyzed on an age-constant basis.
Carcass Weight EPD (CW), expressed in pounds is a predictor of the differences in hot carcass weight of a sire’s progeny compared to progeny of other sires. Marbling EPD (Marb), expressed as a fraction of the difference in USDA marbling score of a sire’s progeny compared to progeny of other sires.
Ribeye Area EPD (RE), expressed in square inches, is a predictor of the difference in ribeye area of a sire’s progeny compared to progeny of other sires.
Fat Thickness EPD (Fat), expressed in inches, is a predictor of the differences in external fat thickness at the 12th rib (as measured between the 12th and 13th ribs) of a sire’s progeny compared to progeny of other sires.
Highlight Key
TOP 10%
TOP 20%
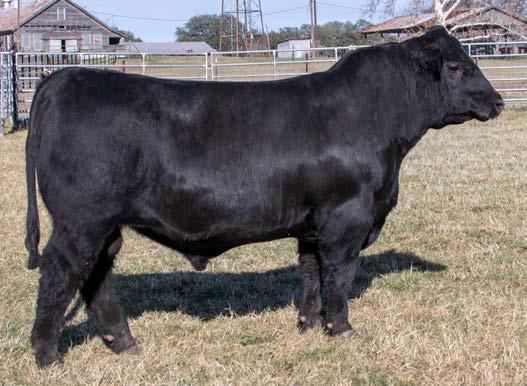
Sexton Powerball 1s06
$VALUE INDEXES
$Value indexes, are multi-trait selection indexes to assist beef producers by adding simplicity to genetic selection decisions. $Values are reported in dollars per head, where a higher value is more favorable. The $Value is an estimate of how future progeny of each sire are expected to perform, on average, compared to progeny of other sires in the database if the sires were randomly mated to cows and if calves were exposed to the same environment.
Maternal Weaned Calf Value ($M), expressed in dollars per head, predicts profitability differences from conception to weaning with the underlying breeding objective assuming that individuals retain their own replacement females within herd and sell the rest of the cull female and all male progeny as feeder calves. The model assumes commercial producers will replace 25% of their breeding females in the first generation and 20% of their breeding females in each subsequent generation. Traits included are as follows: calving ease direct, calving ease maternal, weaning weight, milk, heifer pregnancy, docility, mature cow weight, claw set and foot angle.
Weaned Calf Value ($W), an index value expressed in dollars per head, is the expected average difference in future progeny performance for pre-weaning merit. $W includes both revenue and cost adjustments associated with differences in birth weight, weaning direct growth, maternal milk, and mature cow size.
Feedlot Value ($F), an index value expressed in dollars per head, is the expected average difference in future progeny performance for post-weaning merit compared to progeny of other sires.
Grid Value ($G), an index value expressed in dollars per head, is the expected average difference in future progeny performance for carcass grid merit compared to progeny of other sires.
Beef Value ($B), an index value expressed in dollars per head, is the expected average difference in future progeny performance for post-weaning and carcass value compared to progeny of other sires.
Combined Value ($C), expressed in dollars per head, is an index which includes all traits that make up both Maternal Weaned Calf Value ($M) and Beef Value ($B) with the objective that commercial producers will replace 20% of their breeding females per year with replacement heifers retained within their own herd. The remaining cull heifer and steer progeny are then assumed to be sent to the feedlot where the producers retain ownership of those cattle and eventually sell them on a quality-based carcass merit grid. EPDs directly influencing a combined index are: CED, CEM, WW, YW, Milk, HP, DOC, MW, Angle, Claw, DMI, Marb, CW, RE and Fat.
1a
Sexton Powerball 1s06
Sexton Acclaim 1s13


Lff Home Town 1029
Hometown Acclaim 1684

Lff Home Town
5a
Lcc Hometown Acclaim 1295


5b Lcc Home Town Acclaim 1811
Lff Salvation 1067
Lff Ultra Provider 1033
Fireball
9

Lff Fireball 1023
2 Bar Revelation 1614
Lcc Revel Ascend 1981
Lff Revelation 1018
Lff Revelation 1007
Lff Revelation 1048
Lff Ambition 1031
Lff Ambition 1046
Lff Ambition 1102
Lff Ambition 1111
Lff Home Town 1063
Lcc Black Ascend 1537