INSIGHT

THE
PERTH INDUSTRIAL VACANCY & MARKET OVERVIEW NOVEMBER 2022

Perth Industrial Vacancy
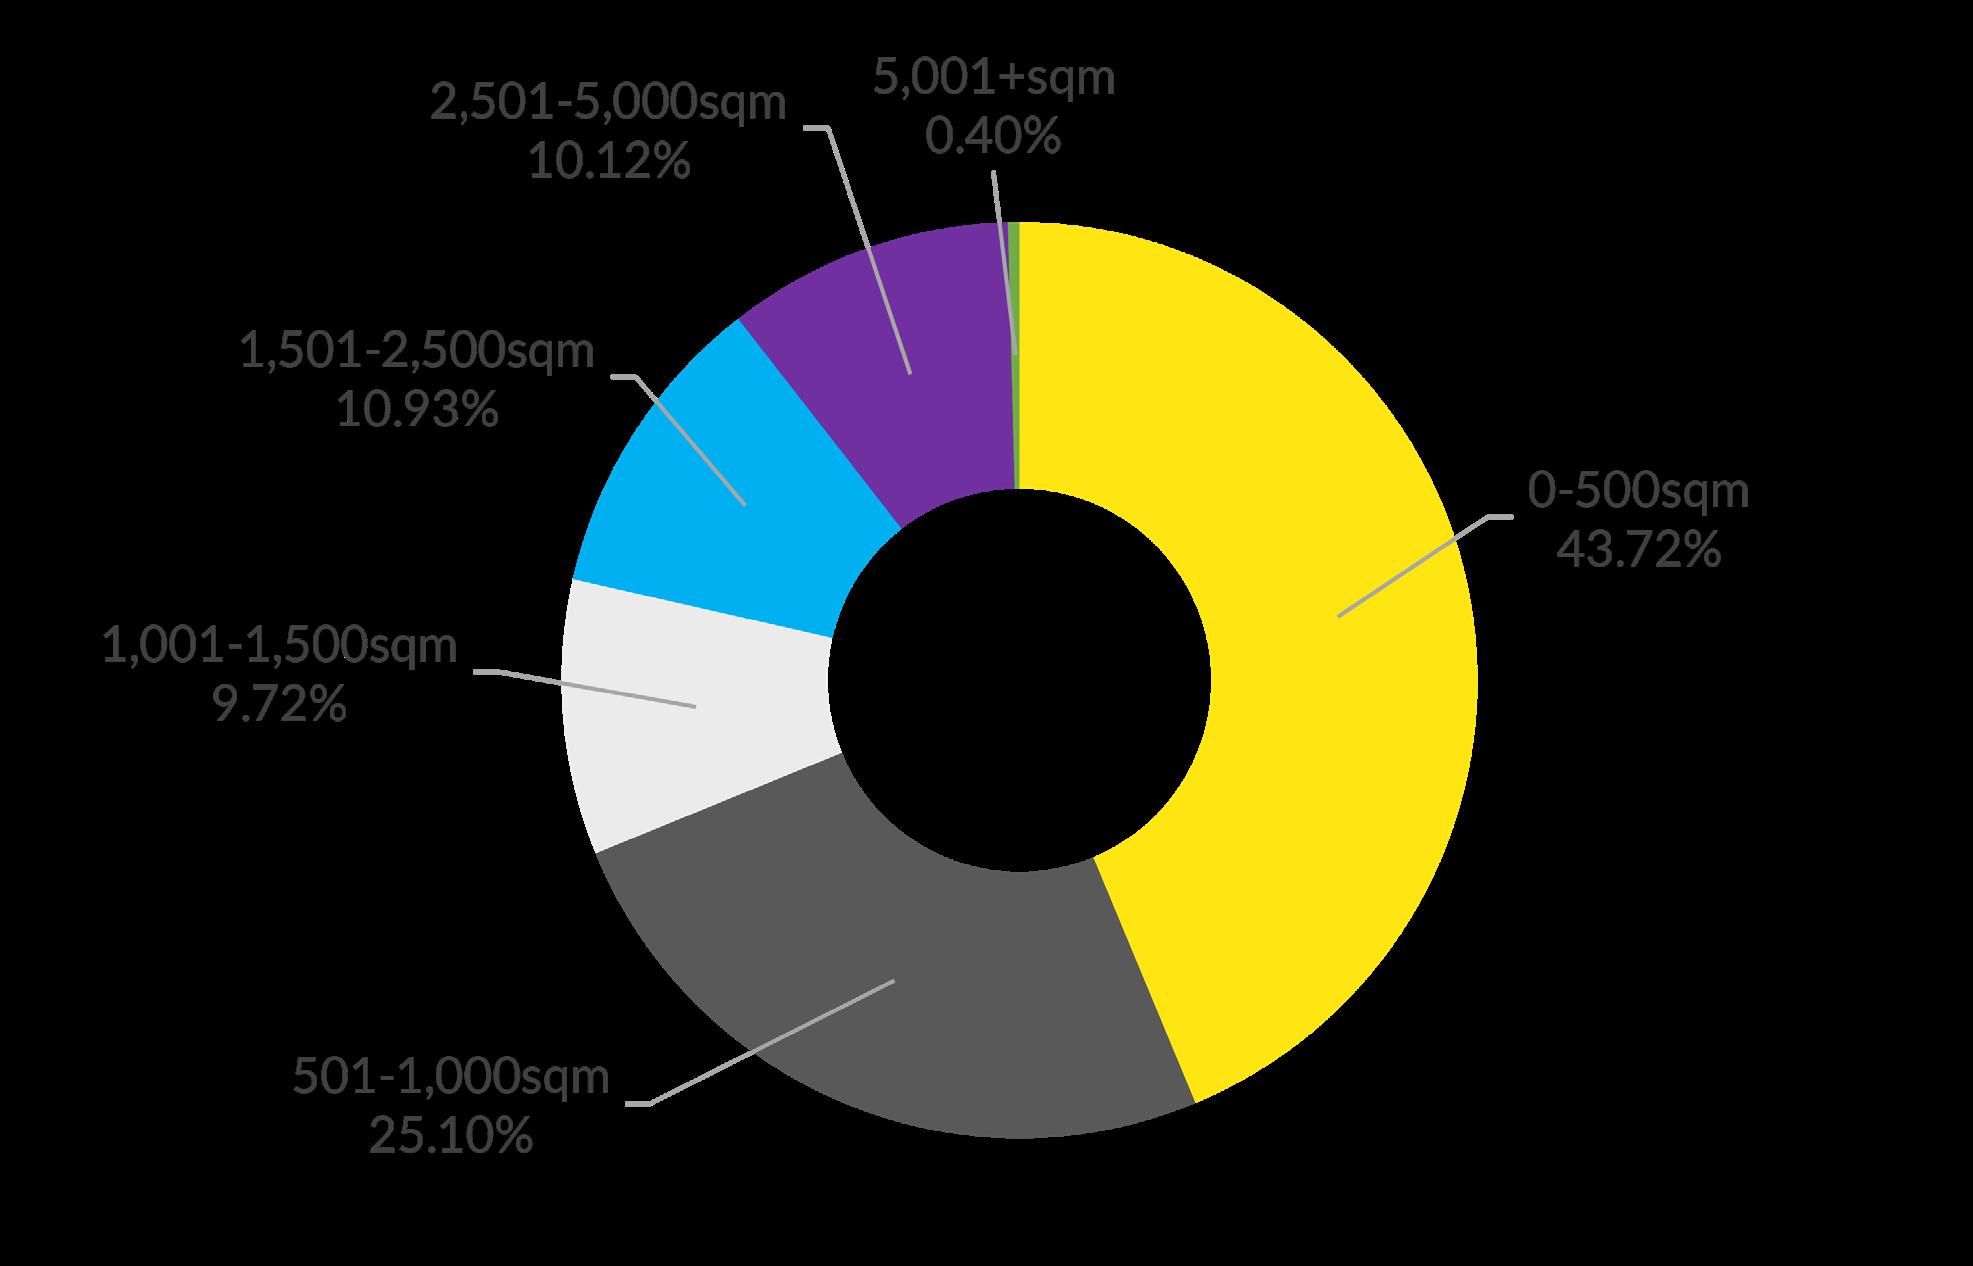
Perth Metropolitan vacancies by size range
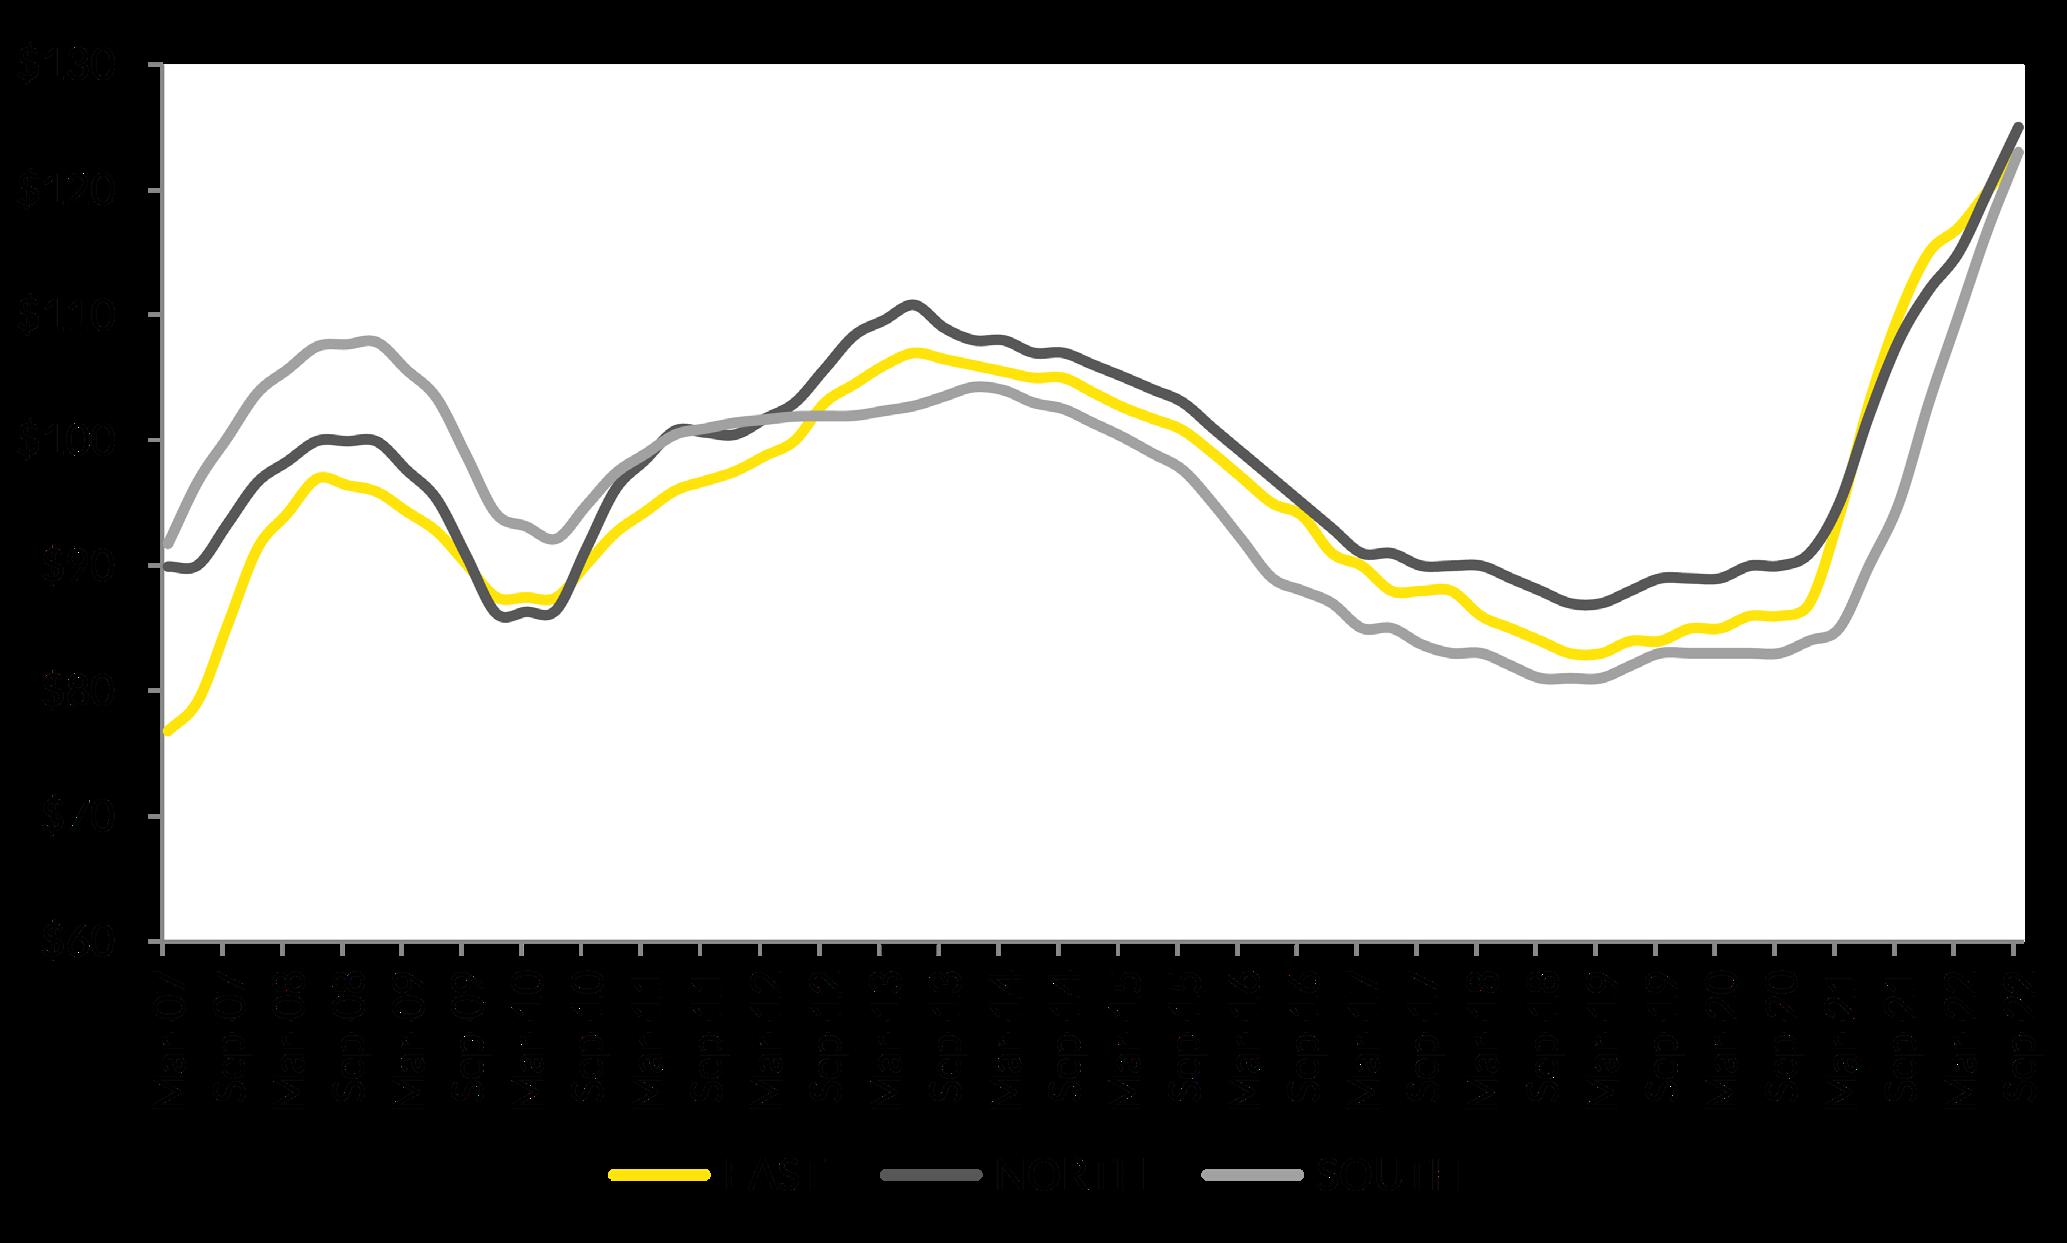
Perth Industrial Net Face Rents
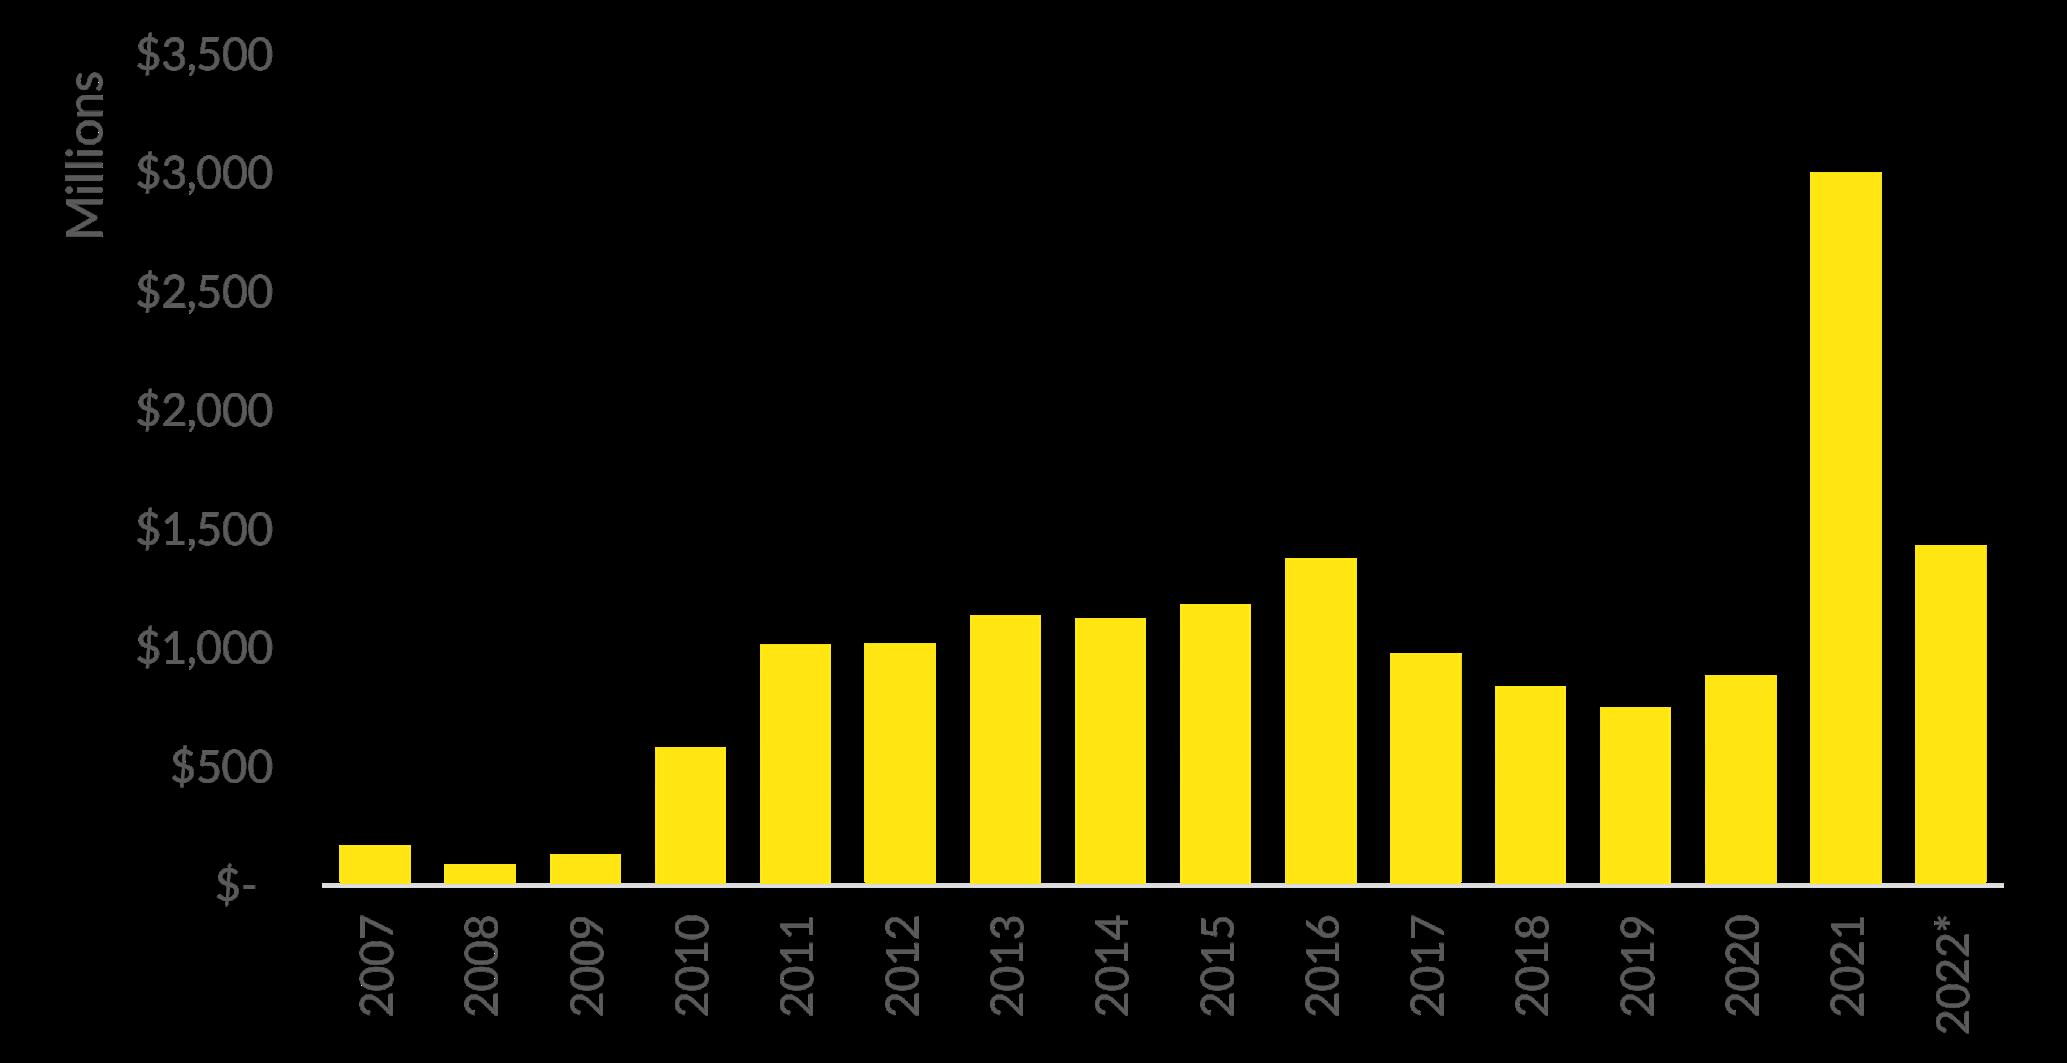
Perth Industrial Sales Turnover
After a strong start to 2022, consecutive interest rate rises have resulted in a slight lull in investment activity.
While volumes for the year continue to exceed those of years prior to 2021 buyers are becoming more considered with their investment decisions. By far the biggest driver in sales has been owner occupiers who are paying much higher prices than investors or developers can justify.
Rents continue to enjoy strong gains across all regions of Perth, spurred on by the low vacancy and limited new supply pipeline, prospects of continued growth appear likely albeit at a slightly slower pace. Demand to occupy stock remains with transport, logistic and distribution tenants needs continuing. Small manufacturing, local service and construction sectors are also healthy ensuring that incentives are kept absent from the marketplace.

The Perth industrial market is having similar supply issues to the rest of the country. With vacancy trending well below historic results and limited new speculative supply entering the market, we have entered an undersupply situation. In our recent survey of vacant stock across the Perth market, there is 252,161sqm of vacant stock available, this continues to be down from 367,150sqm six months ago and 690,854sqm recorded just 12 months ago.
The rapid take up of space continuing to occur due to a combination of demand from transport, logistic and distribution users together with the continued growth and uptick of small and emerging businesses particularly in the services and construction sectors. We are seeing business supply chain issues filter into demand for space in that businesses are leasing more space than normal to house a 6-12 month stock supply as opposed to a traditional 3 month supply.
Many businesses are bursting out of their current accommodation options and having to alter their working arrangements due to limited space. While speculative development is slow to get off the ground, several D & C opportunities are available for larger spaces notably in the East and South precincts. North continues to be home to the greatest available stock, albeit in the smaller size range, the 107 vacancies averaging 842sqm in size.
Vacancies have seen considerable reduction across the total market, historically there has been a high volume of vacancies in the over 1,000sqm which have enjoyed strong levels of take up over the last year. While close to 44% of all vacancies are in the sub 500sqm size range this year this large proportion has been unseen before, after recording just 23.08% just a year ago.
Assets in the 1,001-1,500sqm range contribute less than 10% of all listings after representing 16.78% 12 months ago, more remarkable the 5,001+sqm size range recorded 5% last year and now represents less than 1%. The growth in businesses highlighting this change in size requirements as many organisations have outgrown their small accommodation into larger facilities.
Across the larger end, there are limited opportunities fuelled by the uptick in the logistics and transport sectors, with users looking for these larger opportunities having limited choice. Alternatively, there are some D&C options available however requiring substantial construction costs lead time which will attract a premium cost for the end user.
It’s been a busy two years across the broader industrial market in Perth which has had a sizeable impact on the leasing market. Strong absorption of stock across all markets has been instrumental in rising face rents across all regions. The lack of stock has seen many tenants expand their location preference which has resulted in a convergence in average rents across the precincts. Fundamentals such as access, clearance, size and parking are key priorities for tenants and while tenants may consider moving to a secondary location or older style asset, these key requirements still need to be met.
The greatest net face rental growth over the last year has come from the South precinct, up 29.47% to $123/sqm, now in line with the East average which has grown 11.82% over the same time frame. North averaging $125/sqm has shown a 15.74% increase, over the last five years this market has enjoyed average annual increases of 7.78%. All markets have enjoyed robust levels of rental return growth over the past five years with East and South recording annual increases of 7.95% and 9.39% respectively.
 Source: Ray White Commercial (WA)
After an exceptional 2021 period in terms of transaction growth with over $3billion in turnover, 2022 has recorded some decline in volumes. During the first ten months of 2022, $1.43billion has changed hands which, other than 2021, remains more than previous annual highs. With ongoing interest rate increases this year, confidence has fallen across various investor groups resulting in a “wait and see” attitude towards investment. Private buyers continue to show confidence in particular owner occupiers who are looking for some accommodation certainty during this time of low vacancy. Assets which offer some upside or development potential, be it larger land parcels or expansion opportunities are still sought after by investors who can see the long-term potential of the industrial asset class. Strong future gains in rents ensures that demand for investment stock remains albeit at the right price. Yields for industrial assets have seen some revision and currently range upwards of 5.5-% after falling to as low as 4.00% last year for large institutional assets.
Source: Real Capital Analytics, PIMS, Ray White Commercial *to 31 October
As we move to the end of 2022, we have seen some re-rating of industrial assets. Consecutive interest rate rises and some uncertainty surrounding yields which have now decreased from the peak rate achieved earlier this year have seen some buyers be more considered in their investment decisions. Encouragingly however has been the strong gains in rents which are anticipated to continued albeit at a more moderate rate given the historic low vacancy environment. Limited new supply additions on the horizon and continued appetite to occupy stock will ensure that incentives remain limited and returns remain attractive in the short term.