THE INSIGHT
PERTH OFFICE
MARKET OVERVIEW
FEBRUARY 2023
Western Australia has been an outstanding performer when it comes to office market activity over the last year, second only to Queensland markets. For the CBD, Perth sits behind Brisbane for annual net absorption for the 2022 calendar year at 19,388sqm moving further ahead of the trophy office markets of Sydney or Melbourne CBD. This continued level of take up has been across the city and size ranges with demand coming from a mix of professional and technology services both for new and growing businesses. Perth’s rigid border controls has allowed the office markets to continue working at full force with lockdowns and working from home not featured as prominently as the East Coast.
Still, we are seeing other markets grapple with getting their staff back into physical office space, many changing their workplace environment and allowing hybrid models for the short to medium term impacting the vibrancy and longevity of their office markets. However, the Perth market and its robust economy continue to grow, resulting in an unemployment rate of just 3.5%, the lowest rate on record for well over ten years. West Perth has also seen a push by smaller businesses with positive take up also recorded, again one of the top 3 nationally for demand behind the much larger Brisbane Fringe and Parramatta office markets.
While vacancy has recorded a prolonged high for the CBD with expectation of this continuing given the supply pipeline, West Perth has shown encouraging results. Both markets have seen improvements across the rental market given the strong inflationary pressures with existing tenancies faced with high CPI increases in their accommodation costs. Despite these increases to face rents there has been little change in effective rents as incentives remain a significant feature notably in the CBD market.
For the investment market, the strong increases in interest rates hasn't done much to dampen urgency in the marketplace. Yields have seen upward movement given this cost of finance however many investor groups continue to look towards Perth to capitalise on attractive yields compared to other East Coast options particularly given the markets strong income growth potential. Domestic funds and private investor groups are expected to seek out opportunities both in the CBD and West Perth.
Demand from owner occupiers for mid tier asset classes has featured strong demand particularly in West Perth and fringe CBD locations as buyers capitalise on relatively low interest rate from historical standards.
PERTH CBD OFFICE MARKET
Over 82% of all lease listings are for office stock in the sub 1,000sqm size range

PERTH OFFICE VACANCY & MARKET OVERVIEW 3
Six-month net absorption 6,086sqm Vacancy Premium 6.6% D Grade 13.3% Total Vacancy 15.6% Grade 16.5% C Grade 20.9% B Grade 16.7% A Six-month net supply 3,463sqm Future supply completions (12 months) Refurbishment 20,307sqm New Stock 77,500sqm Sub-lease vacancy 0.6% Average incentives range between 40% to 50% Net Face Rents Prime Secondary $616/m2 $509/m2
Investment Yield Prime Secondary 7.25% 8.17%
Source: Property Council of Australia, Ray White Commercial
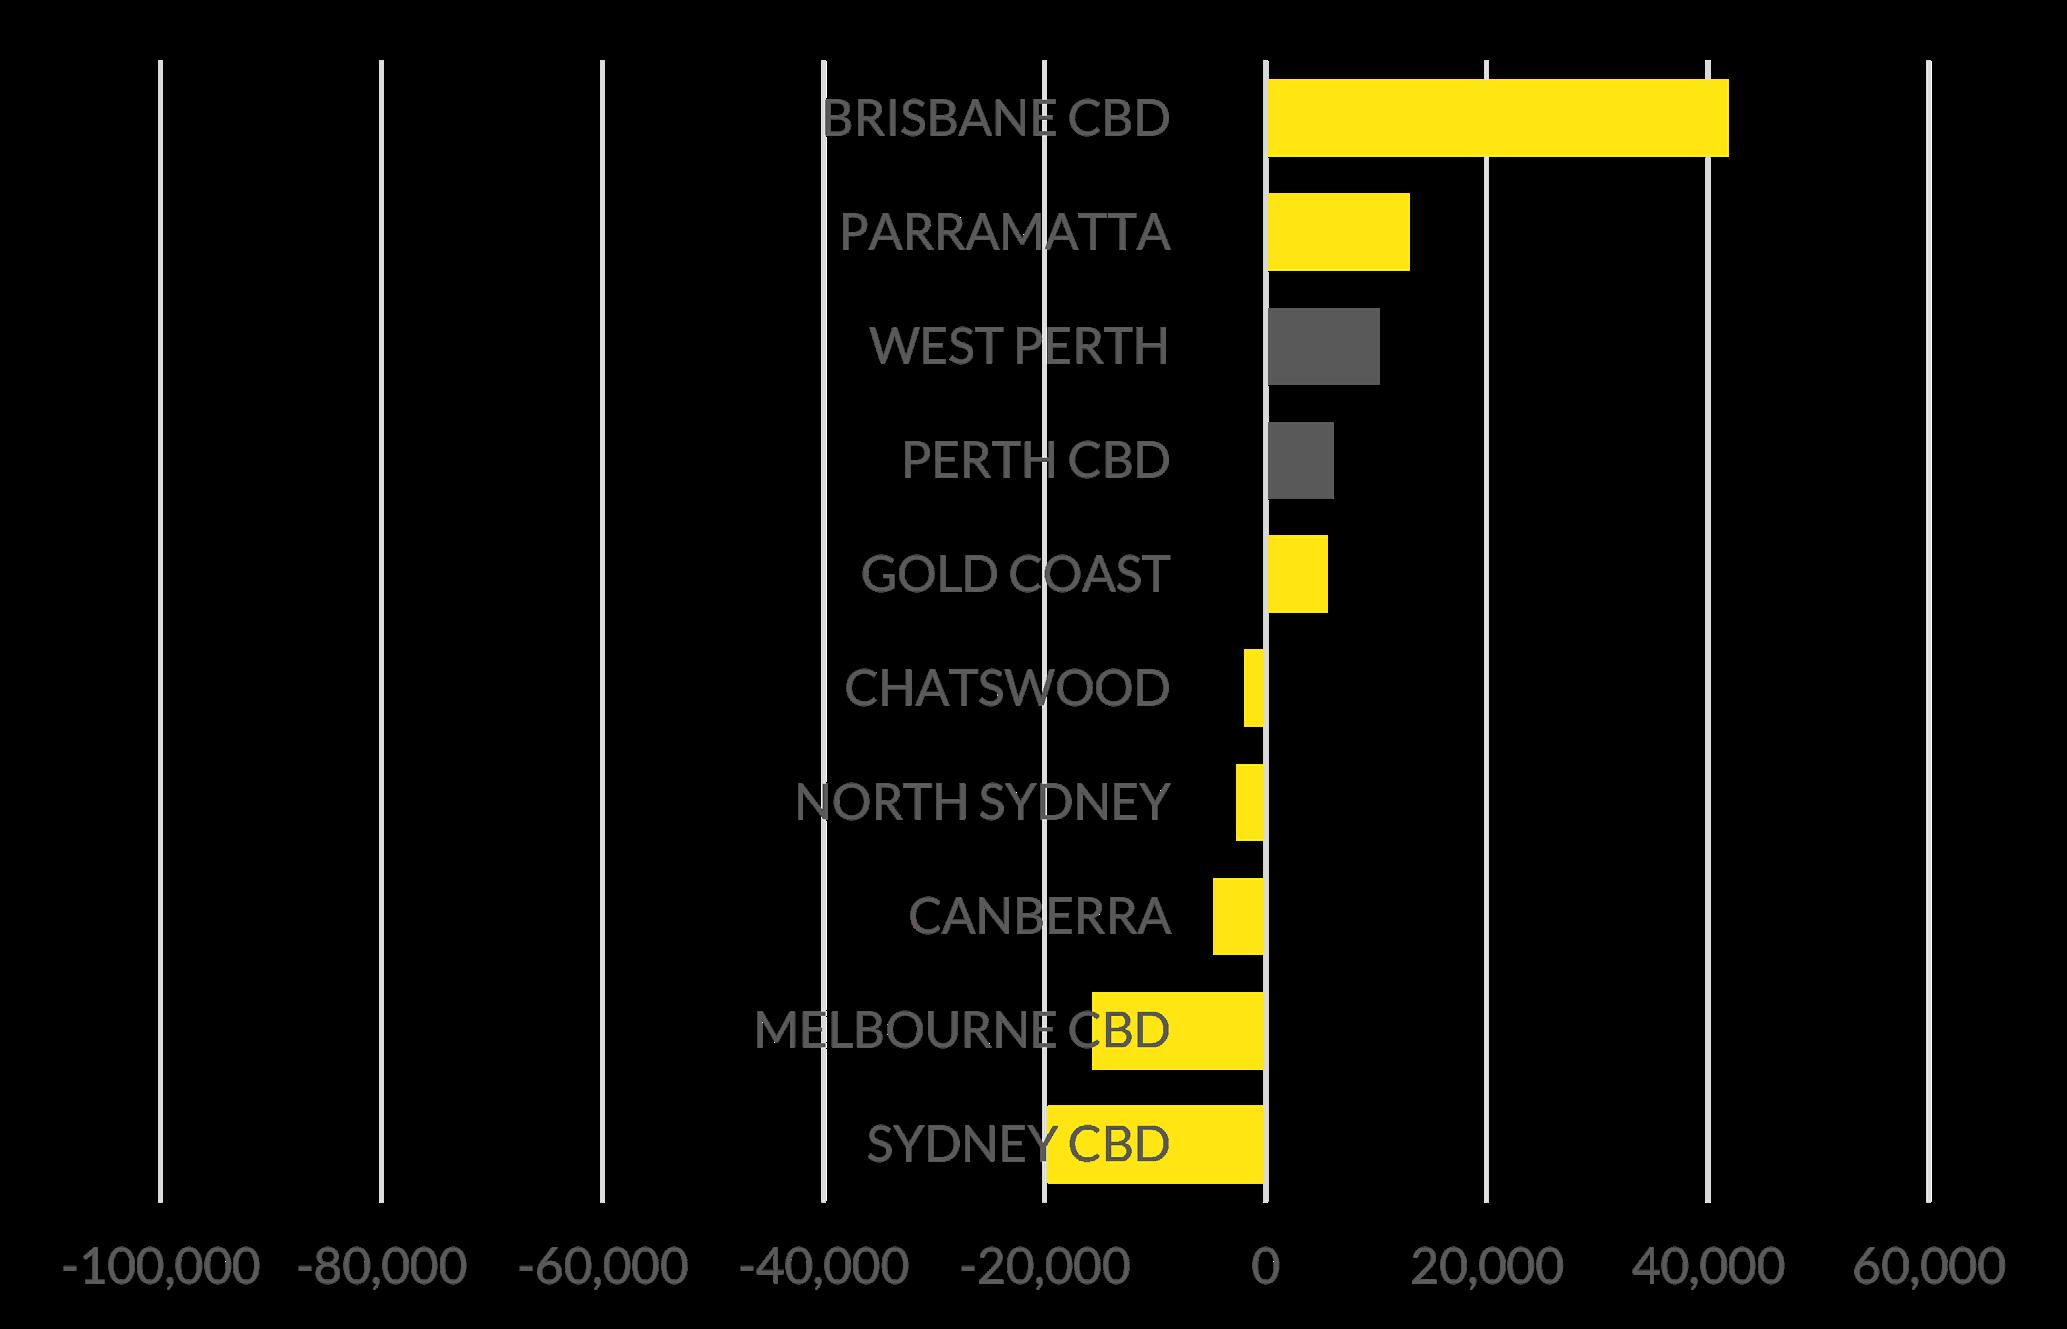
AUSTRALIAN CBD AND NON-CBD MARKETS
6-MONTHLY NET ABSORPTION BY CITY
The Australian office markets continue to record mixed results into the post COVID-19 economy. A reduction in space requirements for some businesses coupled with organisations adopting hybrid working models in a time where work from home remains popular all putting pressure on office occupancy. Some markets have been hit harder than others with Sydney and Melbourne impacted more heavily by working from home resulting in limited absorption of space. Whereas Queensland and WA markets continue to enjoy higher levels of take up improving the vacancy position of both CBD and metropolitan markets as a result of their boyant economies.
For CBD markets, Brisbane enjoyed the greatest take up of space followed by Parramatta then Perth, despite supply additions and in the non-CBD markets, West Perth also ranked third behind Brisbane Fringe and Parramatta in terms of take up. Highlighting how these high population states are leading the charge in office recovery.
RAY WHITE COMMERCIAL (WA) 4
Source: Property Council of Australia
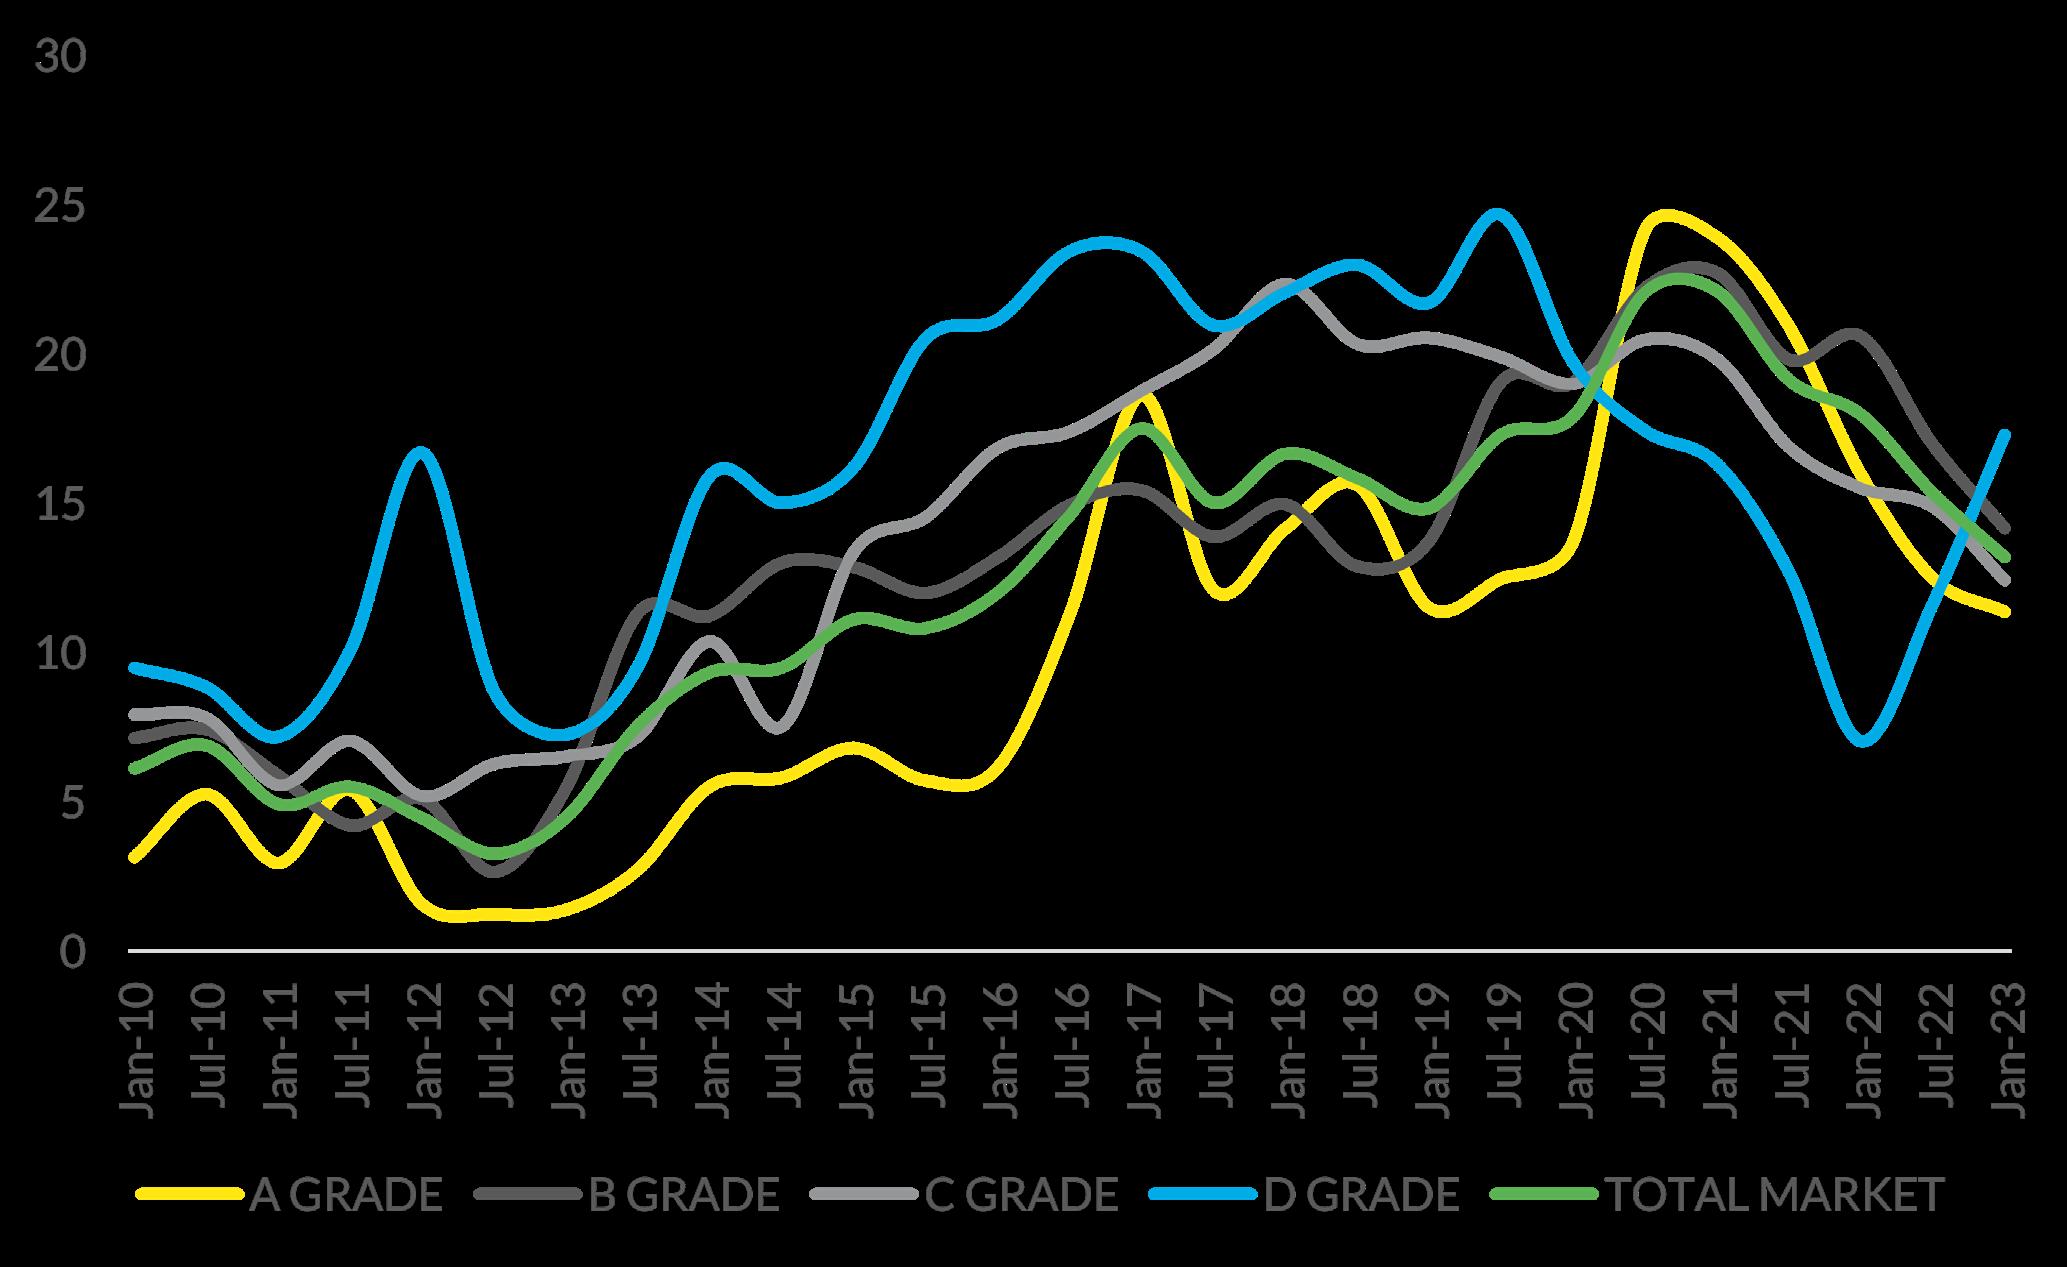
PERTH CBD OFFICE
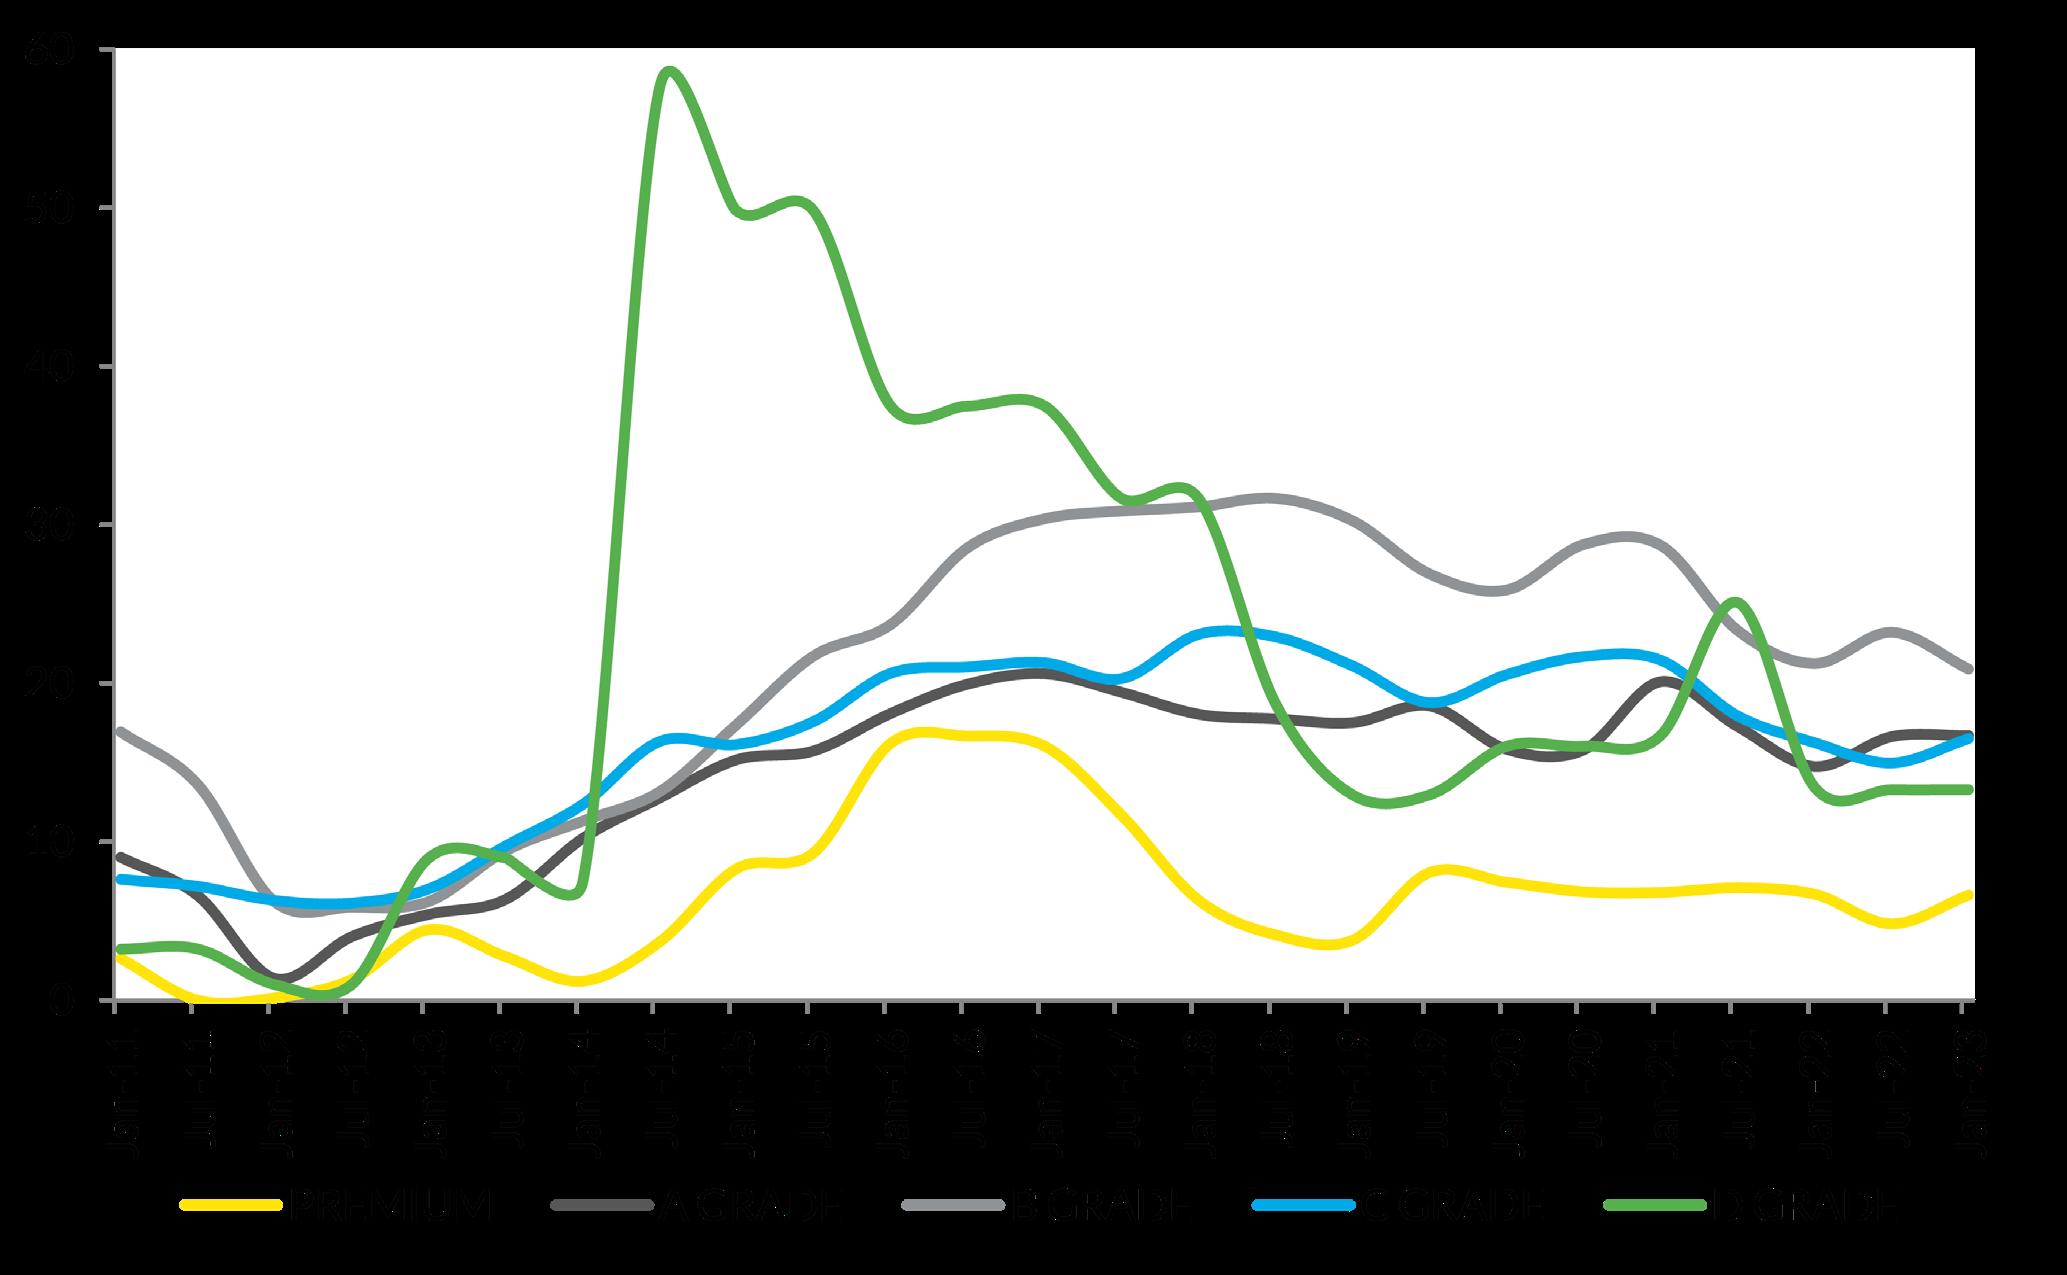
VACANCY BY QUALITY GRADE (%)
Some mixed results this period across the Perth CBD market. Tenant enquiry has been elevated during this time of high vacancy as businesses look to either renew, relocate or expand taking advantage of the high incentive environment. Net supply additions across Premium and A grade stock this period resulting in some increase to Premium vacancies to 6.6% while A grade remained stable at 16.7%. Net withdrawals of 10,325m 2 , predominantly consisting of 306 Murray Street and 186 & 190 St Georges Terrace, has aided the high vacancies in B grade assets now 20.9% however the flight to quality has seen C grade rise to 16.5% and D grade at 13.3%. With approximately100,000sqm of new stock destined to enter the market over the next 12 months with only half of which committed, the vacancy profile for the prime quality grades are expected to further be tested. Post this period some reprieve in the supply cycle will allow the Perth CBD market to play catch up reducing total vacancy levels below their current rate of 15.6%.
PERTH OFFICE VACANCY & MARKET OVERVIEW 5
Source: Property Council of Australia
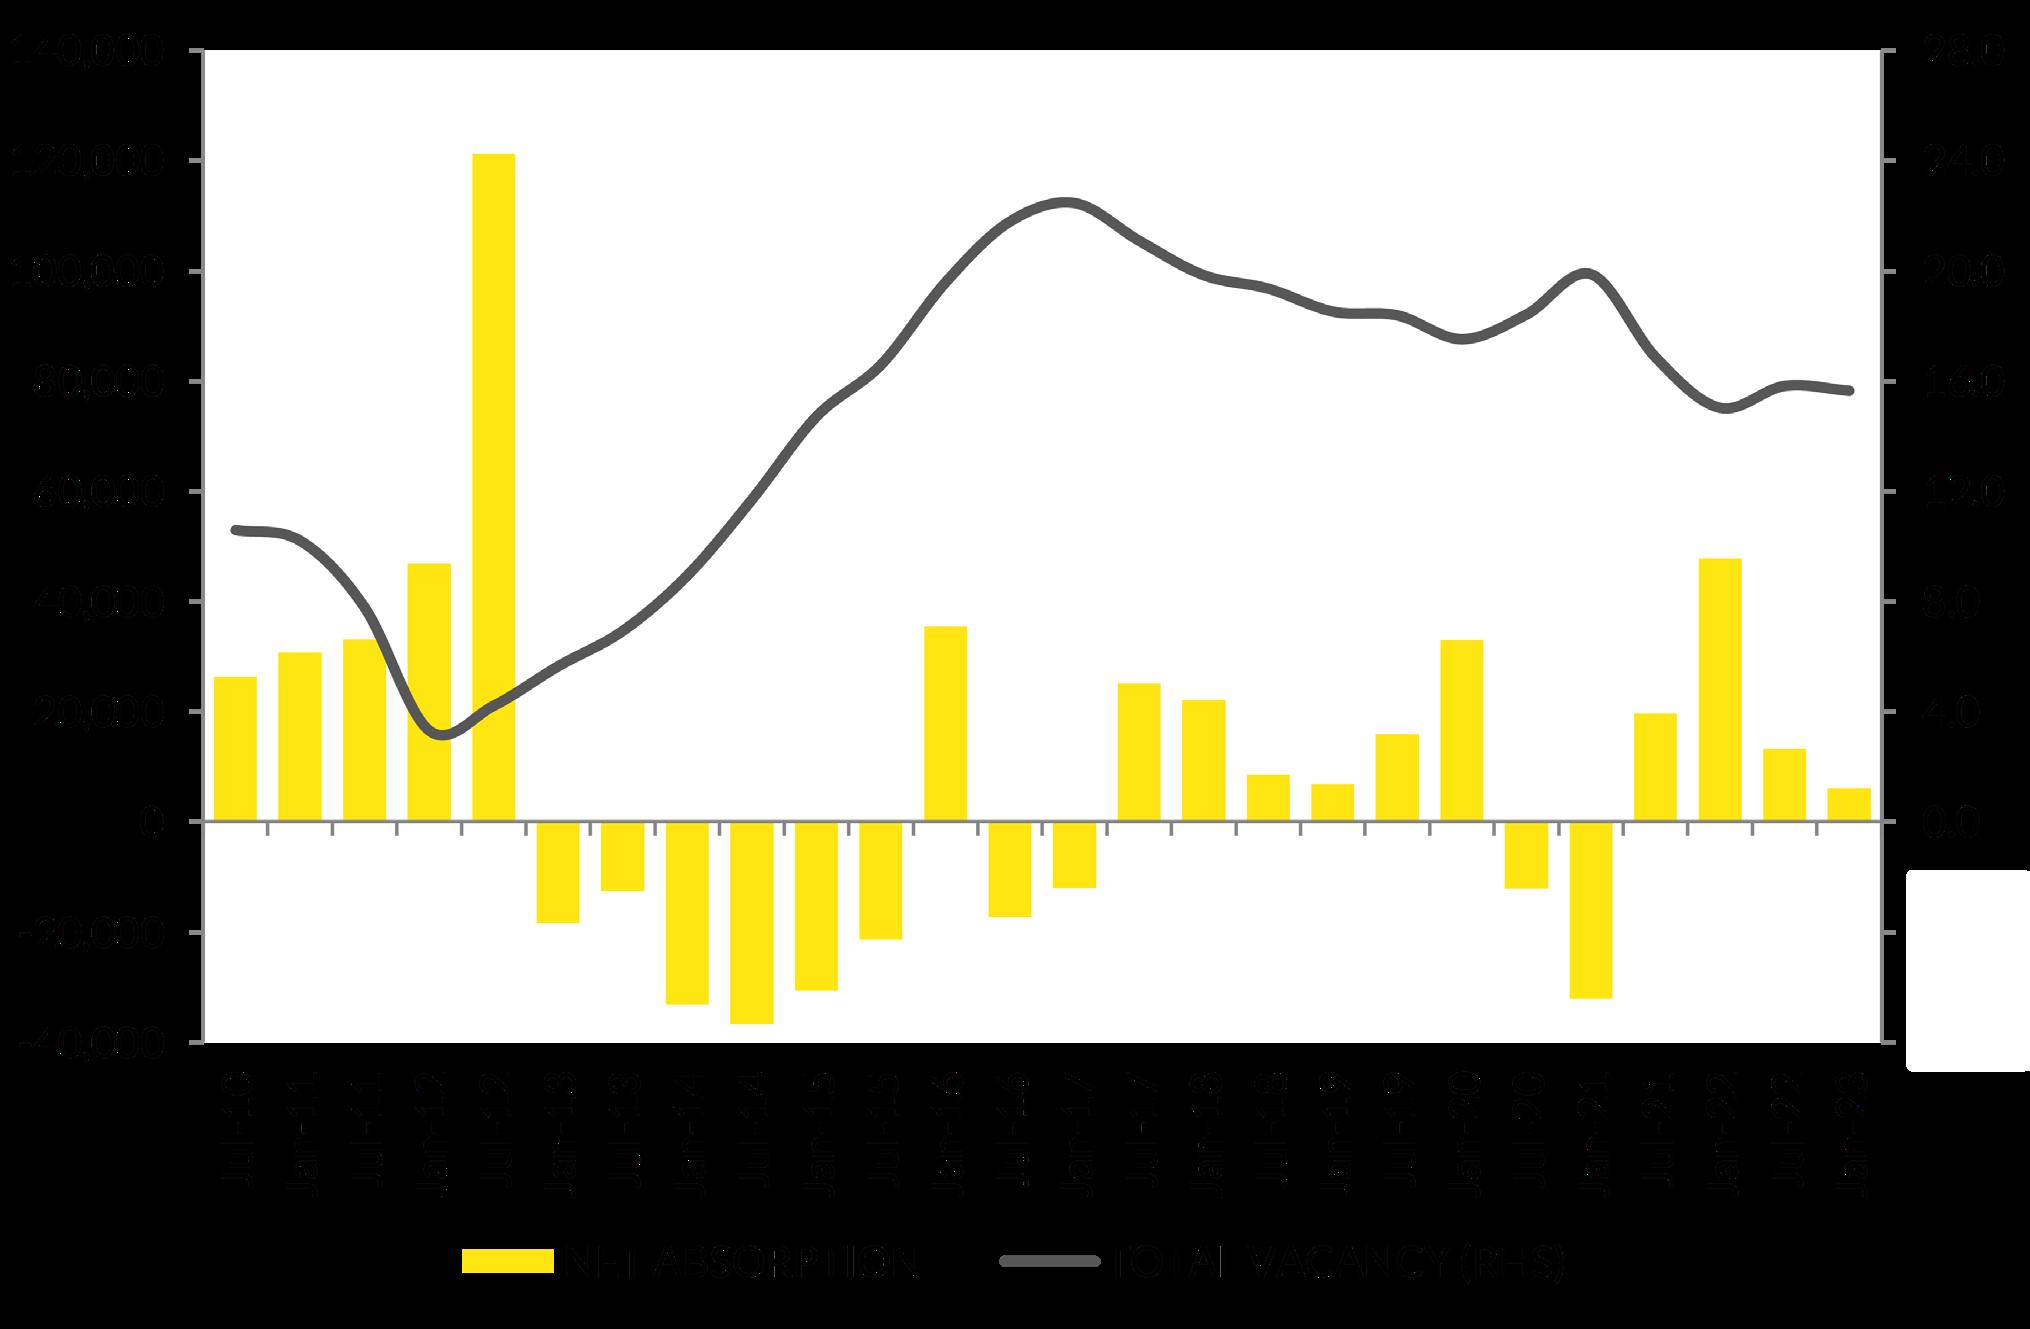
PERTH CBD OFFICE
NET ABSORPTION & TOTAL VACANCY (%)
Unlike many other office markets around the country, Perth CBD has enjoyed consecutive periods of net absorption. Over the six month period to January 2023, 6,086sqm has been taken up albeit over the year this was 19,388sqm; the second highest annual rate of CBDs across the country. This period however, competition from West Perth and their affordable offerings has competed with the CBD while existing tenancies have sought out limited additional expansion space as some staff remain working from home. While these hybrid working models are far fewer than east coast markets, there has still been some reluctance to take up additional space in this current environment.
Vacancies have reacted accordingly, and this period only recorded a small decline to 15.6%, this representing vacant stock of 282,691sqm. Sub-lease vacancies have also increased to 0.6% however remains well behind the highs achieved during the COVID period in excess of 1%. With uncommitted supply expected to be added to the market over the next year, vacancy levels are expected to increase and remain high in the short to medium term.
RAY WHITE COMMERCIAL (WA) 6
Source: Property Council of Australia
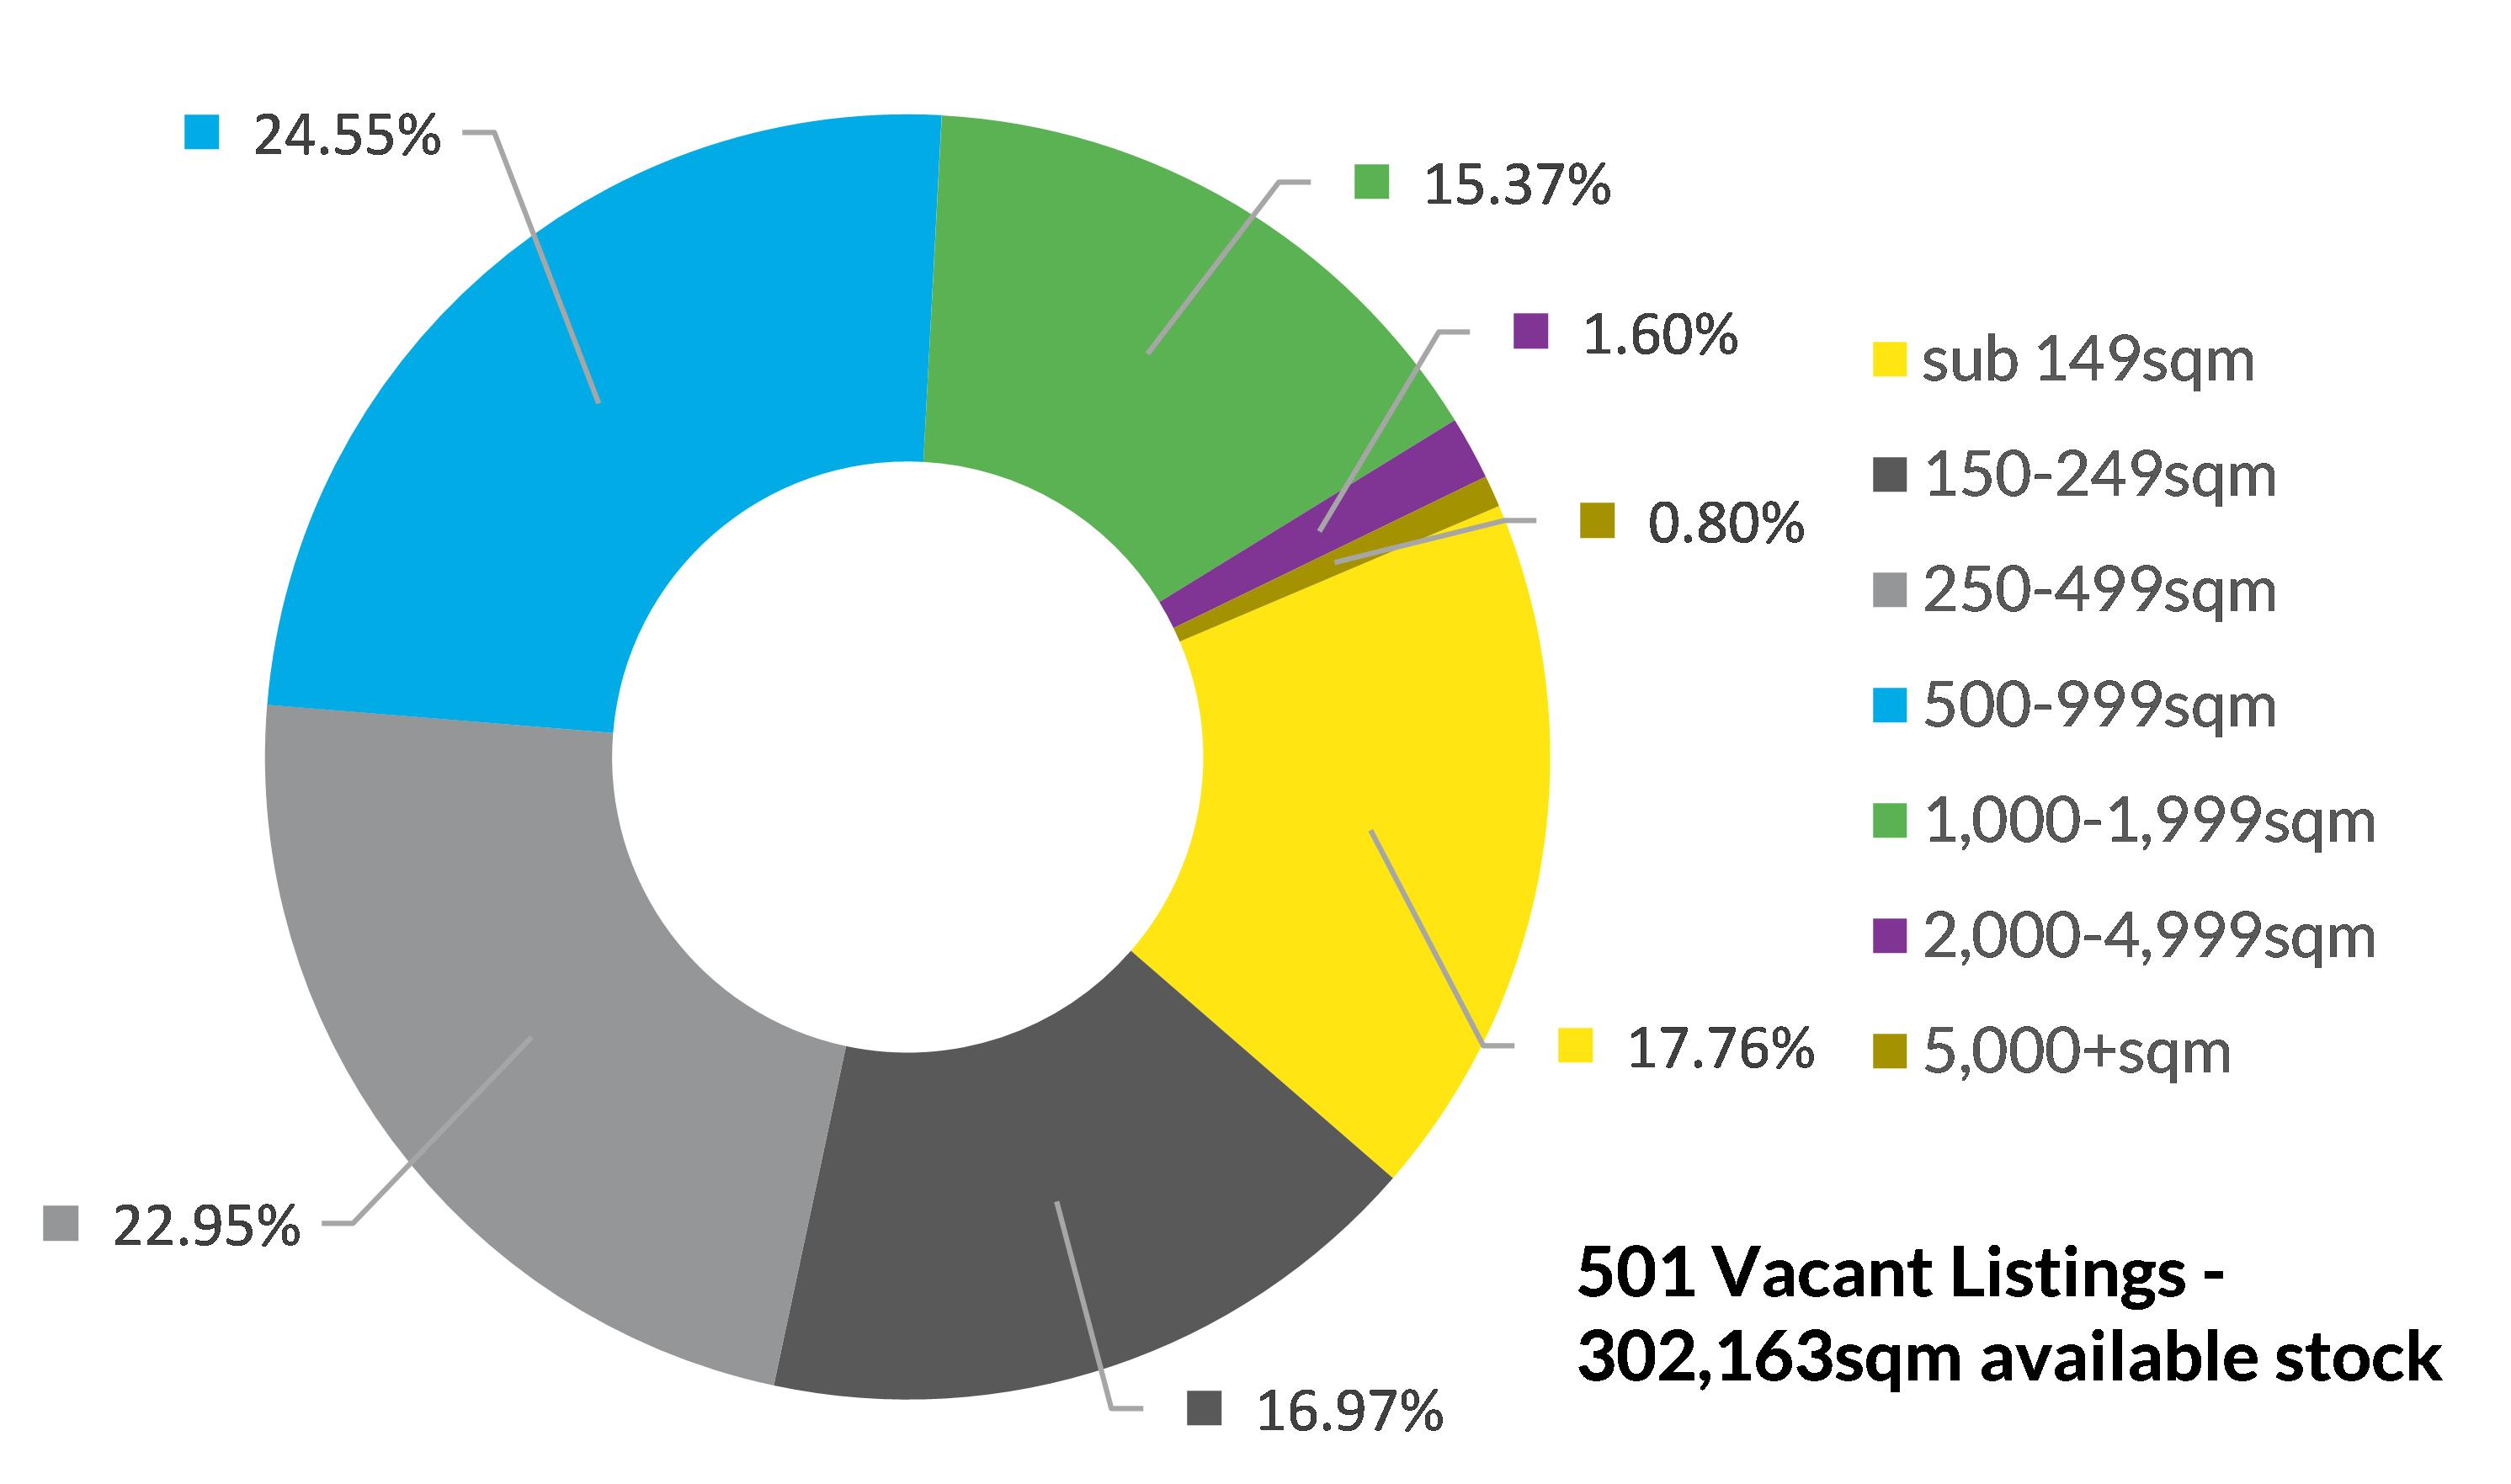
PERTH CBD OFFICE
VACANCIES BY SIZE RANGE, NO. LISTINGS
Ray White Commercial continues to undertake a study to understand the volume and type of vacant office listings across the Perth CBD. This period we have recorded 501 unique vacancies which is down from last year; this represents 302,163sqm of stock, while this is ahead of the Property Council numbers this includes smaller assets which may otherwise not be included in the vacancy count. Smaller holdings, sub 250sqm continue to decline , this period representing approximately 35% down from nearly 50% two years ago. The majority of stock remains in the 250-1,000sqm size range which has been consistent over the last year, however we have seen an increase in the 1,000-1,999sqm size range as churn and movement across the CBD has occurred from existing tenants.
PERTH OFFICE VACANCY & MARKET OVERVIEW 7
Source: Property Council of Australia
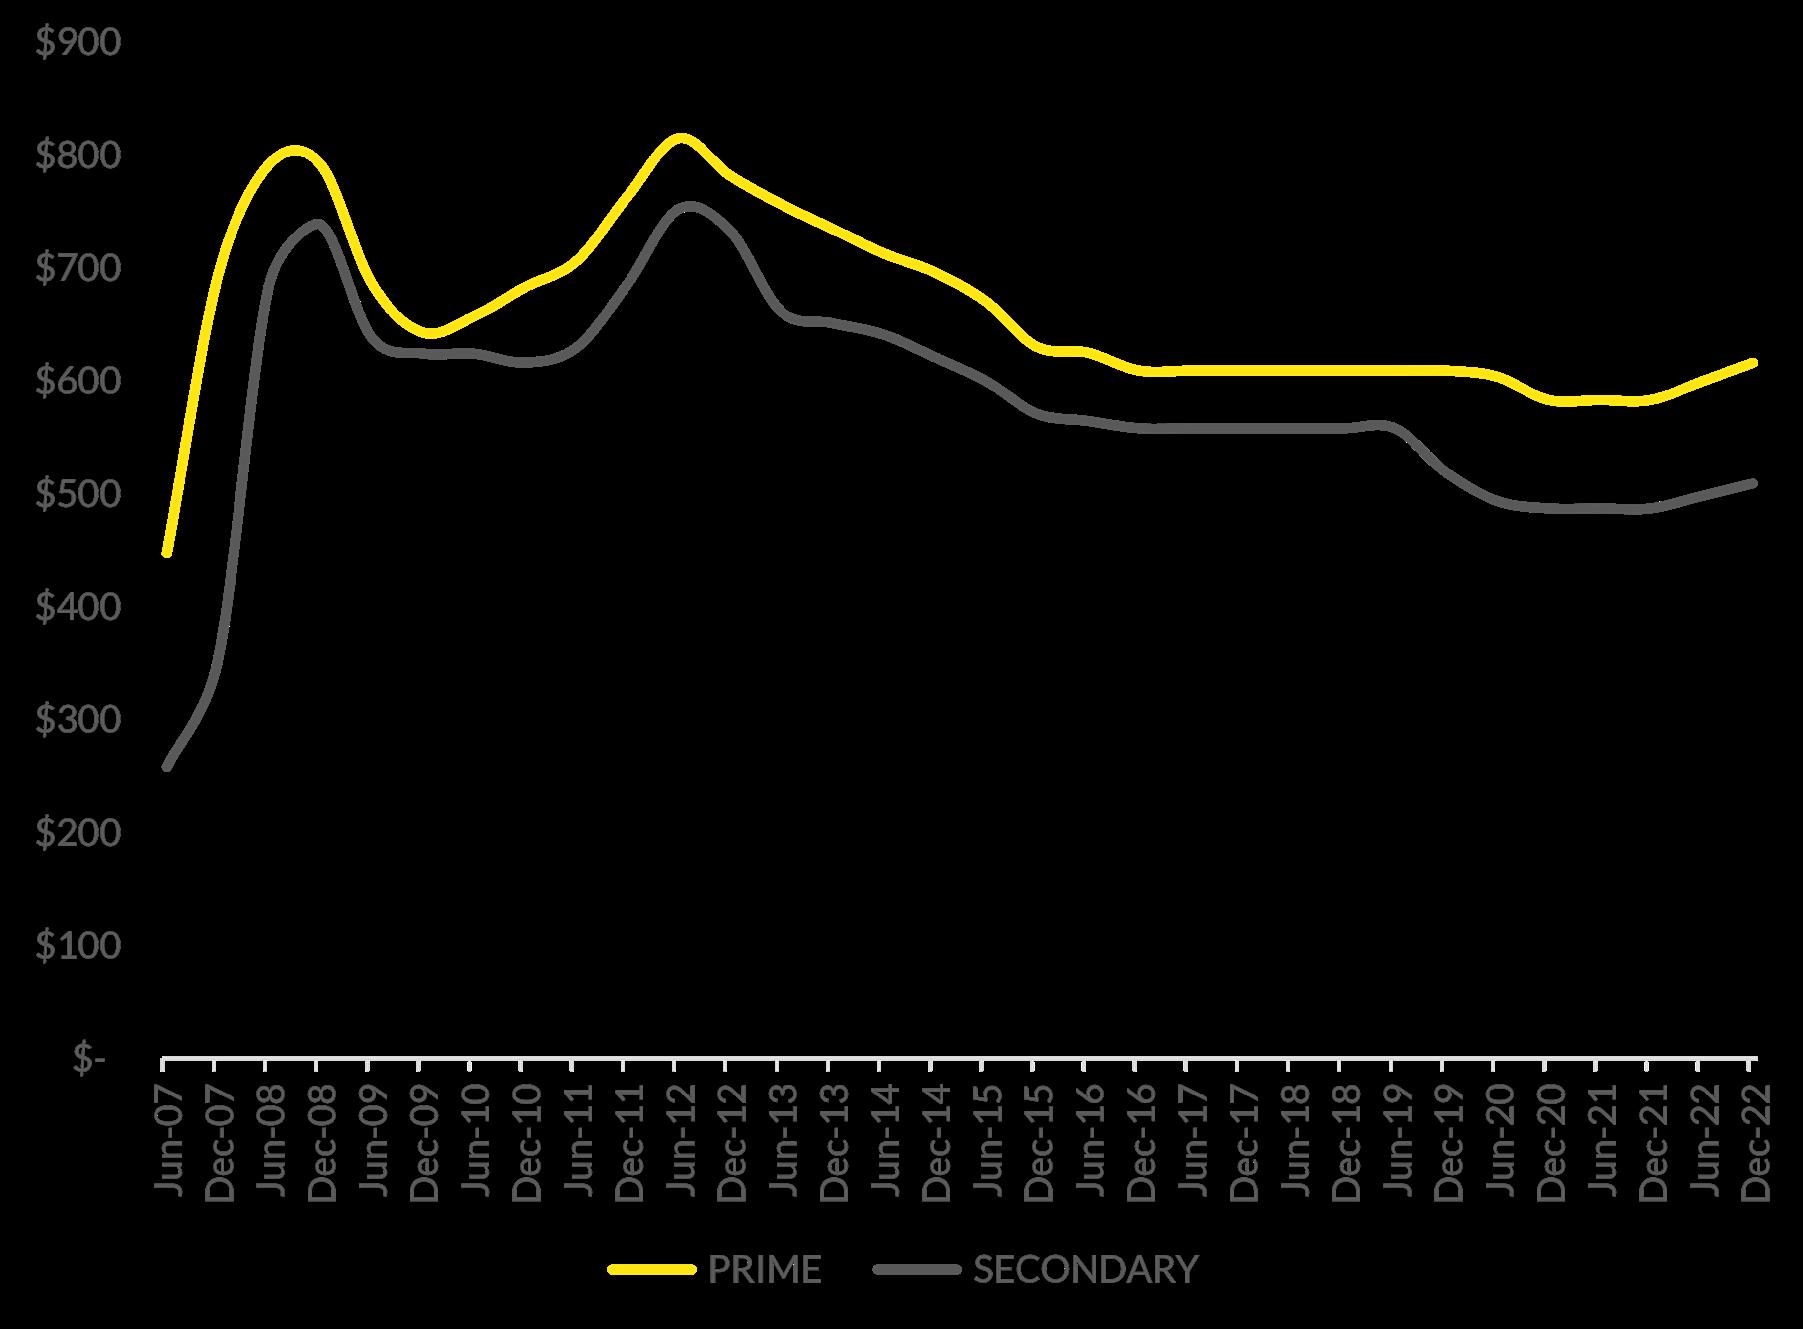
PERTH CBD OFFICE
NET FACE RENTS ($/SQM)
The Perth CBD office market is starting to show some uplift after a prolonged period of stability or reduction. While absorption has been limited and vacancies have remained high and likely to do so in the short term due to supply additions, the high inflationary environment has impacted rental rates. Tenants which had CPI increases inbuilt into their lease agreements are now seeing strong increases in rents of up to 7% which in turn has impacted the broader market when looking to relocate. Furthermore the increase in construction costs has resulted in new levels of face rent needing to be achieved for the viability of new stock, or to achieve effective rental building benchmarks. Incentives remain at a high rate keeping effective rent movements limited.
Average prime net face rents have grown over the past year to $566/sqm within the broad range of $495-$750/sqm, this up 5.66% over 12 months. We continue to see tenants lured into prime assets with high incentives on offer, however secondary rents also saw an uptick of 4.52% over the year to average $509/sqm.
RAY WHITE COMMERCIAL (WA) 8
Source: Property Council of Australia
PERTH CBD & WEST PERTH INVESTMENT YIELDS
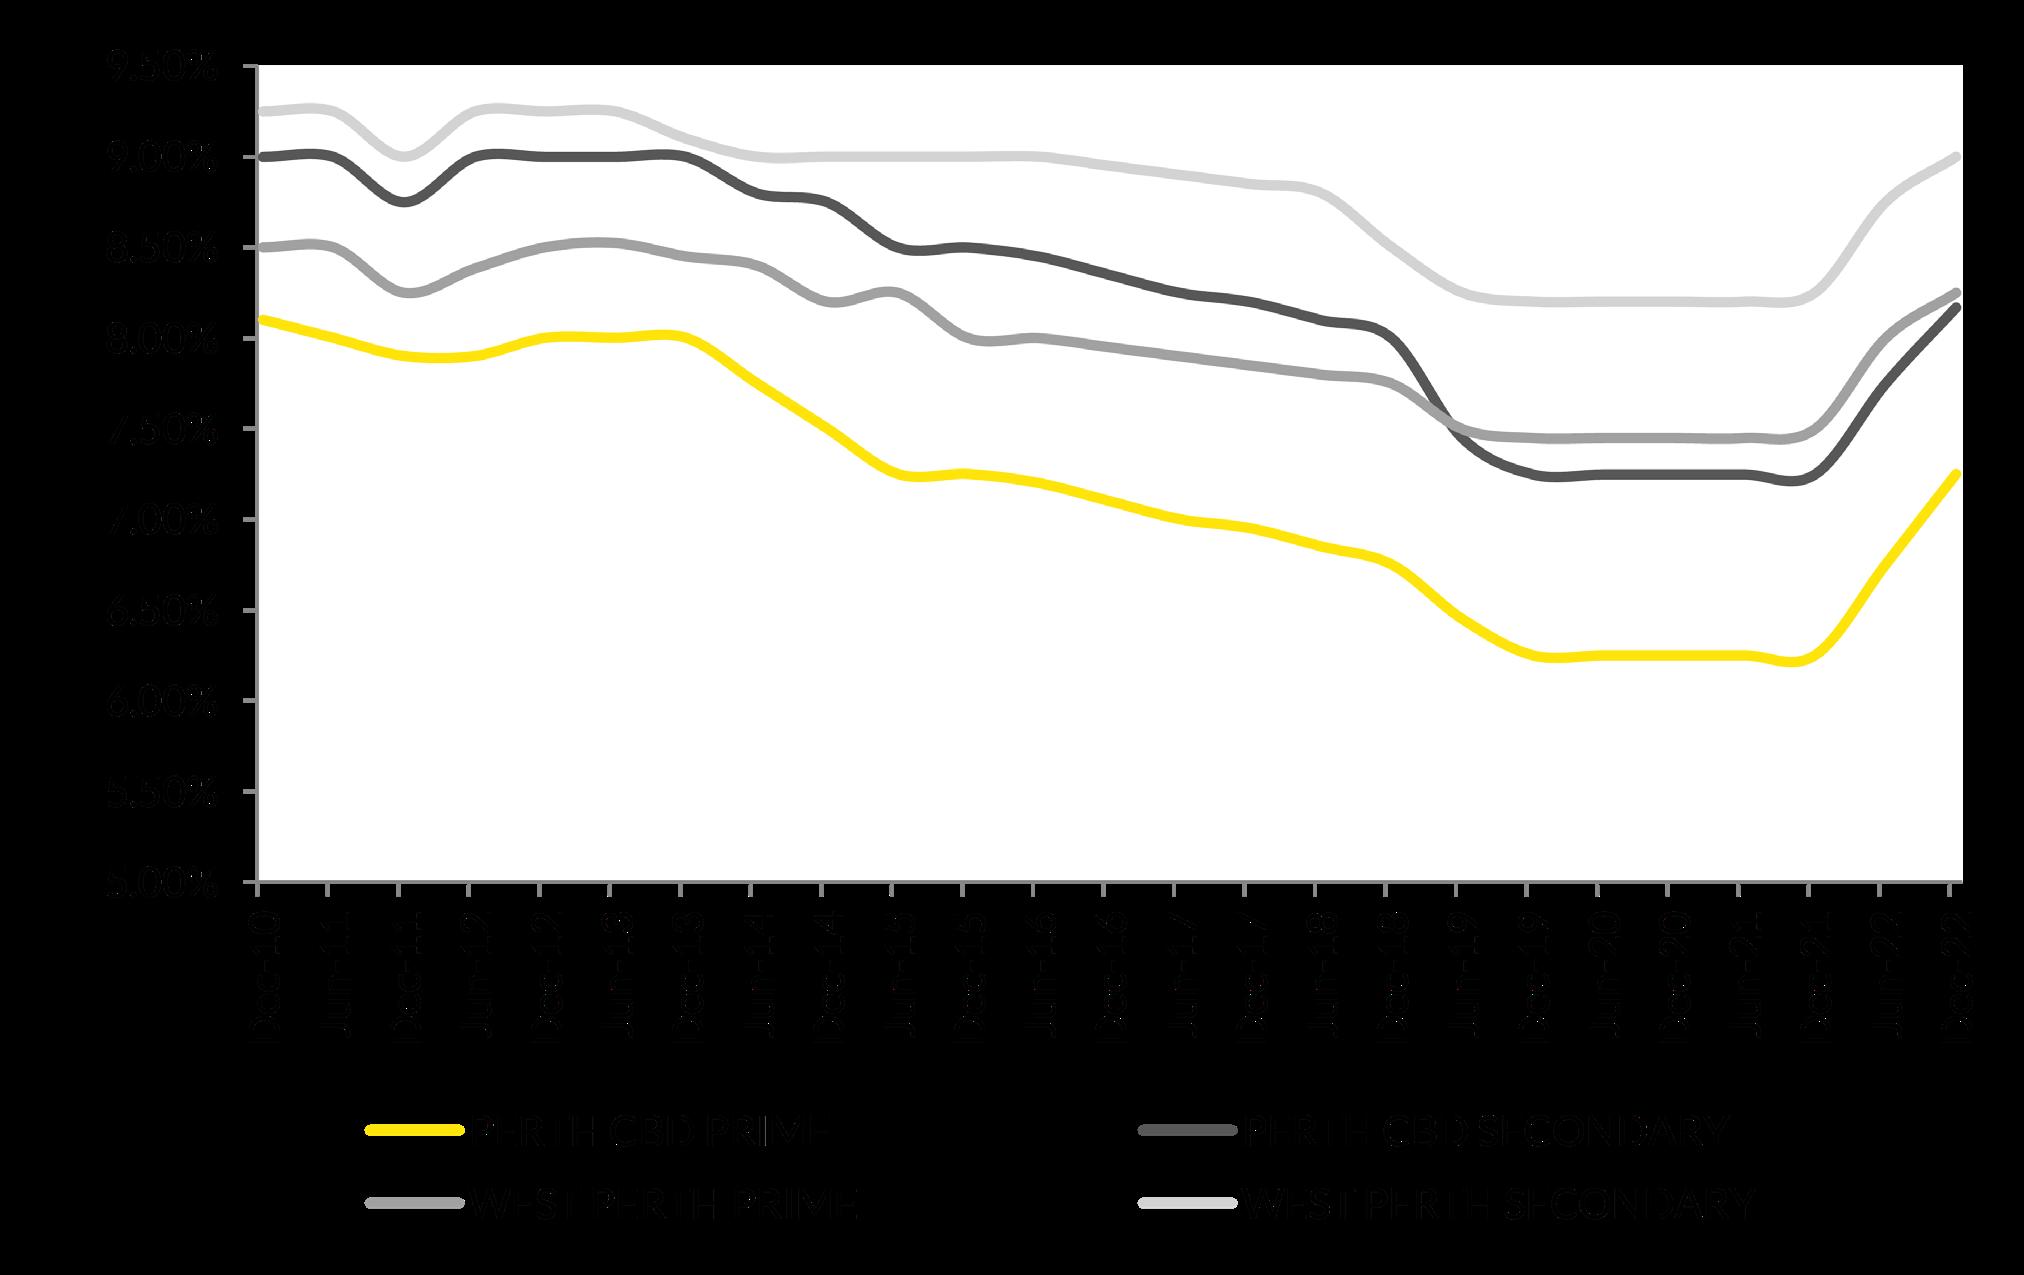 BY QUALITY GRADE
2022 saw a number of landmark Perth CBD sales occur, despite the changing market fundamentals and growing interest rates, the weight of funds continues to look towards landmark, trophy style CBD assets notably by local funds and listed trusts. Investment yields have reacted to these changing conditions growing close to 100 basis points upwards in both CBD and West Perth locations. One of the larger sales in 2022 being BankWest Tower for close to $339,750,000 to Lendlease JV with local investment manager Realside on a yield of 7.03%; on slightly higher yield was the sale of Allendale Square to Sydney investors Centuria Capital JV MA Financial Group for $223million.
Across West Perth, private buyers continue to look to secure freehold assets at the right price. Average yields now ranging from 8.25% to 9.00% between prime and secondary with recent sales including 3 Ord Street for $12.6million and 31 Outram Street for $16.5million. The sub $20million price point attractive to cash rich buyers, private families, trusts, syndicates and selfmanaged super funds looking to purchase and take advantage of rental growth opportunities on elevated yields.
PERTH OFFICE VACANCY & MARKET OVERVIEW 9
Source: Property Council of Australia
WEST PERTH
The West Perth office market has been one of the standout performers across the country. Showcasing quality results in terms of take up compared to other non-CBD markets in Australia, with strong absorption comes reductions in vacancies which trends below the average for non-CBD markets at a high 15.1% as well as below the overall Australian average which currently sits at 13.3%. Demand for quality, affordable space with access to parking facilities a key for this region which in the past has been hampered by its competitively priced CBD neighbour.
WEST PERTH OFFICE MARKET
Sub-lease vacancy 0.2%
Grade 14.2% B
Grade 12.4% C
West Perth Vacancy Total Vacancy 13.2%
Grade 11.4% A D Grade 17.3%
76.15% of all Lease listings are sub 500sqm
Net absorption 10,239sqm • Net supply 1,536sqm
Take up levels across West Perth eclipse Perth CBD levels.
Net Face Rents
Average incentives range from 30-40%
Source: Property Council of Australia, Ray White Commercial
RAY WHITE COMMERCIAL (WA) 10
Prime Secondary $345/m2 $255/m2
WEST PERTH OFFICE
VACANCY BY QUALITY GRADE (%)
The West Perth market has gone through a renaissance over the past few years, recording continual reduction in vacancies for quality assets. A grade continues to show the lowest vacancy at 11.4%, while the largest contributor of space: B grade now down to 14.2% after trending above 20% just 12 months ago. C grade also has shown quality results down to 12.4% while D grade which is a small segment of the market has seen a sharp increase to 17.3% highlighting the move to quality accommodation options during this point in the market cycle. Overall, the 13.2% vacancy rate puts West Perth in the top 10 lowest vacancy markets across the country. Aiding these quality results is the changing nature of the precinct with quality stock coming into a market however the expectation that more stock is likely to be withdrawn from the market than added into the future with no new projects on the horizon.
PERTH OFFICE VACANCY & MARKET OVERVIEW 11
Source: Property Council of Australia
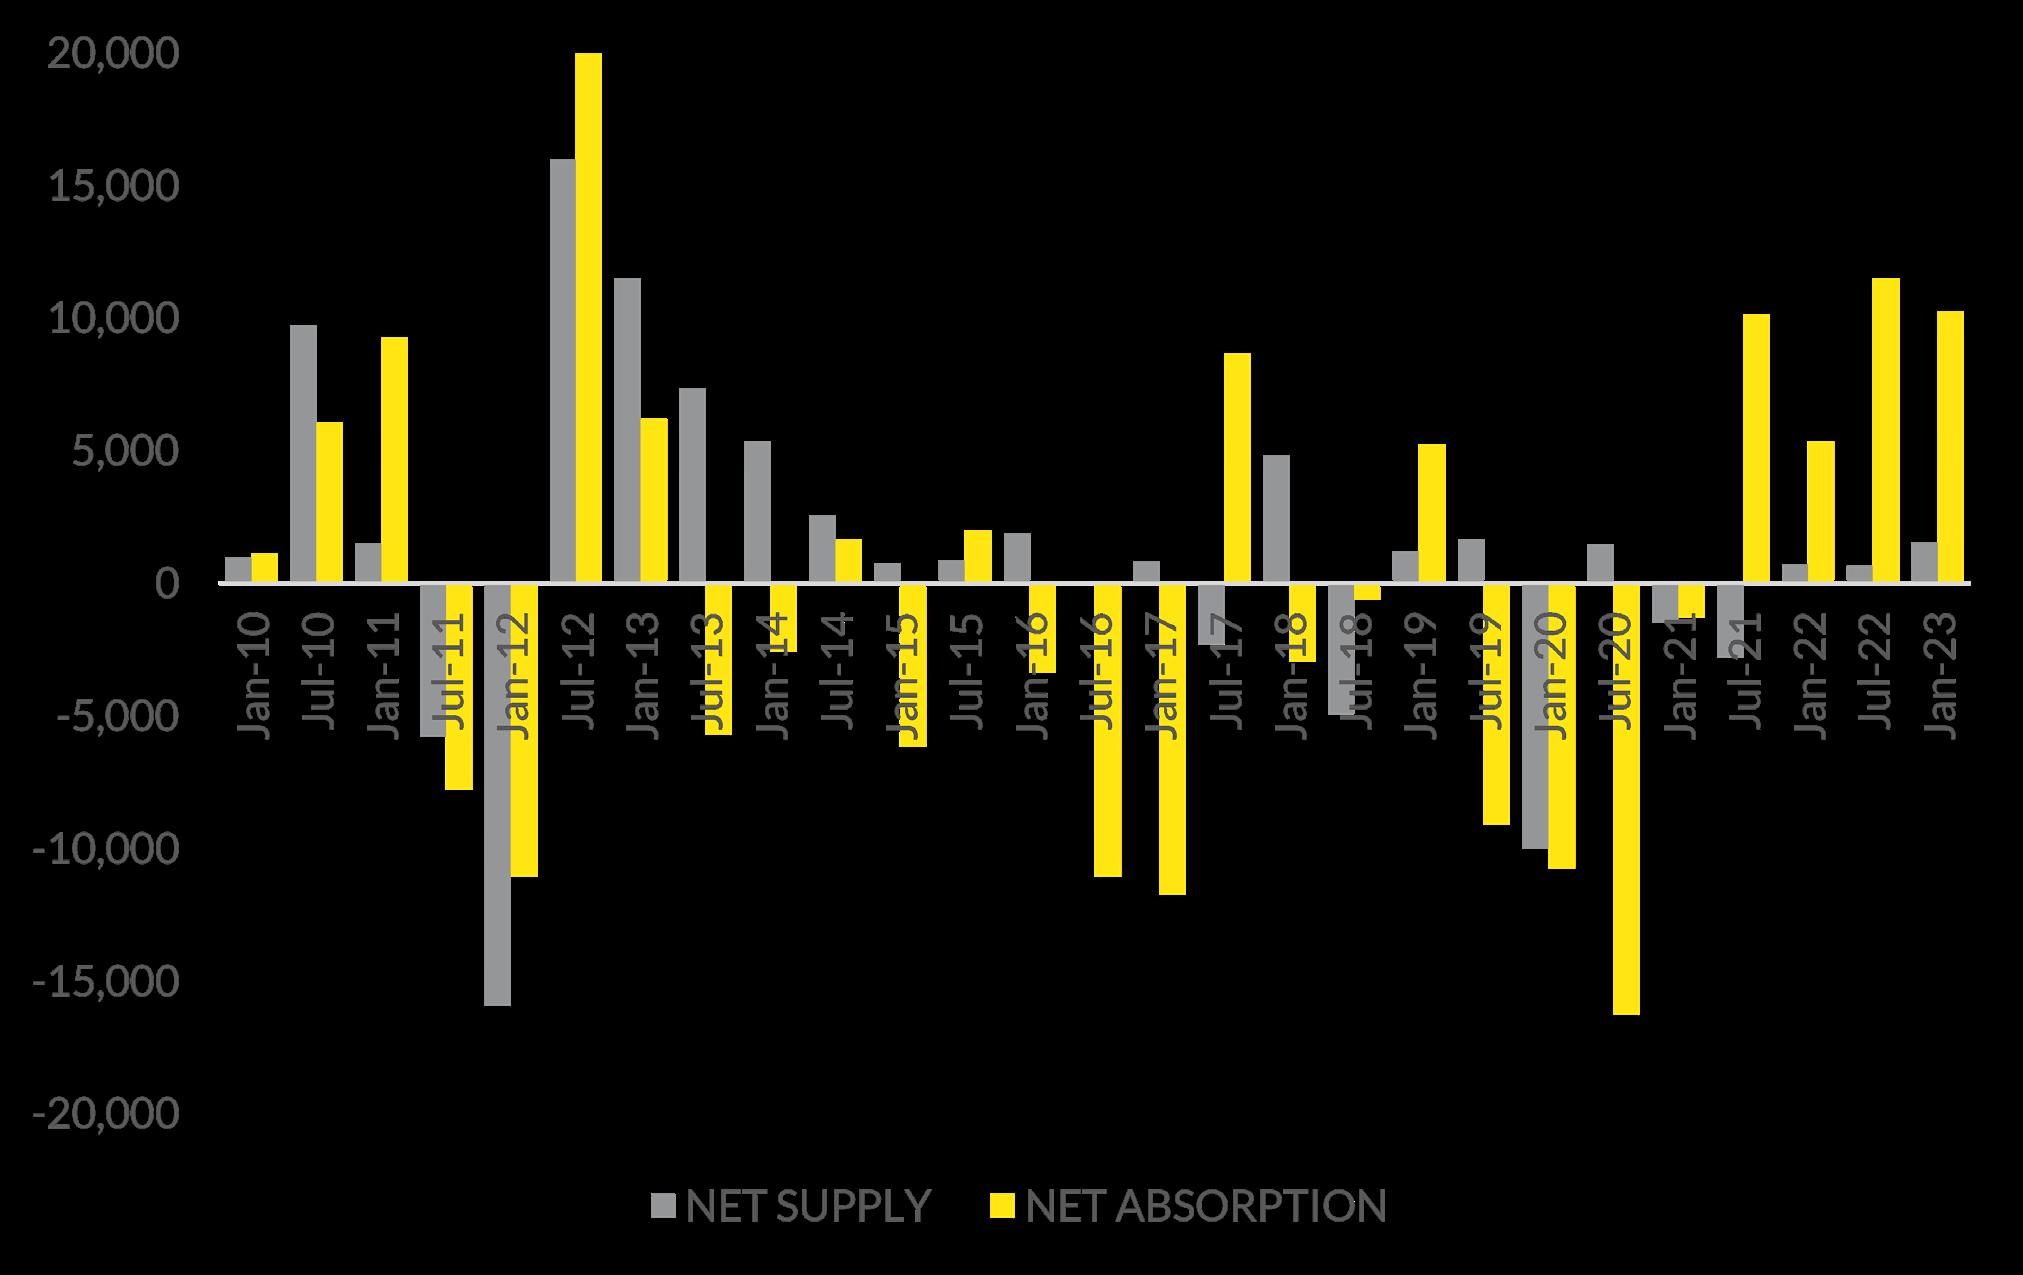
WEST PERTH OFFICE
NET SUPPLY & ABSORPTION (SQM)
West Perth has had a busy six months to January 2023 recording over 10,000sqm of net absorption. This is the fourth highest rate of take up across all major office markets in Australia. This continued growth we have seen over the last two years bucking the trend seen in many other locations. Couple this with the limited supply additions which are expected to remain a feature of West Perth into the medium to long term will see vacancy levels continue to trend downward. Currently under construction is 1-5 Harvest Terrace which will add 3,706sqm of new stock later this year while next year refurbished space at 619 Murray Street will likely enter the market. Despite a lack of commitment, high enquiry levels for stock in the sub 500sqm size range by a range of new and existing businesses will aid in keeping vibrancy up and vacancy levels stable.
RAY WHITE COMMERCIAL (WA) 12
Source: Property Council of Australia
WEST PERTH OFFICE
VACANCIES BY SIZE RANGE, NO. LISTINGS
Ray White Commercial continues to investigate vacant listings across the West Perth office market, while the Property Council of Australia (PCA) identified 55,047sqm of available stock, our count recorded a slightly higher number at 83,384sqm. This typically would be indicative of large range of smaller assets which would not be included in this count together with hidden sub lease space given the PCA’s nil count this period. While there continues to be a high proportion of availability in the smaller suites across West Perth, this year we have seen a greater spread across all size ranges up to 500sqm. 23.85% being sub 149sqm compared to 30.0% 2 years ago, 19.72% in the 150-249sqm size range and 32.57% for 250-499sqm up from 26.81% last year. Professional and technology tenants continue to be the major enquiry for these smaller suites including accounting, law and financial services.

PERTH OFFICE VACANCY & MARKET OVERVIEW 13
Source: Property Council of Australia
2022 has been an outstanding year for the Perth office markets, particularly in comparison to the south-eastern states with results in WA were only rivaled by Queensland markets. It has been both WA and Queensland which enjoyed strong gains in population growth during the COVID period while both markets contribute significantly to the national GDP with WA leading the charge underpinned by mining and construction sectors. It’s the strong fundamentals of the economy which has led to the Perth office markets recording more take up than most of the country and improvements to the overall vacancy situation. While new supply has been difficult for the Perth CBD, continued additions of stock will hamper quick recovery in terms of vacancy however across both markets we have seen strong rental growth which will continue given the high inflationary environment we are in. Investment activity may slow in 2023 and feature higher yields given the increased finance costs with domestic funds likely to capitalize on affordability of large assets in Perth and prospective income gains in the short term.


CONTACT OUR SPECIALISTS
Luke Pavlos Director | Commercial Services M: 0408 823 823 E: luke.pavlos@raywhite.com Brett Wilkins Director of Capital Markets M: 0478 611 168 E: brett.wilkins@raywhite.com Stephen Harrison Joint Managing Director M: 0421 622 777 E: stephen.harrison@raywhite.com Michael Milne Senior Commercial Property Advisor M: 0403 466 603 E: michael.milne@raywhite.com RAY WHITE COMMERCIAL (WA) 14 SUMMARY
LEASED RECENT LEASE TRANSACTIONS
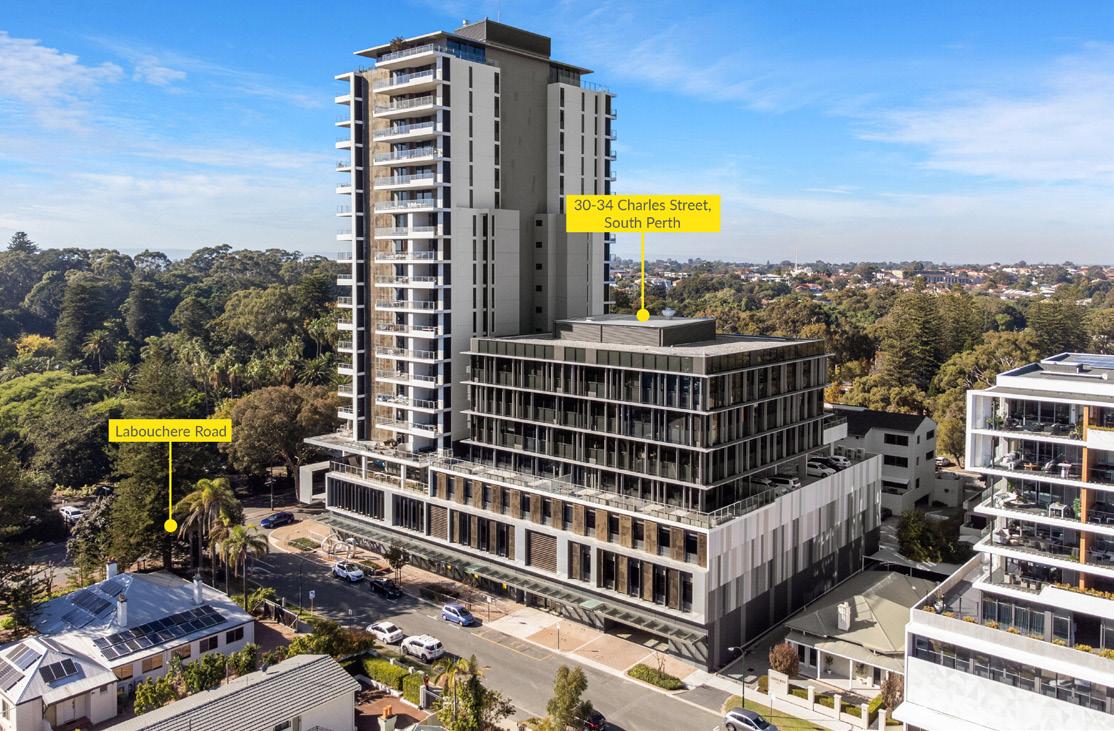
Transactions details available on request. Ray White Commercial (WA) Ground Floor, 12-14 The Esplanade, Perth WA 6000 raywhitecommercial.com 1 TULLY ROAD, EAST PERTH LEASED 30-34 CHARLES STREET, SOUTH PERTH
LEASED 41 ST GEORGES TERRACE, PERTH LEASED
435 ROBERTS ROAD, SUBIACO LEASED 3 HASLER ROAD, OSBORNE PARK LEASED
182 ST GEORGES TERRACE, PERTH LEASED
RAY WHITE COMMERCIAL (WA) Ray White Commercial (WA) Ground Floor 12-14 The Esplanade Perth WA 6000 November 2022 raywhitecommercialwa.com.au Luke Pavlos Director | Commercial Services +61 408 823 823 luke.pavlos@raywhite.com


