WINTER PARK AREA STATS
Monthly Market Update I August
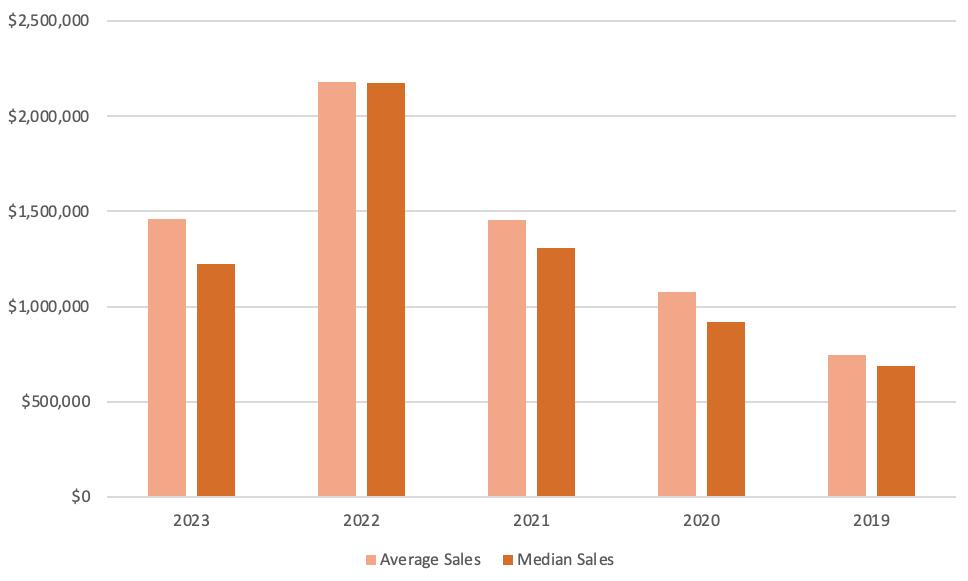
For the Left Brained Single Family Homes in the Winter Park Area* Sold Listings Average Sales Price Year over Year - YTD Days on Market Percent of List Price Price per Sq Ft Aug ‘22 Aug ‘23 Percent change from Previous Month Percent change from Previous Year 64 $1,671,748 $1,499,428 159 102% $587.31 61 $1,452,384 $1,300,000 214 99% $497.56 -5% -13% -13% +35% -3% -15% Median Sales Price 5 $2,180,861 $2,175,000 126 107% $704.23 13 $1,462,269 $1,225,000 136 98% $500.63 +160% -33% -44% +8% -3% -29% Thru Aug '22 Thru Aug '23
All statistics date range: 8/1/2023 through 8/30/2023
Homes 13 # of Sold Listings -33% $1,462,269 Average Sold Price Average Days on Market 136 +160% +8% Percent change from same month, previous year Price Per Sq Ft $500.63 -29% -44% $1,225,000 Median Sold Price -3% 98 Percent of List www.rewinterpark.com 970.726.2600 Average Sold Price August
Winter Park Area Single Family
Monthly Market Update I August
For the Left Brained
All statistics date range: 8/1/2023 through 8/30/2023
Condos 25 # of Sold Listings +8% $742,633 Average Sold Price Average Days on Market 385 +25% +588% Price Per Sq Ft $683.45 +7% +22% $724,000 Median Sold Price +3% 102 Percent of List Average Sold Price August Condos in the Winter Park Area* Sold Listings Average Sales Price Year over Year - YTD Days on Market Percent of List Price Price per Sq Ft Aug ‘22 Aug ‘23 Percent change from Previous Month Percent change from Previous Year 20 $688,425 $592,500 56 99% $727.90 25 $742,633 $724,000 385 102% $690.34 +25% +8% +22% +588% +3% -5% 121 $660,124 $625,000 46 103% $702.99 120 $692,734 $675,000 211 101% $704.51 -1% +5% +8% +359% -2% 0% Median Sales Price Thru Aug '22 Thru Aug '23 Percent change from same month, previous year www.rewinterpark.com 970.726.2600
Winter Park Area
Monthly Market Update I August
www.rewinterpark.com 970.726.2600
the Left Brained
For
All statistics date range: 8/1/2023 through 8/30/2023
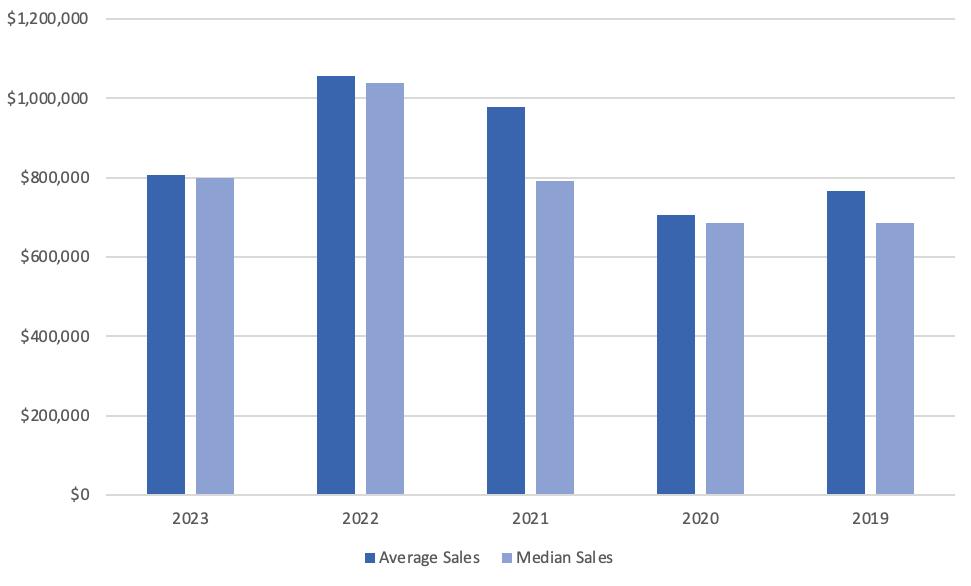
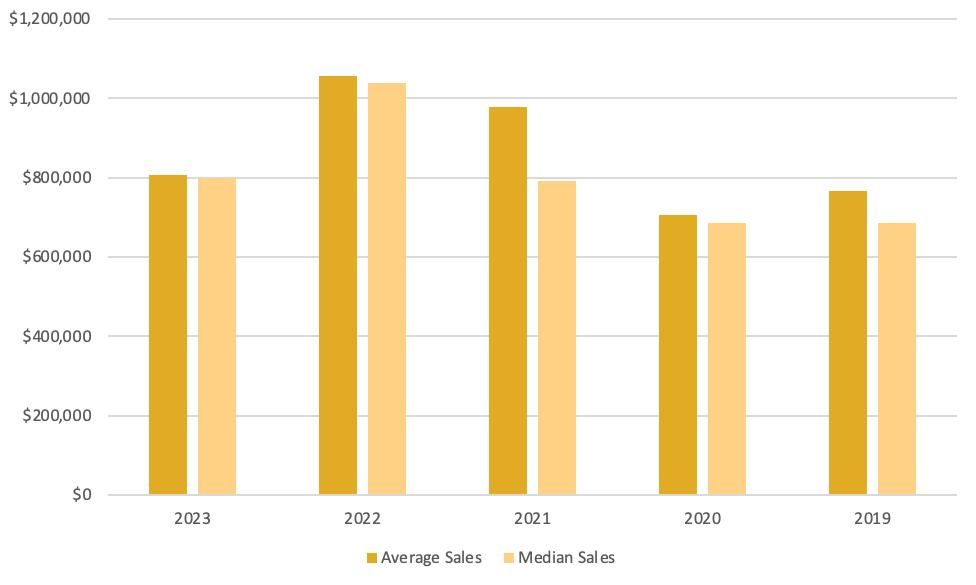
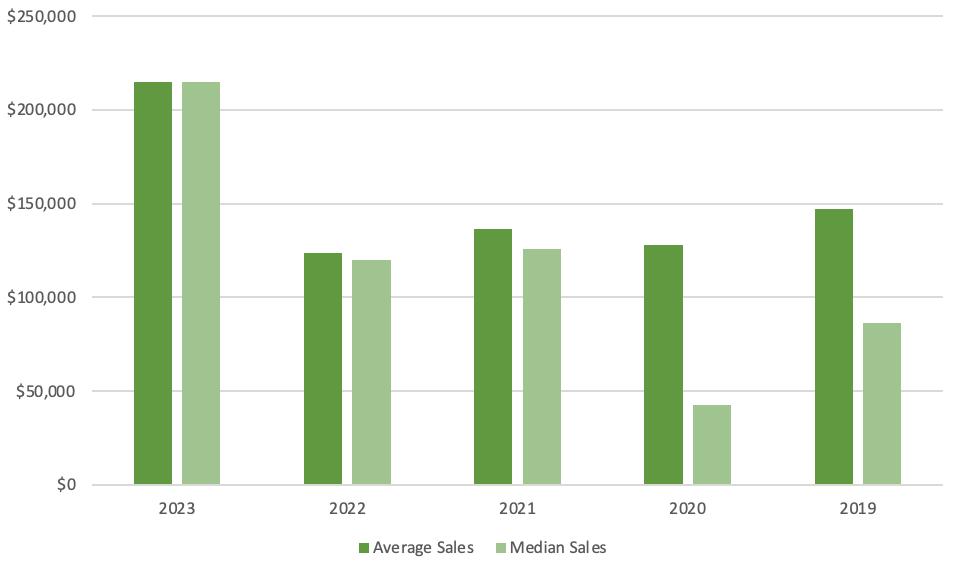
Townhomes Average Sold Price August Percent change from same month, previous year 5 # of Sold Listings -24% $807,021 Average Sold Price Average Days on Market 311 -44% +35% Price Per Sq Ft $593.88 +2% -23% $799,297 Median Sold Price +3% 99 Percent of List Townhomes in the Winter Park Area* Sold Listings Average Sales Price Days on Market Percent of List Price Price per Sq Ft Aug ‘22 Aug ‘23 Percent change from Previous Month Percent change from Previous Year 9 $1,055,917 $1,038,000 230 101% $584.24 5 $807,021 $799,297 311 99% $593.88 -44% -24% -23% +35% -2% +2% Median Sales Price Thru Aug '22 Thru Aug '23 Year over Year - YTD 57 $1,079,559 $990,000 261 103% $579.82 43 $1,045,271 $975,000 269 102% $606.00 -25% -3% -2% +3% -1% +5%
Winter Park Area
Monthly Market Update I August
www.rewinterpark.com 970.726.2600
Brained
For the Left
All statistics date range: 8/1/2023 through 8/30/2023
Vacant Land Average Sold Price August Percent change from same month, previous year 5 # of Sold Listings +113% $959,400 Average Sold Price Average Days on Market 224 -17% +17% +32% $400,000 Median Sold Price +1% 94 Percent of List Price Per Acre $684,750 +173% Vacant Land in the Winter Park Area* Sold Listings Average Sales Price Year over Year - YTD Days on Market Percent of List Price Aug ‘22 Aug ‘23 Percent change from Previous Month Percent change from Previous Year Median Sales Price Thru Aug '22 Thru Aug '23 Price Per Acre 6 $449,612 $304,000 192 93% $251,183 5 $959,400 $400,000 224 94% $684,750 -17% +113% +32% +17% -1% +173% 30 $434,229 $304,000 151 97% $1,877,749 31 $466,787 $300,000 150 97% $525,653 -38% +7% -1% -1% 0% -72%
Winter Park Area
GRANBY AREA STATS

www.rewinterpark.com 970.726.2600 For the Left Brained
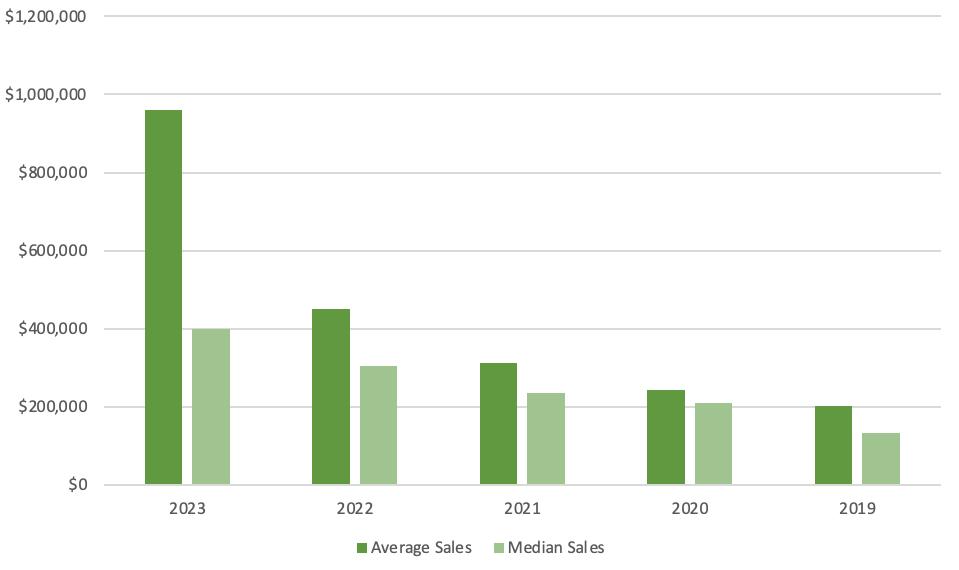
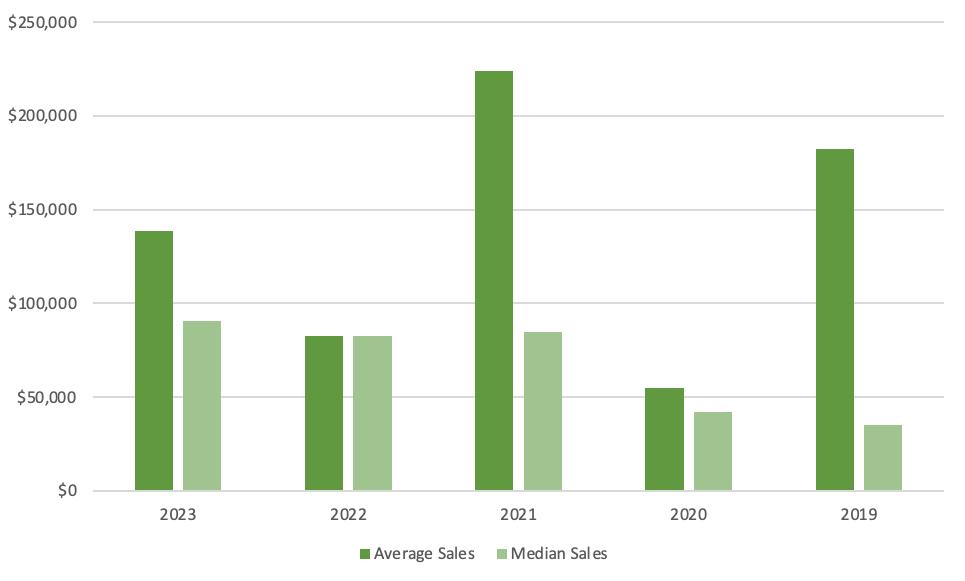
All statistics date range: 8/1/2023 through 8/30/2023 Granby Area Single Family Homes Percent change from same month, previous year 6 # of Sold Listings +67% $1,082,203 Average Sold Price Average Days on Market 240 -57% +220% Single Family Homes in the Granby Area* Sold Listings Average Sales Price Year over Year - YTD Days on Market Percent of List Price Price per Sq Ft Aug ‘22 Aug ‘23 Percent change from Previous Month Percent change from Previous Year 14 $646,974 $592,000 75 99% $354.19 6 $1,082,203 $1,212,108 240 98% $430.12 -57% +67 +105% +220% -1% +21% Median Sales Price 82 $937,094.00 $927,000 90 101% $409.01 46 $934,246.00 $870,000 141 97% $419.77 -44% 0% -6% +57% -4% +3% Thru Aug '22 Thru Aug '23 Price Per Sq Ft $430.12 +21% +105% $1,212,108 Median Sold Price -1% 98 Percent of List Average Sold Price August
Monthly Market Update I August
www.rewinterpark.com 970.726.2600 For the Left Brained
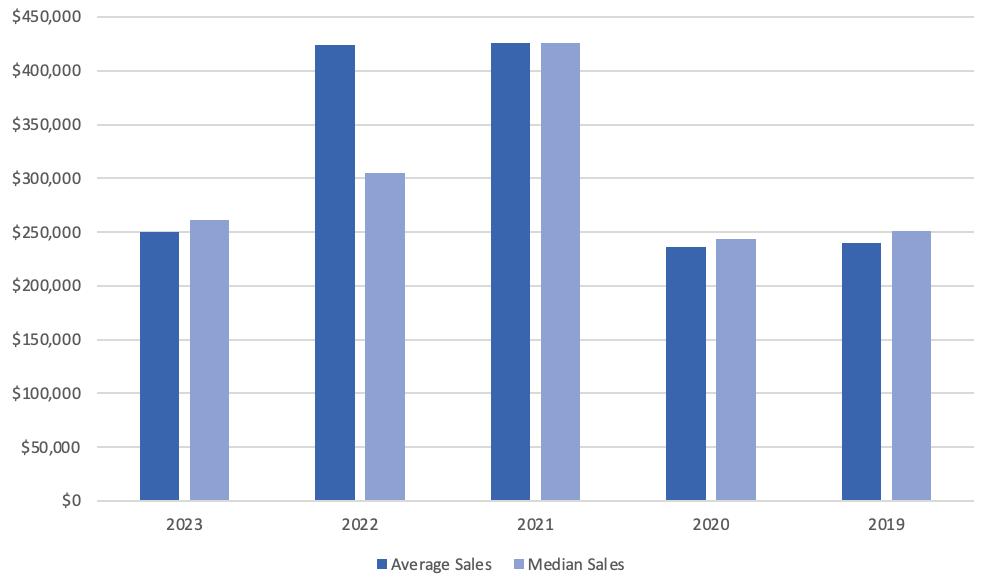
All statistics date range: 8/1/2023 through 8/30/2023 Granby Area Condos Average Sold Price August Percent change from same month, previous year Price Per Sq Ft $427.23 -9% -14% $261,000 Median Sold Price -1% 97 Percent of List Condos in the Granby Area Sold Listings Average Sales Price Year over Year - YTD Days on Market Percent of List Price Price per Sq Ft Aug ‘22 Aug ‘23 Percent change from Previous Month Percent change from Previous Year 9 $423,622 $305,000 40 98% $468.50 4 $250,500 $261,000 45 97% $427.23 -56% -41% -14% +13% -1% -9% Median Sales Price 57 $459,711 $499,000 39 102% $502.23 40 $421,842 $386,750 91 97% $516.25 -30% -8% -22% +133% -5% +3% Thru Aug '22 Thru Aug '23 4 # of Sold Listings $250,500 Average Sold Price Average Days on Market 45 -41% -56% +13%
Monthly Market Update I August
Granby Area
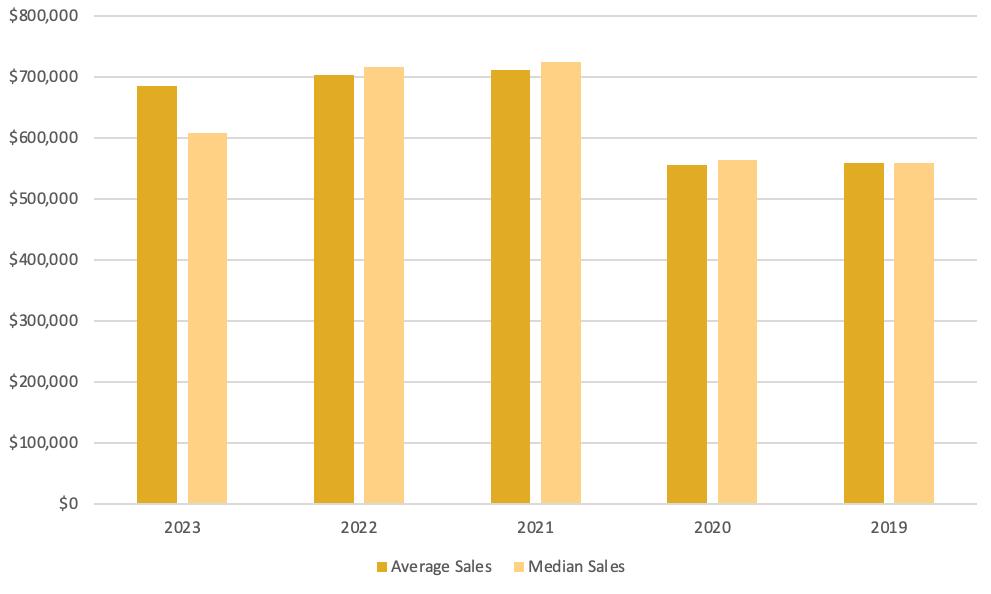
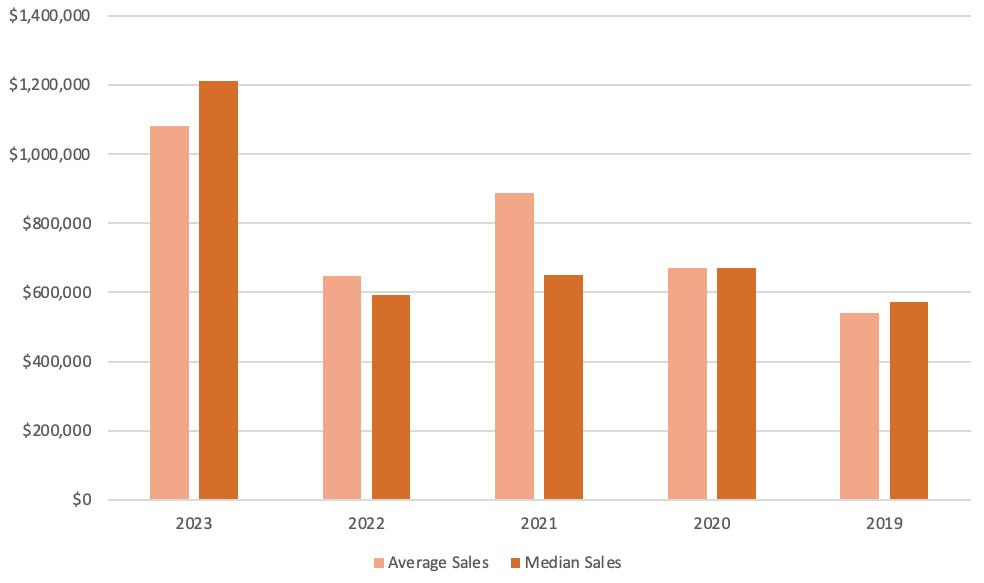
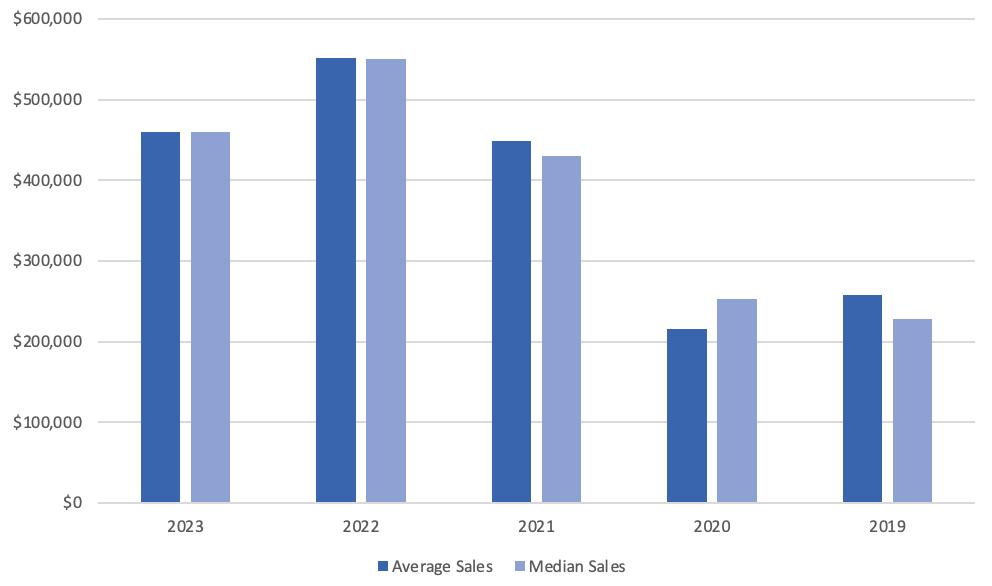
www.rewinterpark.com 970.726.2600 7 # of Sold Listings -3% $684,840 Average Sold Price Average Days on Market 633 +40% +53% Price Per Sq Ft $414.29 +16% -15% $607,800 Median Sold Price -2% 102 Percent of List Sold Listings Average Sales Price Days on Market Percent of List Price Price per Sq Ft 5 $702,733 $716,100 415 104% $358.69 7 $684,840 $607,800 633 102% $414.29 +40% -3% -15% +53% -2% +16% Median Sales Price Year over Year - YTD Aug ‘22 Aug ‘23 Percent change from Previous Month Percent change from Previous Year Thru Aug '22 Thru Aug '23 21 $735,964 $728,450 316 104% $370.79 22 $743,489 $757,500 498 103% $420.16 +5% +1% +4% +58% -1% +13% For the Left Brained
Monthly Market Update I August All statistics date range: 8/1/2023 through 8/30/2023
Average Sold Price August Percent change from same month, previous year
Townhomes
Monthly Market Update I August
www.rewinterpark.com 970.726.2600
All statistics date range: 8/1/2023 through 8/30/2023 Granby Area Vacant Land Average Sold Price August Percent change from same month, previous year 7 # of Sold Listings +68% $138,857 Average Sold Price Average Days on Market 72 +250% +177% +10% $90,500 Median Sold Price -9% 92 Percent of List Price Per Acre $162,970 -50% Vacant Land in the Granby Area* Sold Listings Average Sales Price Year over Year - YTD Days on Market Percent of List Price Aug ‘22 Aug ‘23 Percent change from Previous Month Percent change from Previous Year Median Sales Price Thru Aug '22 Thru Aug '23 Price Per Acre 2 $82,500 $82,500 26 101% $324,962 7 $138,857 $90,500 72 92% $162,970 +250% +68% +10% +177% -9% -50% 90 $201,656 $151,000 105 99% $306,492 43 $125,277 $107,000 133 92% $303,042 -52% -38% -29% +27% -7% -1%
the Left Brained
For
GRAND LAKE AREA STATS

For the Left Brained
www.rewinterpark.com 970.726.2600
All statistics date range: 8/1/2023 through 8/30/2023
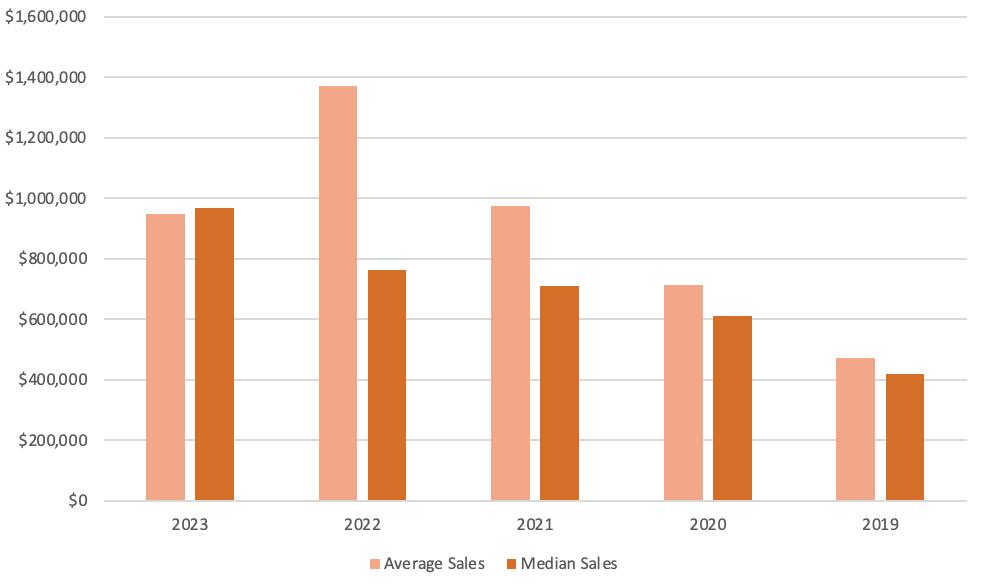
Percent change from same month, previous year Average Sold Price August 4 # of Sold Listings -31% $947,500 Average Sold Price Average Days on Market 64 -50% +25% Price Per Sq Ft $513.26 -16% +27% $970,000 Median Sold Price 0% 98 Percent of List Single Family Homes in the Grand Lake Area* Sold Listings Average Sales Price Year over Year - YTD Days on Market Percent of List Price Price per Sq Ft Aug ‘22 Aug ‘23 Percent change from Previous Month Thru Aug '22 Thru Aug '23 Percent change from Previous Month 8 $1,370,562 $765,000 51 98% $611.78 4 $947,500 $970,000 64 98% $513.26 -50% -31% +14% +25% 0% -16% Median Sales Price 45 $1,083,022 $875,000 74 99% $515.80 37 $828,691 $750,000 135 95% $509.76 -18% -23% -14% +82% -4% -1% Monthly Market Update I August
Grand Lake Area Single Family Homes
Grand Lake Area
For the Left Brained
All statistics date range: 8/1/2023 through 8/30/2023
Monthly Market Update I August
Condos Average Sold Price August Percent change from same month, previous year www.rewinterpark.com 970.726.2600 1 # of Sold Listings -17% $460,000 Average Sold Price August Average Days on Market 45 -80% -38% Price Per Sq Ft $414.41 $460,000 Median Sold Price 99 Percent of List Condos in the Grand Lake Area* Sold Listings Average Sales Price Year over Year - YTD Days on Market Percent of List Price Price per Sq Ft Aug ‘22 Aug ‘23 Percent change from Previous Month Thru Aug '22 Thru Aug '23 Percent change from Previous Month 5 $551,982 $550,000 72 98% $756.88 1 $460,000 $460,000 45 99% $414.41 -80% -17% -16% -38% +1% -45% 26 $514,313 $477,500 85 100% $613.50 13 $563,292 $505,000 143 98% $561.13 -50% +10% +6% +68% -2% -9% Median Sales Price -45% -16% +1%

2 # of Sold Listings +74% $215,000 Average Sold Price Average Days on Market 47 -50% +57% +79% $215,000 Median Sold Price +7% 100 Percent of List Price Per Acre $895,833 +104% www.rewinterpark.com 970.726.2600
All statistics date range: 8/1/2023 through 8/30/2023 Vacant Land Average Sold Price August Percent change from same month, previous year Vacant Land in the Grand Lake Area* Sold Listings Average Sales Price Year Over Year - YTD Days on Market Percent of List Price Aug ‘22 Aug ‘23 Percent change from Previous Month Percent change from Previous Year Median Sales Price Thru Aug '22 Thru Aug '23 Price Per Acre 4 $123,750 $120,000 30 93% $439,070 2 $215,000 $215,000 47 100% $895,833 -50% +74% +79% +57% +7% +104% 19 $134,395 $130,000 92 96% $443,023 25 $206,740 $150,000 159 96% $511,234 +32% +54% +15% +73% 0% +15% For the Left Brained
Monthly Market Update I August
Grand Lake Area
HOT SULPHUR SPRINGS AREA STATS


Monthly Market Update I August
For the Left Brained
All statistics date range: 8/1/2023 through 8/30/2023
Single Family Homes Percent change from same month, previous year Median Sold Price www.rewinterpark.com 970.726.2600 1 # of Sold Listings $525,000 Average Sold Price Average Days on Market 42 Price Per Sq Ft $375.00 $525,000 100 Percent of List Single Family Homes in the HSS Area* Sold Listings Average Sales Price 2023 Year over Year - YTD Days on Market Percent of List Price Price per Sq Ft Thru Aug '22 Thru Aug '23 Percent change from Previous Year Median Sales Price Aug ‘22 Aug ‘23 1 $525,000 $525,000 42 100% $375.00 -67% -13% -15% -33% +3% +47% 14 $526,357 $550,125 79 99% $298.56 7 $599,571 $550,000 102 98% $283.25 -50% +14% 0% +29% -1% -5% 3 $600,500 $616,500 63 97% $254.89 -13% -67% -33% +47% -15% +3% Average Sold Price August Percent change from Previous Year
Hot Sulphur Springs Area
3 # of Sold Listings -63% $68,667 Average Sold Price Average Days on Market 77 +50% +8% -66% $62,000 Median Sold Price +1% 89 Percent of List Price Per Acre $134,712.27 +17% www.rewinterpark.com 970.726.2600
All statistics date range: 8/1/2023 through 8/30/2023
Sulphur Springs Area Vacant Land Average Sold Price August Percent change from same month, previous year Vacant Land in the Granby Area* Sold Listings Average Sales Price 2023 Year To Date Days on Market Percent of List Price Median Sales Price Price Per Acre 2 $185,000 $185,000 71 88% $115,267 3 $68,667 $62,000 77 89% $134,712 +50% -63% -66% +8% +1% +17% Aug ‘22 Aug ‘23 Percent change from Previous Month Percent change from Previous Year Thru Aug '22 Thru Aug '23 9 $115,500 $52,500 169 96% $136,808 5 $73,600 $62,000 145 87% $121,177 -44% -36% +18% -14% -9% -11% For the Left Brained
Monthly Market Update I August
Hot
