3rd Quarter
Leonardo and Angelica,
The Real Estate Market is always changing course; it is never staying still. There is always someone who has a reason to move.

Yes, compared to the last two years, things have slowed down, and the market is not in a frenzy, which is a great time to make a move, as you won’t be in as much competition to get your next home. If you are considering making a change, let’s talk strategy. Contact me today at 604.837.7325.


Let’s Achieve Success Together and Maximize Your Buying Power for Your Next Dream Home!

ATTENTION POSTMASTER: Time Sensitive Materials Personal Real Estate Corporation 604.837.7325 Karen@LivingDouglasPark.com www.LivingDouglasPark.com Karen Carter RE/MAX Crest Realty 1428 W 7th Avenue Vancouver, BC V6H 1C1 Each Office Independently Owned and Operated. Published by REAL Marketing (RM) | www.REALMarketing4You.com | 604.841.1739 | ©2022 Prepared Especially for Real Estate Market Report | October 2022 Presented by Karen Carter Your Douglas Park Real Estate Specialist Signature: _____________________________ Date: _______________ Colours AGENT C A RTER Thinking Vancouver Real Estate? Think Agent Carter! DocuSign Envelope ID: C2AFA397-60EB-4424-BC44-1CFE00B5546F CREST REALTY www.LivingDouglasPark.com Douglas Park DOUGLAS PARK SOLDS TOTAL SALES AVERAGE SOLD PRICE AVERAGE PRICE PER SQ. FT. AVERAGE DAYS ON MARKET AVERAGE SP/LP 2021 3 $2,766,333 $1,090 46 105.8% 2022 2 $3,210,000 $1,068 37 94.0% CHANGE -33.3% +16.0% -2.0% -19.6% -11.8% SINGLE FAMILY HOMES TOWNHOMES & CONDOS CURRENT RESIDENTIAL LISTINGS: 9 CURRENT CONDO LISTINGS: 9
This statistical analysis represents the average comparisons of 2021 over 2020. Data based on listings from REBGV from July 1st to September 27th, 2021 and 2022. Information deemed accurate but not guaranteed.
SOLDS TOTAL SALES AVERAGE SOLD PRICE AVERAGE PRICE PER SQ. FT. AVERAGE DAYS ON MARKET AVERAGE SP/LP 2021 10 $785,970 $1,047 12 99.9% 2022 4 $870,500 $1,086 9 98.5% CHANGE - 60.0% +10.8% + 3.7% - 25.0% - 1.4% REAL ESTATE REVIEW
Leonardo
and Angelica Washington
Karen Carter

Personal Real Estate Corporation

604.837.7325
Karen@LivingDouglasPark.com www.LivingDouglasPark.com
CREST REALTY
Connect with me on:
Douglas Park | Market Report
Douglas Park Single Family Homes Currently Listed
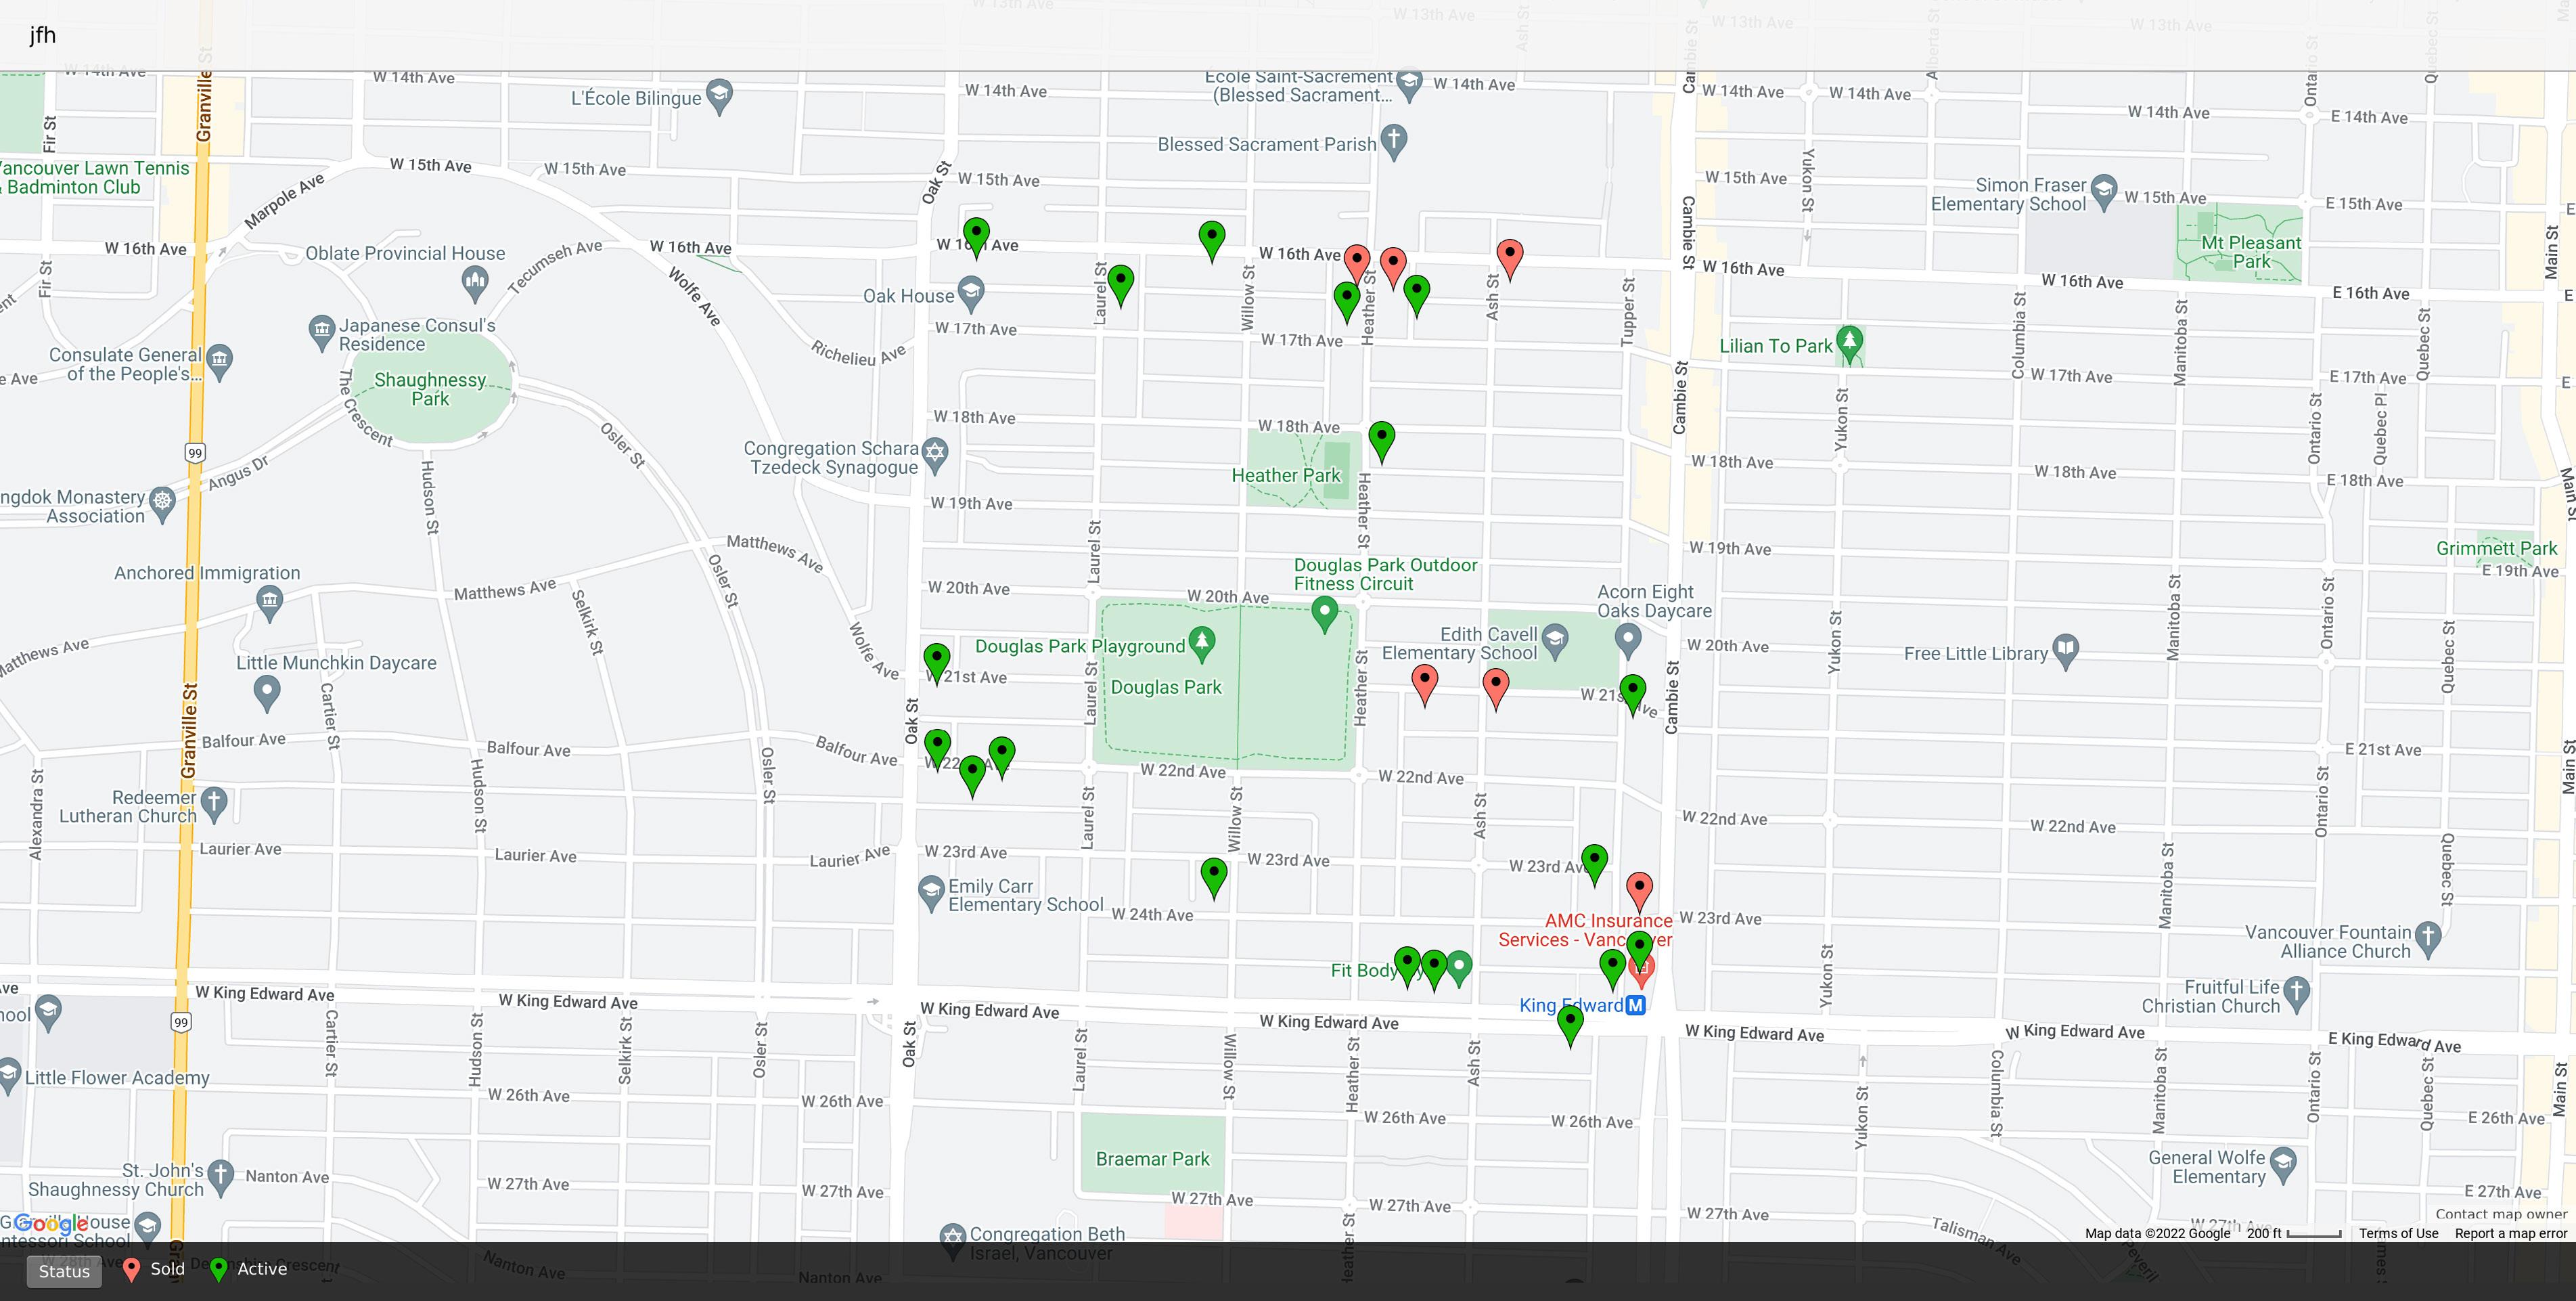
Douglas Park | Current Market Activity

Active Sold
A visual representation of the MLS data on the right page.
Douglas Park Townhomes & Condos Currently Listed
SINGLE FAMILY HOMES ACTIVITY | AT-A-GLANCE
$3,493,333
$3,210,000
Douglas Park Single Family Homes Recently Sold
Due to REBGV regulations, full disclosure of all listings and sold data is only available upon request. *Rounded to the nearest hundred. **Rounded up to the nearest ten thousand.
Karen Carter and RE/MAX Crest Realty are not in any way affiliated with Douglas Park Owners Association, nor is this in any way an official advertisement or publication of Douglas Park. © 2022 All rights reserved. This representation is based on sales and data reported by multiple brokers/agents to the Real Estate Board of Greater Vancouver (REBGV) as of 10/03/22. Listings and sales may not be those of RE/MAX Crest Realty. The REBGV does not guarantee the accuracy of this data, which may not reflect all the real estate activity in the area. E&OE covered. This market report is not intended to solicit properties already listed for sale nor intended to cause a breach of an existing agency relationship. Each office independently owned and operated.
Status Beds Total Baths Finished Sq. Ft.* Approx. List Price** List Date Year Built Active 4 1 1,900 $1,800,000 09/23/22 1913 2 1,700 $2,400,000 08/16/22 1924 2 2,400 $2,700,000 09/06/22 1928 3 2,600 $2,800,000 06/07/22 1914 4 2,300 $2,950,000 09/08/22 1990 3 2,400 $3,290,000 08/12/22 1939 2 3,700 $4,500,000 08/25/22 1924 5 3,000 $5,500,000 06/24/22 1939 2 2,100 $5,500,000 06/24/22 1941
Beds Total Baths Finished Sq. Ft.* Sold Date Year Built SP/LP DOM W 21st Avenue 4 4 2,600 09/09/22 1994 94% 1 6 5 3,500 08/23/22 1991 94% 8
Park Townhomes & Condos Recently Sold Type Beds Total Baths Finished Sq. Ft.* Sold Date Year Built SP/LP DOM W 16th Avenue Condo 1 1 600 09/15/22 1988 100% 6 Sold Cambie Street Condo 3 2 1,200 08/26/22 2017 96% 22 Sold Heather Street Condo 1 1 500 08/10/22 1998 100% 1 Sold Heather Street Condo 1 1 600 07/10/22 1981 98% 5 AVERAGE LIST PRICE AVERAGE SOLD PRICE AVG. DAYS ON MARKET AVERAGE LIST PRICE
AVERAGE SOLD PRICE
AVG. DAYS ON MARKET 5
Douglas
©2022 Google
Status Type Beds Total Baths Finished Sq. Ft.* Approx. List Price** List Date Year Built Active Condo 1 1 700 $650,000 08/11/22 1998 Active Condo 1 1 600 $700,000 08/22/22 2016 Active Condo 1 1 700 $740,000 09/21/22 1998 Active Condo 2 1 900 $750,000 08/11/22 1997 Active Condo 2 2 900 $800,000 09/15/22 1989 Active Condo 2 2 1,000 $940,000 07/07/22 1993 Active Condo 2 2 800 $1,100,000 09/12/22 2019 Active Condo 2 2 900 $1,300,000 05/03/22 2020 Active Condo 2 2 1,300 $2,140,000 04/15/22 2020


