A Miracle on Michigan Avenue: Black Friday/Cyber Monday sales shatter records across the U.S.
Another Black Friday in the books. Gone are the days, it seems, of waking up at 5 a.m. to get a jump on the day’s deals, but that doesn’t equal less activity. In fact, this year saw the highest numbers in a while.
The National Retail Federation estimated that 166 million people shopped from Thanksgiving through Monday, the highest estimate since 2017, but reports concerning consumers’ weekend spending vary.
The Sun Times reported that shoppers carried on as they usually would, without regard to inflation or a looming recession, many even increasing spending. Residents in Chicagoland have estimated they’ll spend around $719, compared to $580 in 2021.

And the holiday hype checks out—no pun intended.
Since the beginning of COVID-19 the season has been abnormal to say the least, and this year, things are finally starting to feel somewhat… normal, and shoppers have taken advantage by starting early.
The Sun Times and Accenture found that of 1,500 Americans, 45% admitted to starting to shop in August.
But the forward-thinking mentality isn’t limited to consumers. Proactive retailers also seized the opportunity to kick start their in-store deals weeks—even months—in advance, especially those in areas that have struggled to regain foot traffic post-pandemic, and the strategy has proven successful thus far.
Shoppers swarmed Chicagoland from Michigan Avenue to Old Orchard in Skokie to Woodfield Mall in Schaumburg, and many people reported it was the largest in-person turnout they’d seen in a while. More than 122.7 million people across the U.S. visited brick-and-mortar stores over the weekend, up 17% from 2021, according to the National Retail Federation.
Welcome news for businesses of all sizes. Mainstream chains like J. Crew, Neiman Marcus, and J.C. Penney were not spared from pandemic suffering, after all.
“It is important to note that while some may claim that retail sales gains are the result of higher prices, they must acknowledge the historic growth in consumers who are shopping in-store and online during the holiday weekend and into Cyber Monday,” said NRF President and CEO Matthew Shay. “It is consumer demand that is driving growth.”
The group predicted the rise of holiday sales by 5% YOY and retailers will pocket 6% to 8% more than in 2021. Nationwide spending in November and December will near $960 billion, according to the Sun Times.

WINTER 2022/2023 RETAIL SPACE GUIDE 10
“While some may claim that retail sales gains are the result of higher prices ... it is consumer demand that is driving growth.”
MARKET OVERVIEW
Cap rates in the single tenant net lease sector increased slightly for all three sectors in the third quarter of 2022. For the first time in the past two years, cap rates increased for two straight consecutive quarters. Single tenant cap rates increased to 5.86% (+6 bps) for retail, 6.80% (+3 bps) for office and 6.61% (+1 bps) for industrial in the third quarter of 2022. As the Federal Reserve continues to increase rates in attempt to curb inflation, debt costs have increasingly put upward pressure on cap rates for buyers of net lease properties.
As economic pressure mounts, formerly opportunistic sellers removed properties from the market that were attempting to take advantage of the historically low cap rate environment. In the third quarter of 2022, the supply of net lease properties decreased by more than 12% when compared to the prior quarter. Furthermore, buyers and sellers have yet to agree on pricing levels given the current environment and a period of price discovery continues. The spread between asking cap rates and confirmed sale cap rates increased slightly in the third quarter, but not in a meaningful amount. Accordingly, sale transactions in the third quarter of 2022 were more than 30% lower than in the third quarter of 2021. The expectation from market participants is that the bid ask spread will widen as price discovery plays out in the fourth quarter and into 2023.

The rising rate and inflationary environment impacted acquisition criteria for net lease buyers. Investor demand for properties with rent growth or the ability to increase rents in the near term are in the greatest demand. Accordingly, demand for properties with limited or no rental escalations are limited to properties with above market yields or strong underlying real estate. Investors expected cap rates to widen for non-core net lease deals with short term leases, lesser tenants or secondary markets. This has yet to occur on a wider scale, causing a wait and see approach for many investors. As the quarter came to a close, institutional investors and publicly traded net lease REITs raised the cap rate floors for future acquisitions as their cost of capital increased.
The capital markets will continue to impact the overall net lease market. Investors will be carefully monitoring the Federal Reserve’s monetary policy and its impact on their borrowing costs. Year end transaction volume will be impacted by the capital markets and the decrease in activity driven by 1031 exchange investors.
NET LEASE MARKET REPORT Q3 2022 www.bouldergroup.com Q2 2022 Q3 2022 Basis Point Sector (Previous) (Current) Change Retail 5.80% 5.86% +6 Office 6.77% 6.80% +3 Industrial 6.60% 6.61% +1 NUMBER OF PROPERTIES ON THE MARKET Q2 2022 Q3 2022 Percentage Sector (Previous) (Current) Change Retail 3,478 3,017 -13.25% Office 709 645 -9.03% Industrial 400 352 -12.00% MEDIAN NATIONAL ASKING VS CLOSED CAP RATE SPREAD
THE
Q2 2022 Q3 2022 Basis Point Sector (Previous) (Current) Change Retail 21 22 +1 Office 29 36 +7 Industrial 16 18 +2 NATIONAL ASKING CAP RATES
SELECTED SINGLE TENANT SALES COMPARABLES
Sale Date Sector Tenant
City
Jul-22 Retail Pick 'n Save Milwaukee WI $20,000,000 $196 6.37% 7
Jul-22 Retail At Home Peabody MN $15,000,000 $156 6.40% 9
Jul-22 Industrial Worthington Steel Bowling Green KY $12,874,000 $154 5.00% 18
Jul-22 Office USF Holland Holland MI $10,300,000 $122 5.95% 7
Jul-22 Retail 7-Eleven San Antonio TX $10,115,500 $2,135 4.15% 14
Jul-22 Office Collins Aerospace Cedar Rapids IA $10,000,000 $100 8.81% 2
Aug-22 Industrial FedEx Emporia VA $9,610,000 $190 5.80% 3 Sep-22 Retail Trader Joe's Gilbert AZ $8,785,000 $617 4.53% 7

Jul-22 Retail Firestone Foxfield CO $8,409,000 $591 4.75% 5
Sep-22 Retail CVS El Paso TX $7,569,231 $567 5.15% 16 Aug-22 Industrial Protect-All Inc Darien WI $7,000,000 $66 6.30% 13 Aug-22 Office US Dept. of Agriculture Alturas CA $6,800,000 $267 9.00% 6 Sep-22 Office Cimarex Energy Carlsbad CA $6,767,500 $424 6.06% 13 Sep-22 Retail Walgreens Lowell MI $5,625,000 $412 5.33% 12
Aug-22 Retail 7-Eleven Fort Salonga NY $5,486,000 $1,933 4.37% 15 Aug-22 Retail Walgreens Edmond OK $5,410,000 $396 4.70% 15 Aug-22 Retail Raising Cane's Irving TX $5,200,000 $1,908 5.19% 3
Q3 2022
THE NET LEASE MARKET REPORT
www.bouldergroup.com
SF Cap
State Price Price Per
Rate Lease Term Remaining
NET LEASE CAP RATE TRENDS RETAIL OFFICE INDUSTRIAL Q3 20040 Q3 20054 Q3 2006 Q3 2007 Q3 2008 Q3 2009 Q3 2010 Q3 2011 Q3 2012 Q3 2013 Q3 2014 Q3 2015 Q3 2016 Q3 2017 Q3 2018 Q3 2019 Q3 2020 Q3 2021 Q3 2022 5.75% 6.25% 6.75% 7.25% 7.75% 8.25% 8.75%
Tenant 2017-2022 2011-2016 2005-2010 Pre 2005
7-Eleven 4.30% 5.00% 5.42% 5.60% Advance Auto Parts 5.70% 6.05% 7.00% 7.55% AutoZone 4.75% 5.00% 5.65% 6.50%
Bank of America 4.90% 5.20% 5.95% 6.20%
Chase Bank 4.30% 4.40% 5.00% 5.60%
CVS Pharmacy 4.85% 5.00% 6.50% 7.00%
DaVita Dialysis Center 5.25% 5.90% 6.50% 7.00% Dollar General 5.40% 5.80% 6.40% 7.00% Family Dollar 6.25% 6.60% 7.00% 7.65% FedEx 5.15% 5.50% 6.35% 6.90% Fresenius 5.25% 6.00% 6.45% 7.10% McDonald's (GL) 3.75% 4.00% 4.20% 4.50% O'Reilly Auto Parts 5.00% 5.65% 5.90% 6.30% Rite Aid NA 7.15% 7.80% 8.25% Starbucks 5.00% 5.40% 6.00% 6.20% Walgreens 5.00% 5.14% 6.60% 7.00%
© 2022. The Boulder Group. Information herein has been obtained from databases owned and maintained by The Boulder Group as well as third party sources. We have not verified the information and we make no guarantee, warranty or representation about it. This information is provided for general illustrative purposes and not for any specific recommendation or purpose nor under any circumstances shall any of the above information be deemed legal advice or counsel. Reliance on this information is at the risk of the reader and The Boulder Group expressly disclaims any liability arising from the use of such information. This information is designed exclusively for use by The Boulder Group clients and cannot be reproduced, retransmitted or distributed without the express written consent of The Boulder Group.
www.bouldergroup.com

Q3 2022
THE NET LEASE MARKET REPORT
MEDIAN ASKING CAP RATES BY YEAR BUILT FOR MORE INFORMATION John Feeney Senior Vice President john@bouldergroup.com Carter Himley Senior Analyst carter@bouldergroup.com CONTRIBUTORS Randy Blankstein President randy@bouldergroup.com Jimmy Goodman Partner jimmy@bouldergroup.com AUTHOR Sean Dittoe Analyst sean@bouldergroup.com
Craig/Steven Development Corporation (847) 504.8061
Year Built/Year Renovated: 1993
Type of Center: Neighborhood No. of Stores: 16
Total Space: 83,727
Total Available Space: 0
Available Minimum: 0
Maximum Contiguous: 0
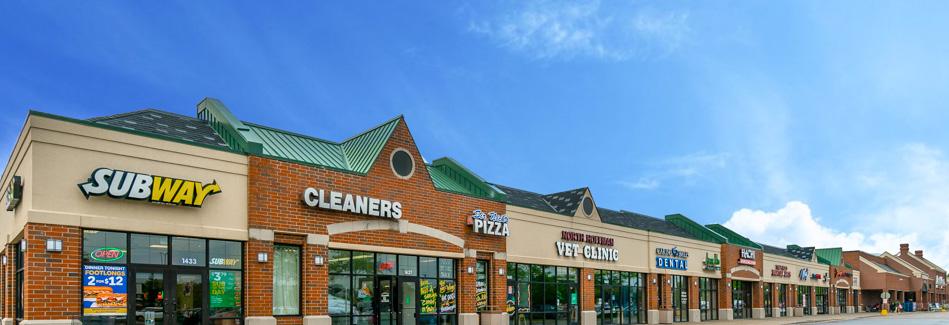
Anchor Tenants: Jewel/Osco, Subway, UPS Store, Rosati’s Pizza

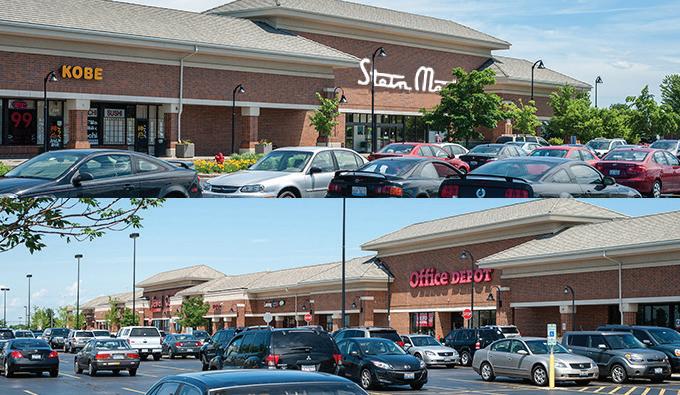
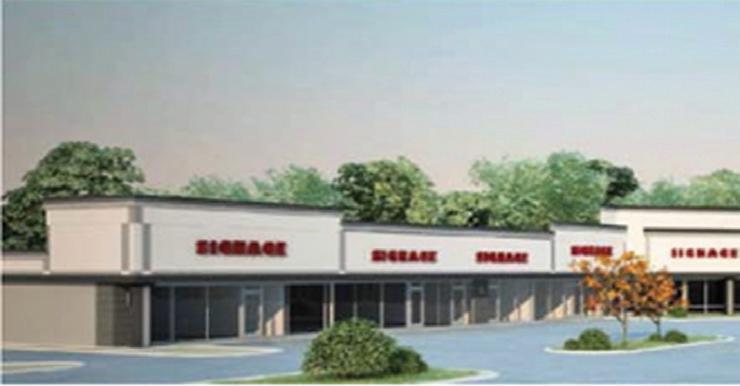
Rental Rate: $20.00
Total Passthroughs: $7.19
Craig/Steven Development Corporation (847) 504.8061


Year Built/Year Renovated: 2002
Type of Center: Neighborhood No. of Stores: 8
Total Space: 81,700
Total Available Space: 1,600
Available Minimum: 1,600
Maximum Contiguous: 1,600
Anchor Tenants: Guitar Center, Fitness 19, Fun City
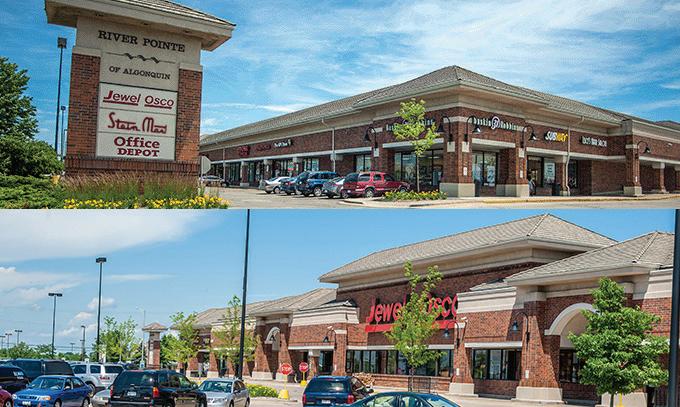
Rental Rate: $20.00
Total Passthroughs: $5.82
Year Built/Year Renovated: 2003/2016
Type of Center: Neighborhood No. of Stores: 15
Total Space: 37,968
Total Available Space: 0
Available Minimum: 0
Maximum Contiguous: 0
Anchor Tenants: Armanetti’s Liquors, Your Best Friends Closet
Rental Rate: N/A
Total Passthroughs: N/A
Year Built/Year Renovated:
Type of Center:
No. of Stores:
Total Space: 37,000
Total Available Space: 8,600
Available Minimum: 1,100
Maximum Contiguous: 7,500
Anchor Tenants: Any Time Fitness
Rental Rate:
Total Passthroughs: $4.50
Highland
Assoc., Inc. (630) 691.1122

777.6160

of
2401-2413 W. Algonquin Road ID# 463
River Pointe
Algonquin Phase I
David Strusiner
Pal-Win 1401-1457 Palatine Road ID# 1229
Algonquin
Arlington Heights
Pointe of
2401-2413 W. Algonquin Road ID# 1222
Michael Kolodny
zav & Johnson Property Mgmnt.,Ltd. (773)
River
Algonquin Phase II
David Strusiner
Prestwicke Plaza 3905-3989 W. Algonquin Road ID# 463
Charles S. Margosian
WINTER 2022/2023 RETAIL SPACE GUIDE 14
Management
Town
Year Built/Year Renovated: 1996
Type of Center: Neighborhood No. of Stores: 9
Total Space: 32,246
Total Available Space: 0
Available Minimum: 0
Maximum Contiguous: 0
David Strusiner
Craig/Steven Development Corporation (847) 504.8061
Anchor Tenants: AccuQuest Hearing Center, CVS Pharmacy, Pink Hair Studio

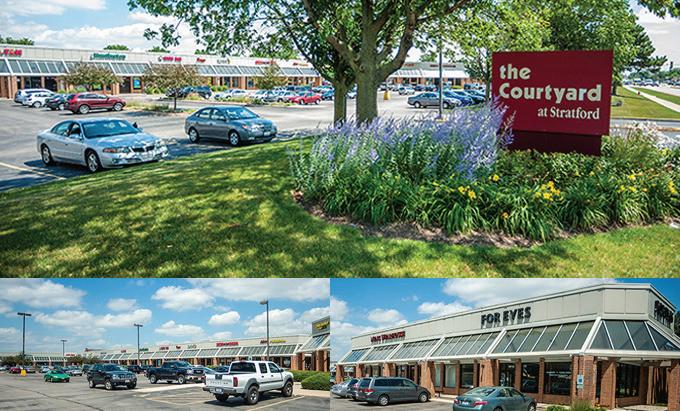
Rental Rate: $19.00
Total Passthroughs: $6.88
Bloomingdale Town Centre Phase III
David Strusiner
Year Built/Year Renovated: 2005
Type of Center: Neighborhood No. of Stores:
Total Space: 15,000
Total Available Space: 15,000
Available Minimum: 1,200
Maximum Contiguous: 15,000
Anchor Tenants: Future Development
Rental Rate: Total Passthroughs:
David Strusiner
Craig/Steven Development Corporation (847) 504.8061 The Courtyard at Stratford
Craig/Steven Development Corporation (847) 504.8061
Year Built/Year Renovated: 1983
Type of Center: Neighborhood No. of Stores: 17
Total Space: 20,890
Total Available Space: 1565
Available Minimum: 1565
Maximum Contiguous: 1565
Anchor Tenants: For Eyes, Men’s Warehouse, FedEx Rental Rate:
Total Passthroughs: $6.28
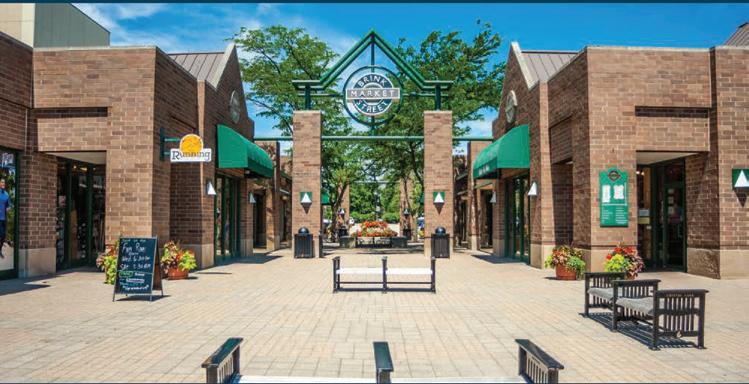
David Strusiner
Craig/Steven Development Corporation (847) 504.8061


Year Built/Year Renovated: 1989
Type of Center: Neighborhood No. of Stores: 13
Total Space: 28,042
Total Available Space: 0
Available Minimum: 0
Maximum Contiguous: 0
Anchor Tenants: Starbucks, Benedicts La Strata, The Running Depot
Rental Rate: $15.00
Total Passthroughs: $7.69
ID# 133
NEC Lake St & Bloomingdale Road
357-369
ID# 487
W. Army Trail Road
ID# 769
Bloomingdale
Centre NEC Lake St & Bloomingdale Road
Bloomingdale
30-40 N. Williams Street ID# 676
Brink Street Market
WINTER 2022/2023 RETAIL SPACE GUIDE 15
Crystal Lake
Elmhurst Plaza
Highland Management Assoc., Inc. (630) 691.1122
Year Built/Year Renovated: 2008
Type of Center: Community No. of Stores: 15
Total Space: 124,000
Total Available Space: 34,012
Available Minimum: 3,000
Maximum Contiguous: 5,200
Anchor Tenants: Petco, Savers, Dollar Tree, LaRosita Market

Rental Rate: $18.00 - $20.00
Total Passthroughs: $5.00
Highland Management Assoc., Inc. (630) 691.1122


Year Built/Year Renovated: 2021
Type of Center: Neighborhood No. of Stores: 16
Total Space: 73,000
Total Available Space: 1,522
Available Minimum: 1,522
Maximum Contiguous: 1,522
Anchor Tenants: Jewel/Osco, ATI Physical Therapy, Dunkin Donuts, The UPS Store
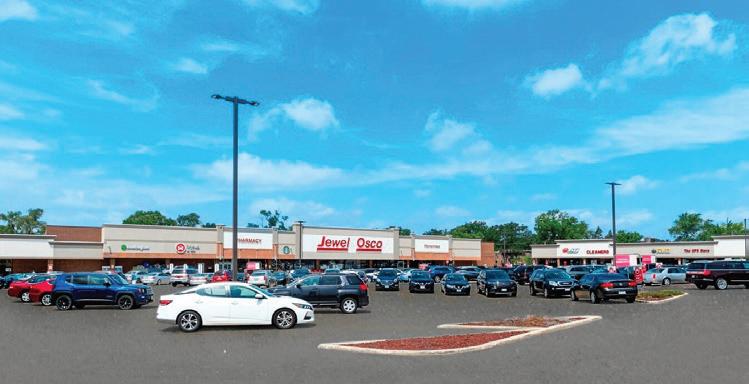
Rental Rate: $37.00
Total Passthroughs: $6.65
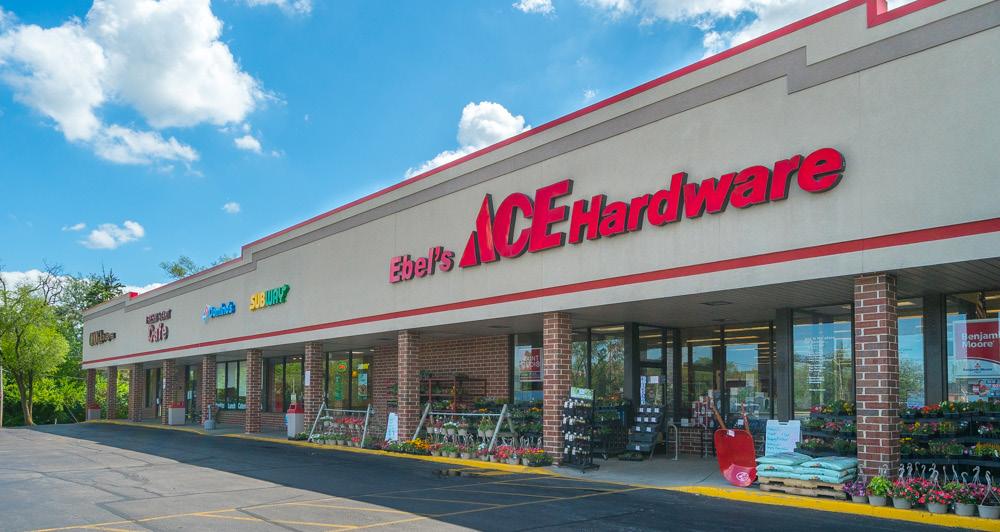
Year Built/Year Renovated: 2004
Type of Center: Neighborhood No. of Stores: 8
Total Space: 33,000
Total Available Space: 6,500
Available Minimum: 6,500
Maximum Contiguous: 6,500
Rental Rate: $20.00
Total Passthroughs: $6.40
Highland
Assoc., Inc. (630) 691.1122
Anchor Tenants: Fresh Start Cafe, Ace Hardware, Yoga by Degrees
Craig/Steven Development Corporation

(847) 504.8061
Year Built/Year Renovated: 1985
Type of Center: Neighborhood No. of Stores: 14
Total Space: 29,564
Total Available Space: 0
Available Minimum: 0
Maximum Contiguous: 0
Anchor Tenants: Walgreens, For-Eyes Optical, Super Cuts, Rockstar Nail & Spa
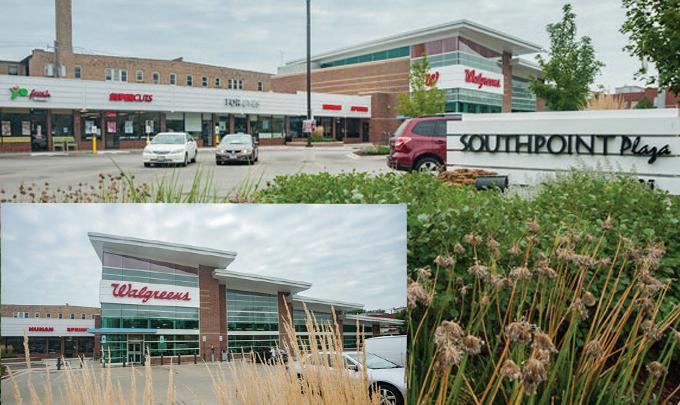
Rental Rate: $19.00
Total Passthroughs: $11.46
230
Street ID# 79
Country Corners
Virginia
Charles S. Margosian
NWC York Road & Lexington Street ID# 117
Lexington Square
Charles S. Margosian
Southpoint Plaza 635 Chicago Avenue ID# 991
Management
David Strusiner
Evanston
York & Butterfield Road ID# 248
Charles S. Margosian
WINTER 2022/2023 RETAIL SPACE GUIDE 16
Elmhurst
Craig/Steven Development Corporation (847) 504.8061
Year Built/Year Renovated: 1989
Type of Center: Neighborhood No. of Stores: 15

Total Space: 21,462
Total Available Space: 4,343
Available Minimum: 830
Maximum Contiguous: 3,513
Anchor Tenants: Vitalant, Q Nails, Harbor Coin, Jimmy Johns
Rental Rate: $18.00
Total Passthroughs: $9.84
Craig/Steven Development Corporation (847) 504.8061


Year Built/Year Renovated: 1984
Type of Center: Neighborhood No. of Stores: 20
Total Space: 45,188
Total Available Space: 6,922
Available Minimum: 1,297
Maximum Contiguous: 3,340
Anchor Tenants: Walker Bros. Restaurant, Dairy Queen, The Bar Method, New Balance
Rental Rate: $18.00
Total Passthroughs: $10.51
691.1122
Year Built/Year Renovated: 2000
Type of Center: Neighborhood No. of Stores: 20
Total Space: 38,980
Total Available Space: 2,250
Available Minimum: 2,250
Maximum Contiguous: 4,590
Anchor Tenants: Jewel/Osco, Starbucks, Orangetheory Fitness, Lou Malnati’s, ATI Physical Therapy
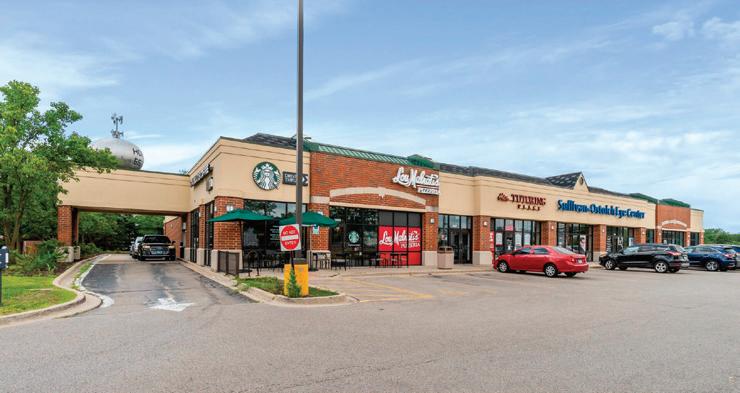
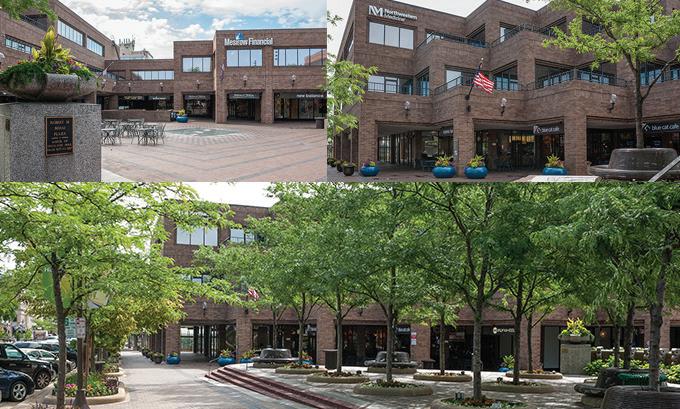
Rental Rate: $32.00
Total Passthroughs: $12.70
(847) 504.8061
Year Built/Year Renovated: 1989
Type of Center: Neighborhood No. of Stores: 12
Total Space: 32,849
Total Available Space: 8,744
Available Minimum: 1,206
Maximum Contiguous: 6,331
Anchor Tenants: Walgreens, Lou Malnati Pizzeria, Avalon Spa


Rental Rate: $20.00
Total Passthroughs: $8.56
5250 Grand Avenue ID# 749
Pembrook Corners
David Strusiner
Gurnee
600 Central Avenue ID# 808
Port Clinton Square
David Strusiner
Charles
1405-1481 Palatine Road ID# 1041
Highland Park
Plaza
Charles S. Margosian Highland Management Assoc., Inc. (630)
Hoffman Estates
The Courtyard of
Zurich Cuba & Rand Road ID# 419
Lake Zurich
Lake
David Strusiner
Craig/Steven Development Corporation
WINTER 2022/2023 RETAIL SPACE GUIDE 17
Boone Creek Plaza
Charles S. Margosian
Highland Management Assoc., Inc. (630) 691.1122
Year Built/Year Renovated: 1983/2003
Type of Center: Neighborhood No. of Stores:
Total Space: 75,000
Total Available Space: 0
Available Minimum: 0
Maximum Contiguous: 0
Anchor Tenants: Jewel/Osco, iHop
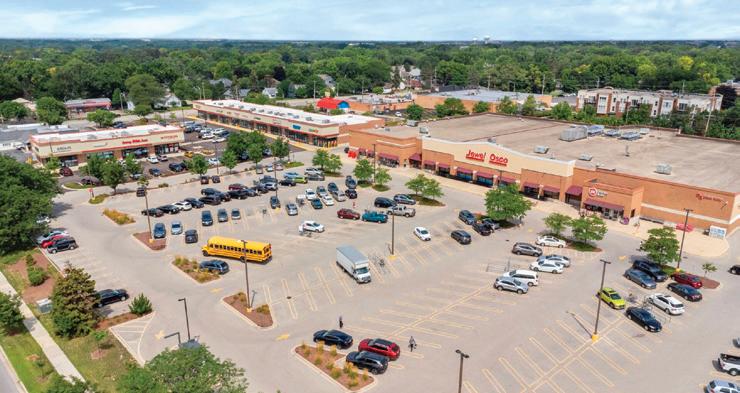
Rental Rate: N/A
Total Passthroughs: N/A
Naper Ridge Plaza
Naperville River West Plaza
Year Built/Year Renovated: 2004
Type of Center: Neighborhood No. of Stores: 2
Total Space: 30,000
Total Available Space: 0
Available Minimum: 0
Maximum Contiguous: 0
Anchor Tenants: Office Depot, Fifth Third Bank
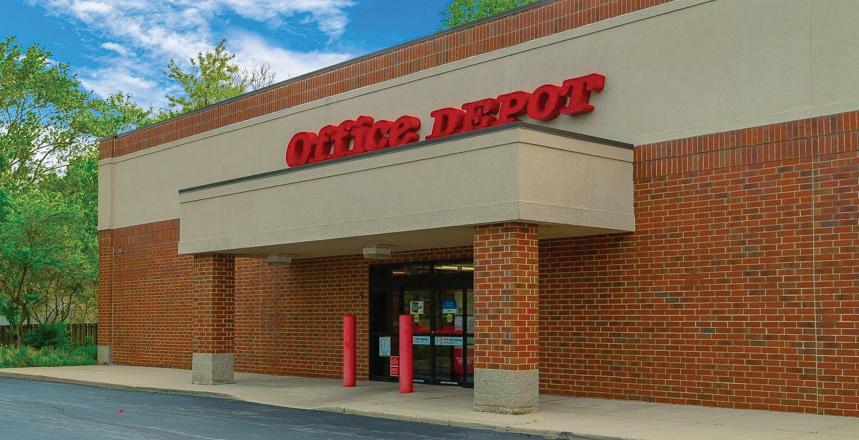
Rental Rate: N/A
Total Passthroughs: N/A
S. Margosian
Highland Management Assoc., Inc. (630) 691.1122
Highland Management Assoc., Inc. (630) 691.1122
Year Built/Year Renovated: 2004
Type of Center: Neighborhood No. of Stores: 10
Total Space: 18,500
Total Available Space: 0
Available Minimum: 0
Maximum Contiguous: 0
Anchor Tenants: Great Clips, Spice Mart
Rental Rate: N/A
Total Passthroughs: N/A
Charles S. Margosian
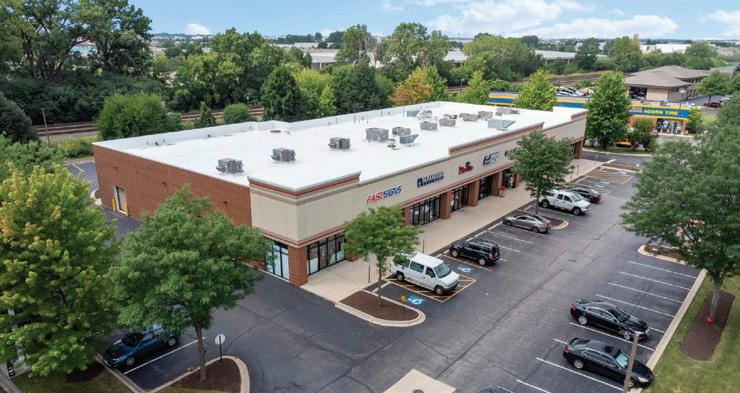
Highland Management Assoc., Inc. (630) 691.1122


Year Built/Year Renovated: 2007
Type of Center: Neighborhood No. of Stores: 14
Total Space: 24,883
Total Available Space: 0
Available Minimum: 0
Maximum Contiguous: 0
Anchor Tenants: Jewel/Osco
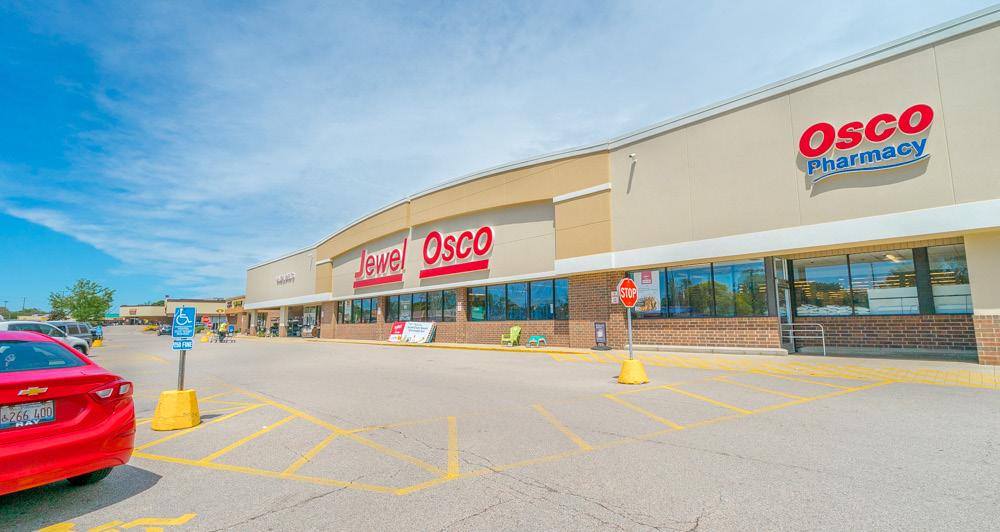
Rental Rate: N/A
Total Passthroughs: N/A
Naper
ID# 150
Boulevard & Ridgeland Ave
Charles
1550 N. Aurora Road ID# 161
Charles S. Margosian
Rt 120 &
ID# 627
Oak Drive
111-115 E. Ogden Avenue ID# 815
McHenry North Town Plaza
WINTER 2022/2023 RETAIL SPACE GUIDE 18
Park
Plaza
Year Built/Year Renovated: 1988
Type of Center: Neighborhood No. of Stores: 30
Total Space: 61,121
Total Available Space: 11,500
Available Minimum: 1,400
Maximum Contiguous: 3,000
Anchor Tenants:Clothes Mentor, Culver’s,Avolve Fitness
Rental Rate: $16.00
Total Passthroughs: $8.11
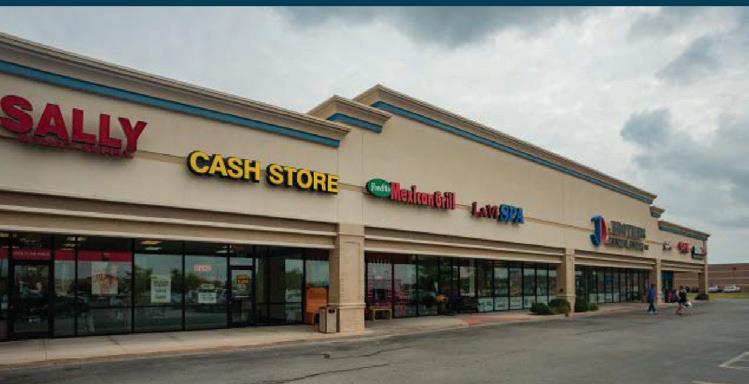
Ottawa Centre
Year Built/Year Renovated:
Type of Center: Community No. of Stores:
Total Space: 63,446
Total Available Space: 18,851
Available Minimum: 2,500
Maximum Contiguous: 12,000
Anchor Tenants: .AT&T Verizon, Rosati’s Pizza, Game Stop

Rental Rate: Total Passthroughs:
Craig/Steven Development Corporation
(847) 504.8061
Craig/Steven Development Corporation (847) 504.8061
Highland Management Assoc., Inc. (630) 691.1122

Year Built/Year Renovated: 2010
Type of Center: Neighborhood No. of Stores: 29
Total Space: 137,000
Total Available Space: 20,690
Available Minimum: 1,495
Maximum Contiguous: 15,115
Anchor Tenants: Ace Hardware, Planet Fitness, Dollar Tree, Sherwin Williams


Rental Rate: $11.00 - $20.00
Total Passthroughs: $9.25
Craig/Steven Development Corporation


(847) 504.8061
Year Built/Year Renovated: 2004
Type of Center: Neighborhood
No. of Stores: 7
Total Space: 19,200
Total Available Space: 6,000
Available Minimum: 1,200
Maximum Contiguous: 3,600
Anchor Tenants: Dunkin Donuts, Forest Dentistry
Rental Rate: $21.00
Total Passthroughs: $8.93
Orland Park
9156-9240 W. 91st Street ID# 437
Hill
David Strusiner
333-389 W. Stevenson Road ID# 518
David Strusiner
211-333 E. Northwest Highway ID# 162
Ottawa Palatine Plaza
Charles S. Margosian
SWC Route 83 & Monaville Road ID# 320
Palatine
Silver Oaks Shopping Center
David Strusiner
WINTER 2022/2023 RETAIL SPACE GUIDE 19
Round Lake Beach
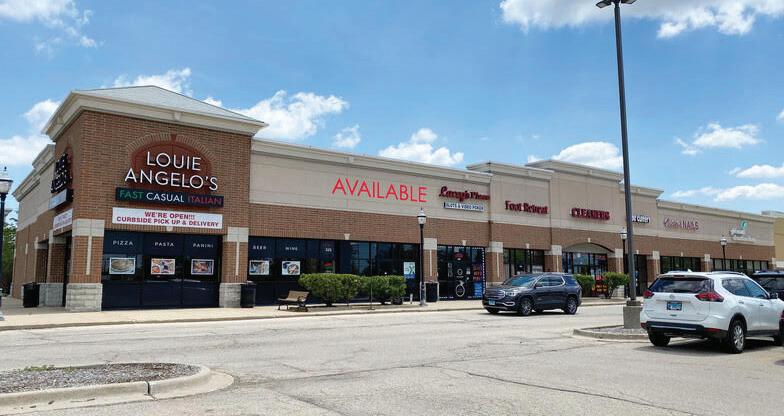
Year Built/Year Renovated: 2000
Type of Center: Community No. of Stores: 17
Total Space: 39,393
Total Available Space: 6,163
Available Minimum: 6,163
Maximum Contiguous: 6,163
Anchor Tenants: Jewel/Osco, Ace Hardware
Rental Rate: $25.00
Total Passthroughs: $9.15
Year Built/Year Renovated: 2004
Type of Center: Neighborhood No. of Stores: 13
Total Space: 29,748
Total Available Space: 3,730
Available Minimum: 1,169
Maximum Contiguous: 0
Rental Rate: $12.00-19.00
Total Passthroughs: $5.36
Year Built/Year Renovated: 1985
Type of Center: Neighborhood No. of Stores:
Total Space: 19,553
Total Available Space: 0
Available Minimum: 0
Maximum Contiguous: 0
Anchor Tenants: Dollar General, Supercuts, Stella’s

Rental Rate: $16.00
Total Passthroughs: $4.10
Year Built/Year Renovated: 1970/1987
Type of Center: Neighborhood No. of Stores:
Total Space: 100,000
Total Available Space: 13,685
Available Minimum: 1,500
Maximum Contiguous: 10,000
Anchor Tenants: Jimenez Foods, Mark Drug Medical Supply

Rental Rate:
Total Passthroughs:
Highland
Assoc., Inc. (630) 691.1122

Craig/Steven Development Corporation (847) 504.8061
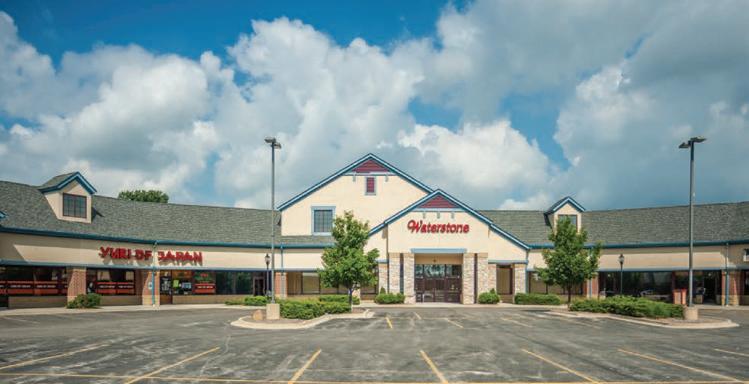
Anchor Tenants: Lou Malnati’s, CK Salon, Yuri of Japan, Home of the Sparrow
Craig/Steven Development Corporation (847) 504.8061

(773) 777.6160

Waterstone Place 34500 N. Highway 45 ID# 667
David Strusiner
Lake The
321 E. St. Charles Road ID# 530
Third
Villa Center
David Strusiner
The Shoppes
305-365 S. Randall Roada ID# 815
Villa Park
at Stony Creek
Charles S. Margosian
Lynn Plaza 522-550 Dundee Road ID# 838
Management
South Elgin
Michael Kolodny
Wheeling WINTER 2022/2023 RETAIL SPACE GUIDE 20
Hallmark & Johnson Property Mgmnt., Ltd.

Zion Commons 21st Street & Sheridan Road ID# 536
Built/Year Renovated: 2004
of Center: Neighborhood
of Stores:
Space: 9,180
Available Space: 0 Available Minimum: 9,180
Contiguous: 0
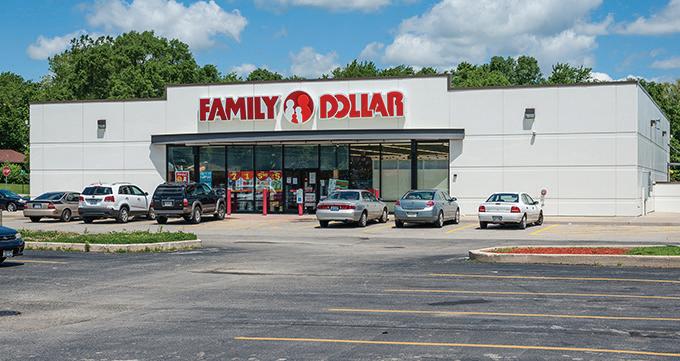
Tenants: Single Tenant Building, Family Dollar
Rate:
Passthroughs:
Strusiner Craig/Steven Development Corporation (847) 504.8061 Zion Reach Over 8000 Professionals The Retail Space Guide is the source for semiannual market reports, updates on retail trends, providing the opportunity for Brokers/ Owners to place photolistings or display advertising of retail center properties with updated data throughout Chicago Metro area, NW Indiana, SE Wisconsin. PROMOTE your retail center in Spring 2023 Mark Menzies 312-933 - 8559 menzies@rejournals.com Mar ianne Gr ierson 312-3 8 8 - 6181 mgr ierson@rejournals com Ernie Abood 773 -919- 8799 eabood@rejournals.com Frank Biondo 24 8 - 670 -2691 fbiondo@rejournals com WINTER 2022/2023 RETAIL SPACE GUIDE 21
Year
Type
No.
Total
Total
Maximum
Anchor
Rental
Total
David


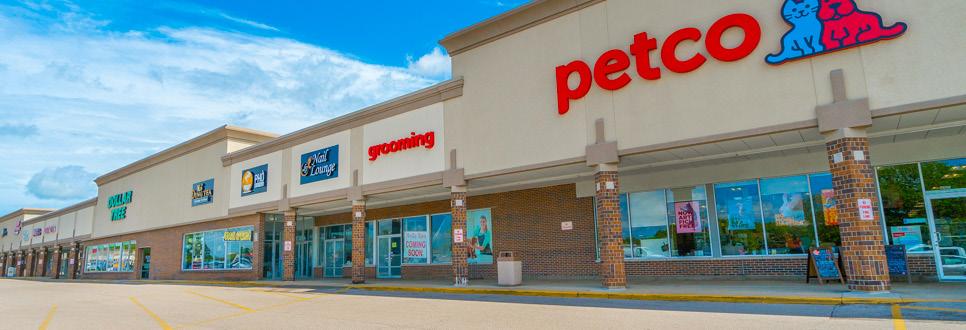


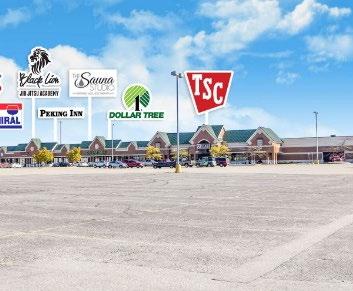
PRIME RETAIL SPACE AVAILABLE COUNTRY CORNERS CRYSTAL LAKE PALATINE PLAZA PALATINE CHARLES PLAZA HOFFMAN ESTATES STONY CREEK SOUTH ELGIN This 123,600 sq. ft. center is anchored by Petco, Dollar Tree, LaRosita Fresh Market and Savers located in the heart of retail corridor of the rapidly growing community of The central location and visibility of this 137,187 sq. ft. shopping center appeals to Tenants, including: Ace Hardware, Pete & Mac’s Pet Resort, Dollar Tree, Sherwin Williams, Dairy Queen, Brown’s Chicken and Elderwerks. Located on Palatine Road join Starbucks, Jewel Osco, Lou Malnati’s, ATI Physical Therapy, and Orangetheory Fitness in the premier community of Hoffman Estates. High visibility for both local and commuter traffic. Anchored by Jewel/Osco and Ace Hardware, at the intersection of Randall Road and McDonald Road in the fast-growing suburb of South Elgin. Nearby Retailers Kohl’s, Best Buy and Home Depot. ENDCAP AVAILABLE 3,000 sq. ft. ENDCAP 5,200 sq. ft. RESTAURANT LEXINGTON SQUARE ELMHURST 33,050 Sq. Ft. BOONE CREEK PLAZA MCHENRY 70,053 Sq. Ft. NORTH TOWN PLAZA NAPERVILLE 24,883 Sq. Ft. RIVER WEST PLAZA NAPERVILLE 27,200 Sq. Ft. NAPER RIDGE PLAZA NAPERVILLE 30,000 Sq. Ft. ELMHURST PLAZA ELMHURST 73,116 Sq. Ft. PRESTWICKE PLAZA ALGONQUIN 37,968 Sq. Ft. AVAILABLE 2,500 sq. ft. ANCHOR AVAILABLE 15,115 sq. ft. 1,495- 4,080 sq.ft. INLINE SHOPS Established in 1985, Highland Management Associates, Inc. is proud of the high-quality, prime locations, and high-occupancy level of the thirteen properties it developed, owns and manages in Cook, DuPage, Kane, and McHenry Counties. Not Shown: HIGHLAND MANAGEMENT ASSOCIATES, INC. 1 East 22nd Street, Suite 201, Lombard, Illinois 60148 630-691-1122 Fax: 630-691-8572 Visit us at: www.highlandmanagement.biz FREESTANDING OUTLOT RESTAURANT AVAILABLE 6,163 sq. ft. AVAILABLE 6,163 sq. ft.


