ISSN 2348-313X (Print)
International Journal of Life Sciences Research ISSN 2348-3148 (online)
Vol. 10, Issue 4, pp: (22-26), Month: October - December 2022, Available at: www.researchpublish.com

ISSN 2348-313X (Print)
International Journal of Life Sciences Research ISSN 2348-3148 (online)
Vol. 10, Issue 4, pp: (22-26), Month: October - December 2022, Available at: www.researchpublish.com
1Assistant professor Department of Mental health Nursing, Saveetha college of Nursing, SIMATS, Chennai, India.
2 B.SC(N)IV Year, Saveetha college of Nursing, SIMATS, Chennai, India.
DOI: https://doi.org/10.5281/zenodo.7267248
Published Date: 31-October-2022
Abstract: Comprehensive models of learning disorders have to consider both isolated learning disorders that affect one learning domain only, as well as comorbidity between learning disorders. However, empirical evidence on comorbidity rates including all three learning disorders as defined by DSM-V (deficits in reading, writing, and mathematics) is scarce. The current study assessed prevalence rates and gender ratios for isolated as well as comorbid learning disorders in a representative sample 50 childrens .A non-purposive sampling technique was used to select the samples. Self-structured questionnaires were used to collect demographic data. The study results show that Self- structured questionnaires were used to collect demographic data age (F=3.752, p=0.023) had statistically significant association with specific learning disorders among school going children at p<0.05 level.
Keywords: Prevalence, Specific Learning Disorder, Assess, Childrens.
The term Learning Disability came to use in 1960’s. Learning disability is also termed as specific academic skill disorder or specific learning disability. National Joint Committee on Learning Disability defines Learning Disability as A heterogeneous group of disorders manifested by significant difficulties in the acquisition and use of listening, speaking, reading, writing, reasoning or mathematical abilities
National Institute of Health (2008) stated that Learning Disabilityis a disorder that affects people’s abilityto either interpret what they see and hear or to link information from different part of the brain. Such difficulties extend to school work and can impede learning to read, write or do math.
Central Council of Health and Central Family Welfare Council declared that the teachers should be trained for observing and screeningthe students for defects and deviations fromnormal healthto maintaineffective surveillance and for providing supportive health education for the prevention of health problems by developing desirable health habits.
Children are mirror of a nation. They are our future and our most precious resources, the quality of tomorrow’s world and perhaps even its survival will be determined by the well-being, safety and the physical and intellectual development of children today. To predict the future of a nation, it has been remarked, one need not consult the stars; it can more easily and plainly be read in the faces of its children.
ISSN 2348-313X (Print)
International Journal of Life Sciences Research ISSN 2348-3148 (online)
Vol. 10, Issue 4, pp: (22-26), Month: October - December 2022, Available at: www.researchpublish.com
School age is the period between 6-12 years. Young scholars are emerging as creative persons who are preparing for their future role in society .The school years are a time of new achievement and new experiences. Individual children’s needs and preferences should be respected. Behavioral and emotional problems in school aged children can cause significant difficulties in children’s healthy development. For many children, they are also predictive of longer-term antisocial behaviors and mental health problems.
Some children show symptoms that are consistent with diagnoses of Anxiety, Depression, Oppositional Defiant Disorder (ODD), Attention-Deficit Disorder (ADHD), and Conduct Disorder (CD) (American Psychiatric Association, 1994).As well as causing significant distress for children and families during their childhood, children with emotional and behavioral problems face an increased risk of low self-esteem, relationship problems with peers and family members, academic difficulties, early school leaving, adolescent homelessness, the development of substance abuse issues and criminality.
A child personalityis considerably influenced bythe character and conduct of their parents. Surveys reveals that the parents are often more concerned about their behavior.
A quantitative descriptiveresearch approach was used to conduct the study in koyambedu. Final data was collected in the month of March 2022 children to assess the prevalence of specific learning disorders. Purpose of the study was explained to the subjects. The subjects were assured about anonymity and confidentiality of the information provided by them and writtenconsent was takenfromthe parents ofthe selected samples. Total50children were selected byusingnon – purposive sampling technique. The criteria for sample collection are children with symptoms of specific learning disorders. Children with the age group of 3-12years,Who are willing to participate in the study, children and their partents who can speak,write and read Tamil and English. The exclusion criteria for the sample selection are children who have been diagnosed with chronic disease , low cognition (Mentally Challenged). Children and their parents who are not willing to participate in this study were excluded The data collection period was done with prior permission from the institutions. Self- structured questionnaires were used to collect demographic data age (F=3.752, p=0.023) had statistically significant association with specific learning disorders among school going children at p<0.05 level
SECTION A: DESCRIPTION OF THE DEMOGRAPHIC OF SCHOOL GOING CHILDREN.
Table 1: Frequency and percentage distribution of demographic variables of school going children. N = 50
Demographic Variables
Age
Frequency (f) Percentage(%)
Under 5 9 18.0
6 – 10 years 28 56.0 10 – 15 years 13 26.0
Sex
Female 21 42.0 Male 29 58.0
Educational status
Primary school 28 56.0
Higher secondary 22 44.0
Religion
Hindu 33 66.0 Christian 11 22.0 Islam 6 12.0
Type of family
Nuclear family 41 82.0
Joint family 7 14.0
Extended 2 4.0
Dietary habits
Vegetarian 9 18.0
ISSN 2348-313X (Print)
International Journal of Life Sciences Research ISSN 2348-3148 (online) Vol. 10, Issue 4, pp: (22-26), Month: October - December 2022, Available at: www.researchpublish.com
Demographic Variables
Frequency (f) Percentage(%)
Non-vegetarian 41 82.0
Lifestyle
Active 39 78.0 Limited activity 9 18.0 Sedentary 2 4.0 Economic Status
Rich 2 4.0 Moderate 42 84.0 Poor 6 12.0
Did you ever have any difficulty with classroom work or subjects at school?
Yes 3 6.0 No 47 94.0
Did you have any difficulty learning spelling?
Yes 42 84.0 No 8 16.0
The table 1 shows that most of the school going children, 28(56%) were aged between 6 – 10 years, 29(58%) were male, 28(56%) were studying primary school, 33(66%) were Hindus, 41(82%) were non-vegetarian, 39(78%) had active lifestyle, 42(84%) belonged to moderate economic status, 47(94%) had no difficulty with classroom work or subjects at school and 42(84%) had difficulty in learning spelling.
SECTION B: ASSESSMENT OF LEVEL OF SPECIFIC LEARNING DISORDER AMONG SCHOOL GOING CHILDREN.
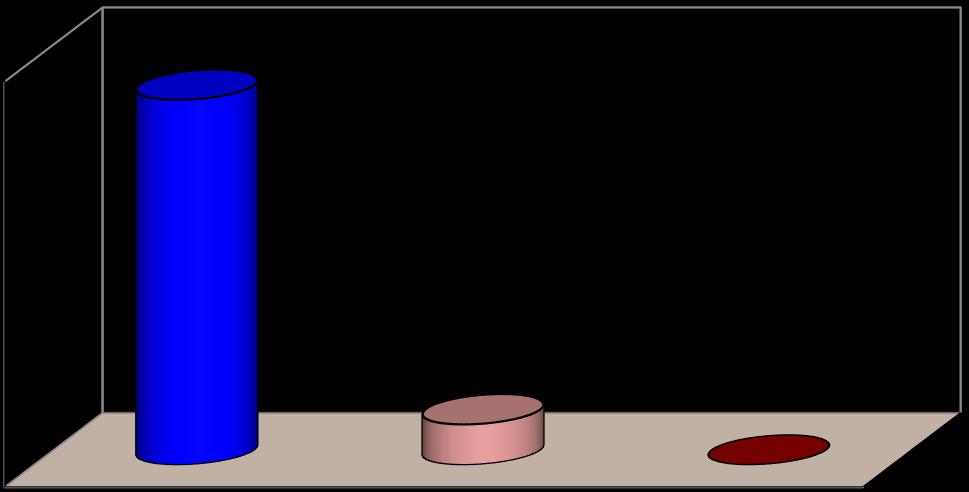
Table 2: Frequency and percentage distribution of level of specific learning disorder among school going children. N = 50
Level of Knowledge Frequency (F) Percentage (%)
Mild (<15) 45 90.0 Moderate (15 – 20) 5 10.0 Severe (≥21) 0 0
The above table2 shows that 45(90%)had mild level ofspecific learningdisorder and5(10%) had moderate level ofspecific learning disorder among school going children.
100
80
Percentage
60
40
20
90 10 0
Mild (<15) Moderate (15 – 20) Severe (≥21)
0
Mild (<15) Moderate (15 – 20) Severe (≥21)
Level of Specific Learning Disorder
Percentage distribution of level of specific learning disorder among school going children
ISSN 2348-313X (Print)
International Journal of Life Sciences Research ISSN 2348-3148 (online) Vol. 10, Issue 4, pp: (22-26), Month: October - December 2022, Available at: www.researchpublish.com
Table 3: Assessment of specific learning disorder scores among school going children. N = 50
Specific Learning Disorder Score
Minimum score 6.00 Maximum score 18.00 Median 10.00 Mean 10.06 S.D 2.59
The above table 3 shows that the means score of specific learning disorder scores among school going children was 10.06±2.59. The median score was 10.0 with minimum score of 6.0 and maximum score 18.0.
SECTION C: ASSOCIATION OF LEVEL OF SPECIFIC LEARNING DISORDER AMONG SCHOOL GOING CHILDREN WITH SELECTED DEMOGRAPHIC VARIABLES.
Table 4: Association of level of specific learning disorder scores among school going children with selected demographic variables. N = 50
Demographic Variables
Frequency Chi-Square & p-value
Age 2=1.648 d.f=2 p=0.439 N.S
Under 5 9 6 – 10 years 28 10 – 15 years 13
Sex 2=0.009 d.f=1 p=0.924 N.S
Female 21 Male 29 Educational status 2=4.365 d.f=1 p=0.037 S*
Primary school 28 Higher secondary 22 Religion 2=1.515 d.f=2 p=0.469 N.S
Hindu 33 Christian 11 Islam 6 Type of family 2=0.368 d.f=2 p=0.832 N.S
Nuclear family 41 Joint family 7 Extended 2
Dietary habits 2=0.015 d.f=1 p=0.902 N.S Vegetarian 9 Non-vegetarian 41 Lifestyle 2=0.237 d.f=2 p=0.888 N.S
Active 39 Limited activity 9 Sedentary 2
Economic Status 2=1.058 d.f=2 p=0.589 N.S
Rich 2 Moderate 42 Poor 6
ISSN 2348-313X (Print)
International Journal of Life Sciences Research ISSN 2348-3148 (online) Vol. 10, Issue 4, pp: (22-26), Month: October - December 2022, Available at: www.researchpublish.com
Demographic Variables Frequency Chi-Square & p-value
Did you ever have any difficulty with classroom work or subjects at school?
2=0.355 d.f=1 p=0.552 N.S Yes 3 No 47
Did you have any difficulty learning spelling?
Yes 42 No 8
*p<0.05, S – Significant, N.S – Not Significant
2=1.058 d.f=1 p=0.304 N.S
The table 4 shows that the demographic variable educational status ( 2=4.365, p=0.037) had shown statistically significant association with level of specific learning disorder scores among school going children at p<0.05 level and the other demographic variables had not shown statistically significant association with level of specific learning disorder scores among school going children.
The present study assessed the prevalence of specific learning disorder among school – going children at Koyambedu. Based on statistical findings, it is evident that school children had mild level of learning disorders which is a matter of concernand necessarycounselingand medical advice has to be given to the parents, teachers and concerned school children.
[1] Abdo Hasan AL-Qadri, et al., (2021). The prevalence of the academic learning difficulties: An observation tool. Heliyon 7, e08164.
[2] Arun, Priti, et al., (2013). Prevalence of specific developmental disorder of scholastic skill in school students in Chandigarh, India. The Indian Journal of Medical Research, Volume 138, Issue 1, p 89-98.
[3] Deenu Chacko, Karunakaran Vidhukumar (2020). The Prevalence of Specific Learning Disorder among School-going Children in Ernakulam District, Kerala, India: Ernakulam Learning Disorder (ELD) Study. Indian Journal of Psychological Medicine, Volume 42, Issue
[4] Goel U. Prevalence of selected learning disabilities among primary schoolchildren through primary school teachers: A descriptive survey. Indian J Psy Nsg;18:23-8.
[5] Lakshmi K, Nagamani D and Anupama (2020). Assessment of specific learning disabilities in school students of Chittoor district: A cross sectional study. European Journal of Molecular & Clinical Medicine ISSN 2515-8260 Volume 07, Issue 11.
[6] Liss Maria Scaria, Deepa Bhaskaran and Babu George (2022). Prevalence of Specific Learning Disorders (SLD) Among Children in India: A Systematic Review and Meta-Analysis. Indian Journal of Psychological Medicine, Volume XX, Issue X.
[7] Shah, C. G., &Buch, P. M. (2019).Prevalence of specific learningdisabilities amongGujarati mediumprimaryschool children. Indian Journal of Child Health, 6(6), 283-286. https://doi.org/10.32677/IJCH.2019.v06.i06.006.
[8] Shivani Rao, et al., (2017). Prevalence of dyslexia among school children in Mysore. International Journal of Medical Science and Public Health, Vol 6, Issue 1.
[9] Susanta Kumar Padhy, et al., (2015). Prevalence and Patterns of Learning Disabilities in School Children. Indian J Pediatr DOI 10.1007/s12098-015-1862-8.
[10] Virudhagirinathan B.S (2016). A study on the prevalence of learning difficulty in school children and awareness of learning difficulty among parents and teachers. Thesis submitted to The Tamil Nadu Dr.M.G.R.Medical University, Chennai.