ISSN 2348-1218 (print)
International Journal of Interdisciplinary Research and Innovations ISSN 2348-1226 (online) Vol. 8, Issue 1, pp: (157-162), Month: January - March 2020, Available at: www.researchpublish.com

ISSN 2348-1218 (print)
International Journal of Interdisciplinary Research and Innovations ISSN 2348-1226 (online) Vol. 8, Issue 1, pp: (157-162), Month: January - March 2020, Available at: www.researchpublish.com
1
Talaka, A.,2
3
D. F. Cherry, J. P. TukuraDepartment of Agricultural Technology, Federal Technology, Taraba State.
Abstract: Field experiment was conducted at the Teaching and Research Farm of the Department of Agricultural Technology, Federal Polytechnic Bali, Taraba State in 2018 cropping season with the view to find out the influence of spacing on the growth and yield parameters of soybean. The experiment was carried out with four treatments (35 x 20 cm, 40 x 25 cm, 45 x 30 cm and 50 x 35 cm) replicated four times. Result obtained showed that spacing have influence on the growth and yield parameters of soybean. The results showed that wider spacing or low plant population densities (45 x 30 cm and 50 x 35 cm) encourages the growth and yield parameters of soybean in Bali. This was because the plant have enough space to utilize growth resources very well leading to good growth and finally the yield. All the parameters measured performed better at spacing of 50 x 35 cm followed by 45 x 30 cm. Therefore, considering the spacing that perform better (50 x 35 cm) in this research, farmers should adopt wider spacing with appropriate weed control for good growth and yield parameters of soybean in Bali, Taraba State and its environs.
Keywords: Growth, Evaluation, Parameters, Row spacing, Soybean.
Soybeans (Glycine max (L.) Merrill), belongs to the family leguminoseae. It is believed to have originated in Eastern Asia, probably in North and Central China but now have spread in many parts of the world including Nigeria (F. A. O., 1988 and F. A. O., 2001). It is herbaceous annual legume, usually erect, bushy and rather leafy which originated in China The crop has a relatively short growth duration due to its sensitivity to short day length in the tropics (Norman et al., 1995). Soybeans is widely distributed in most parts of the world, the crop has a lot of potential in Africa (Steve and Jonathan, 2001). It is frost sensitive, thrive best on sandy or clay loams and alluvial soils of good fertility and the optimum soil PH for soybean cultivation ranges from 6.0-6.5 (Adetiloye et al., 2000).
Soybeans is primarily an industrial crop cultivated for oil and protein. Despite the relatively low oil content of the seed, it is still the largest source of edible oil and account for roughly 50% of the total oil seeds production of the world (F. A. O., 1988). It is generally known that the seed of soybean contains the highest and richest protein among oil cultivated legumes (F. A. O., 1989). Worldwide interest and attention in soybean is mainly due to its high nutritional value and seed protein content (Tiamigu and Idowu, 2001). Soybean has a composition of protein content of over 40%, edible vegetable oil content of 20 5%, carbohydrates content of about 30 5%, a total sugar content of about 10% and an ash content of about 5% (IITA, 1993). Apart from it primarily use as source of oil, some soybeans products enhanced nutritional qualities have been developed and are available in the market. These incudes soy milk (100 % soybeans), soy oil (100 % soybeans), biscuits (100 % soybeans) and cassoy (30 % soybeans) (Di et al., 1996).
Weed interference have identified as the major factor responsible for low seed yield of crops (Adeyemo et al., 1992). The constraints imposed by weeds to crops has been well documented (Jain et al., 1985). The traditional methods of weeds control, namely: hoe weeding is the commonest method of weed control by farmers in the Sudan savanna zone of Nigeria.
ISSN 2348-1218 (print)
International Journal of Interdisciplinary Research and Innovations ISSN 2348-1226 (online) Vol. 8, Issue 1, pp: (157-162), Month: January - March 2020, Available at: www.researchpublish.com
This method is not only labour intensive, expensive and strenuous, but can also cause damage to the growing branches and new roots of plants. In addition to high cost, labour availability is uncertain thus making timeless of weeding difficult to attain, leading to greater yield loss (Adigun and Lagoke, 2003)
Weeds are more harmful pests of field crops as compared to insects, fungi, rodents, storage pests etc. as far as their losses to crop produce are concerned (Walia, 2010). Weeds compete on growth factors like fertilizers, moisture, space, light etc. with crops throughout their life period. Depending upon the type and density of these weeds, a tremendous loss is caused to the crop in which these are associated (Jayakumar and Jagannathan, 2007).
The maintenance of high crop yield under intensive cultivation is possible only through the use of appropriate spacing (Rowland, 1993). Wikipedia (2006) reported that plant population and spacing have significant effects on grain weight, grain size and weight depend partly on environmental condition during grain filling. Raemaekers (2001) reported that optimal plant density should be adjusted to local conditions and type of varieties to be grown. The objective of increasing plant density is to provide minimum space for weeds to grow due to overcrowding of crop plants resulting into increased competitive potential by the crop (Walia, 2010).
The main competition factors can be identified as light, water and nutrients for plants, the competition between the plants can be regulated by the optimum plant number per unit area. Planting density is an important factor for soybean growth and seed yield. When planting density is high, the branching of each plant is depressed and the number of the lateral stem decrease. In addition, under high planting density the competition for photosynthesis and nutrient absorption among plants become severe and the stem grows tall and thin. Generally, soybean grown in high plant density produces a higher yield than those grown in low density (Liu et al., 2010, Rahman and Hossain, 2011, Zhou et al., 2011, Bruns, 2011)
The production of a crop requires a particular set of conditions in order to maximize growth and yield. These conditions includes time of cultivation, time of planting, spacing, irrigation, fertilizer application and use of herbicides (Biswas and Solakhe, 2001)
In view of the rapidly expanding population in Nigeria and the general acceptability of soybean as a popular stable food among small scale farmers and as source of raw materials for our industries, there is the need to increase production through adequate spacing to ensure optimal production. Hence the need for this research work with the following objectives:
1. To determine the effect of varying row spacing on growth and yield parameters of soybeans
2. To determine appropriate row spacing on the growth and yield of soybeans
Field experiment was conducted at the Teaching and Research Farm of the Department of Agricultural Technology, Federal Polytechnic Bali, Taraba State in 2018 cropping season. The study area is located within latitude 7o 12’ to 9o 00’ N of the equator and longitude 10o 00’ to 12o 00’ E of the meridian (Atlas, 2006). It has land mass of about 10,000 M2 and lies within the guinea savanna ecological zone of Nigeria. The annual rainfall ranges from 750 mm to 1100 mm. the temperature ranges between 22o c to 40o c. the soil is dominantly of ferruginous tropical type that lies on sandy parent materials (Dada et al., 2006).
The land was ploughed using tractor and was harrowed using tractor and leveled using hoe. The experimental field was marked out into 16 main plots of 2 m x 12 m including the walk ways and 80 sub plots of 2 m x 2 m each giving the total land area of 26 m x 26 m. Walk ways of 1 m was created between the main plots and sub plots. Sowing of crop was by direct seeding. Three (3) seeds was sown per hole and later thin to 2 plants per stand at three weeks after sowing. Post emergence herbicides was applied four (4) weeks after sowing to control weeds.
ISSN 2348-1218 (print)
International Journal of Interdisciplinary Research and Innovations ISSN 2348-1226 (online) Vol. 8, Issue 1, pp: (157-162), Month: January - March 2020, Available at: www.researchpublish.com
The experimental design used was split plot. The main treatment was four (4) row spacing (35 cm x 20 cm, 40 cm x 25 cm, 45 cm x 30 cm and 50 cm x 35 cm) and sub plot treatment was four (4) rates of starforce and bentaforce (0 kg a. i. /ha, 4 kg a. i. /ha, 6 kg a. i. /ha and 8 kg a. i. /ha) The treatments were replicated four times. The variety used was tumako cultivar.
Plant height= Plant height was measured from the base of the stem to the tip of the plant. This was done at an interval of 3 weeks from 10 stands in a plot beginning from 30 days after sowing and the data collected was averaged.
Number of leaves per plant= Number of leaves per plant was counted per plant from 10 stands in a plot beginning from 30 days after sowing and data collected was averaged.
Number of branches per plant= number of branches per plant were counted per plant from 10 stands per plot beginning from 30 days after sowing and the average was determined.
Number of pods per plant= Number of pods per plant was obtained by counting the pods /plant from 10 stands in a plot and the number obtained was averaged to get the number of pods per plant.
Pods weight per plant= Pods weight per plant was determined by weighing the pods per plant from 10 stands per plot and the average was determined.
Hundred seed weight= hundred seed weight was weighed on electrical weighing balance per plot and the weight obtained was recorded in grams.
Data collected were subjected to analysis of variance (ANOVA) using statistical model of “Factorial Designs-Explicitly Assessing Interactions. The means were separated using Least Significant Difference (LSD) at 5% level of probability.
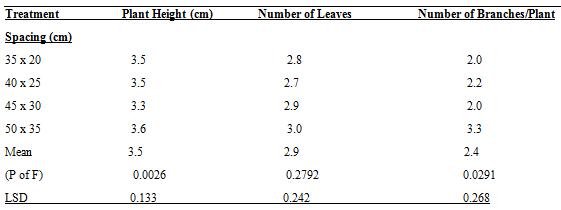
Table 1 shows effect of spacing on growth parameters of soybean in 2018 cropping season. Effect of spacing on plant height shows that spacing of 50 x 35 cm produced the tallest plants with the value of 3.6 cm. the shortest plants were obtained at a spacing of 45 x 30 cm with the value of 3.3 cm. the tallest plants obtained at a spacing of 50 x 35 cm could be as a result of wider spacing of 50 x 35 cm could be as a result of wider spacing which leads to less competition between the plants. The competition between the plants can be regulated by the optimum plant number per unit area (Liu et al., 2010). Rahman and Hossain (2011) reported that planting density is an important factor for soybean growth and seed yield.
Effect of spacing on number leaves per plant in 2018 cropping season are presented in Table 1. Effect spacing on number of leaves in 2018 cropping season shows that spacing of 50 x 35 cm produced more number of leaves followed by spacing of 45 x 30 cm with the values of 3.0 and 2.9 respectively. The highest number of leaves obtained at a spacing of 50 x 35 cm was as a result of optimum spacing for soybean growth. Soybean produced more number of leaves at low plant density as reported by Hosseini et al., (2001) that soybean produced more number of branches per plant at low plant densities subsequently more leaves.
Effect of spacing on number of branches per plant in 2018 cropping season are presented in Table 1. Effect of spacing on number of branching in 2018 cropping season shows that spacing of 50 x 35 cm produced more branches with value of 3.3. More branches produced at 50 x 35 cm was because plants experienced less competition leading to healthy growth of plants. Leyla et al., (2016) in their findings reported that soybean produced more branches per plant at low plant densities compared with the high plant densities. At low plant density, existing plant developed more branches because of reduced in competition. Cox and Cherney (2011) reported that when plant density is high, the branching of each plant depressed and the number of the lateral stem decreased.
ISSN 2348-1218 (print)
International Journal of Interdisciplinary Research and Innovations ISSN 2348-1226 (online) Vol. 8, Issue 1, pp: (157-162), Month: January - March 2020, Available at: www.researchpublish.com
Key:
LSD=Least Significance Difference
Cm=Centimeter
Table 2 shows effect of plant spacing on yield parameters of soybean in 2018 cropping season. Effect of spacing on pod weight per plant in 2018 cropping season shows that spacing of 50 x 35 cm produced heavier pod weight per plant with the value of 5.0 g followed by spacing of 45 x 30 cm. heavier pod weight produced by spacing of 50 x 35 cm was as a result of wider spacing which encourages the production of bigger seeds in the pods because of less competition among the plants. Leyla et al., (2016) reported that the pod number increase in the low plant density was a result of extra branching. The number of pods and branches per plant tended to decrease with increased plant population density (Liu et al., 2010).
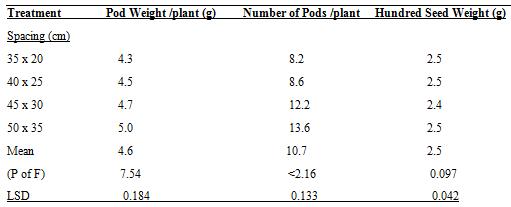
Effect of spacing on number of pods per plant in 2018 cropping season are presented in Table 2. Effect of spacing on number of pods in 2018 cropping season shows that spacing of 50 x 35 cm produced more pods per plant followed by spacing of 45 x 30 cm with the value of 13.6 and 12.2 respectively. This findings agrees with findings of Leyla et al., (2016) who stated that when planting density is high, the branching of each plant is depressed and the lateral stem and pod number per plant decrease.
Effect of spacing on hundred seed weight in 2018 cropping season are presented in Table 2. Effect of spacing on hundred seed weight in 2018 cropping season shows that spacing of 45 x 30 cm produced the less 100 seed weight with the value of 2.9 g. all other spacing produced the same weight of 2.5 g. the differences obtained from spacing of 45 x 30 cm could be as a result of other factors rather than spacing that affect the plants treated with different spacing. Similar result was obtained by Leyla et al., (2016), Worku and Astatkie, (2011) who reported that plant population densities were not affected on 100 seed weight at different planting pattern in soybean.
Table 2: Effect of spacing on yield parameters during 2018 cropping season in Bali, Taraba State
Key: LSD= Least significance difference
Cm= centimeter
ISSN 2348-1218 (print)
International Journal of Interdisciplinary Research and Innovations ISSN 2348-1226 (online) Vol. 8, Issue 1, pp: (157-162), Month: January - March 2020, Available at: www.researchpublish.com
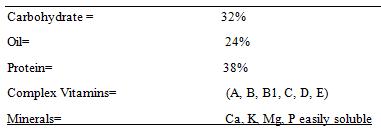
Table 3 shows nutritional value of soybean in Bali, Taraba State. The table shows that soybean grown in Bali contained the following nutritional values: Carbohydrate= 32%, oil= 24%, protein= 38%. Also, complex vitamins like A, B, B1, C, D and E are present and minerals obtained in soybean in Bali are: Ca, K, Mg and P. this indicated that soybean have nutritional values required for human consumption and industries. Leyla et al., (2016) reported that the differences between the plant densities for the oil yield comes from seed yield differences.
The results of this study demonstrate the benefits of wider spacing or low plant population densities over the narrow spacing or high plant densities. The results indicated that wider spacing of 50 x 35 cm in Bali, Taraba State is the optimum spacing for good growth and yield parameters of soybean. This was as a result of less competition between plants when weeds were properly controlled because wider spacing encourages the germination of weeds. All the parameters measured performed better with wider spacing. Because of this, small holder farmers should adopt wider spacing (45 x30, 50 x 35 cm) in Bali considering in mind proper weed control should be adopted to prevent plants competing with weeds.
[1] Adetiloye, P. O., Okeleye, K. A. and Tayo, T. O. (2000). Effects of seed inoculation with Bradyrhizobium japonicum on nodulation, growth and yield of soybean. Tropical oil seed journal, 5: 22-29.
[2] Adeyemo, M. O., Ojo, A. O. and Gungula, D. T. (1992). Effect of population density on some agronomic traits and seed yield of sesame (Sesamum indicum L.) in Southern Guinea Savanna Environment. Tropical oil seed Journal. 1: 35-42.
[3] Adigun, J. A. and Lagoke, S. T.O. (2003). Weed control in transplanted rain-fed and irrigated tomatoes in the Nigerian Savanna. Nigerian Journal of weed Science. 16: 23-29.
[4] Atlas, (2006). Macmillan Nigerian secondary School atlas. Macmillan Nigerian Publishers LTD. Pp 22-25
[5] Biswas, P. K. and Solakhe, V, M. (2001). Effect of planting date, intensity of tiller separation and plant density on the yield of transplanted rice. Asian Inst. of Tech. P. O. Box Klong Luang Pathum. Thai.12120, Thailand. Pp. 3-5.
[6] Bruns H. A. (2011). Planting Date, Rate and Twin-Row vs Single-Row soybean in the Mid-South. Agronomy Journal. 103 (5) 1308-1313.
[7] Cox, W. J. and J. H. Cherney (2011). Growth and Yield Responses of Soybean to Row Spacing and Seeding Rate. Agronomy Journal 03 (1): 123-128.
[8] Dada, F. O. A., Garba, M. J. and Ijeoma, A. (2006). Macmillan Nigerian Secondary Atlas. Macmillan Nigerian Publishers LTD. Pp. 22-25.
[9] Di, R. V., Purcell, G. C. and Gabriel, S. (1996). Production of Transgenic Soybean lines expressing the bean pod mottle virus coat protein precursor gene. Plant cell report (15) 746-750.
[10] F. A. O. (2001). World Production and United State World trade in soybeans. American Farm Bureau Federation, March 15th, 2001.
[11] F. A. O. (1989). Soybean Production in the Tropics. Annual Report. Pp. 14-16.
ISSN 2348-1218 (print) International Journal of Interdisciplinary Research and Innovations ISSN 2348-1226 (online) Vol. 8, Issue 1, pp: (157-162), Month: January - March 2020, Available at: www.researchpublish.com
[12] F. A. O. (1988). Food and Agricultural Organization of the United Nations. Commerce year book, F. A. O., Rome.
[13] Hosseini, N. M., R. H. Ellis and B. Yazdi-Samadi (2001). Effects of Plant Population Density on Yield and Yield Components of eight Isolines of CV Clark (Glycine max L.). Journal of Agricultural Science Tech. 3: 131-139.
[14] International Institute of Tropical Agriculture (IITA) (1993). Archival Report (1988-1992), Crop Improvement Division, Grain Legume Improvement Program part lll, Soybean Biological Fixation. Pp. 10
[15] Jain, G. L., Singh, S. M., Sahn, M. P. and Sharma G. L. (1985). Sesame production in Rajasthan. Constraint and opportunities. In: Srivastava, H. C., Bhaskarana, S., Vatsya, B. and Menon, K. K. G. (Eds). Oil Seed production constraint and opportunities. New Delhi, Bombay, Calcuta. Pp. 181-198.
[16] Jayakumar, R. and Jagannathan, R. (2007). Weed Science Principles. Kalyani Publishers, New Delhi, India. Pp. 85128.
[17] Leyla, G., Halil, B. and Halis A. (2016). The effect of twin-row planting pattern and plant population on seed yield and yield components of soybean at late double-cropped planting in Cukurova Region. Turkish Journal of Field Crops. 21 (1) 56-65.
[18] Liu, B., X. Liu, C. Wang, J. Jin, S. J. Herbert and M. Hashemi (2010). Responses of Soybean Yield and Yield Components to Light Enrichment and Plant Density. International Journal of Plant production. 4 (1): 1-9.
[19] Norman, M. J. T., Pearson, C. J., and Searle, P. G. E. (1995). Tropical Food crops in their environment. Second edition, Cambridge University Press.
[20] Raemaekers, R. H. (2001). Crop Production in the Tropical Africa. 2nd Edition, Goekint Graphics, NV Belgium.
[21] Rahman, M. M. and Hossain, (2011). Plant Density Effects on Growth, Yield and Yield Components of two soybean varieties under Equidistant planting arrangement Asian Journal of Plant Sciences. Vol. 10 (5)278-286.
[22] Rowland, J. R. J. (1993). Dry-land farming in Africa. 3rd Edition. Macmillan press London.
[23] Steve, O. A. and Jonathan, J. A. (2001). Correlation Studies on Melordogyne incognita induced root galls and some growth parameters of four elite varieties of Glycine max (L.) Merrill. Tropical Oil Seed Journal, 6: 93-97.
[24] Tiamigu, S. A. and Idowu, A. A. (2001). Economics of resource use among small scale soybean farmers in Niger State. Tropical Oil seed Journal, 6: 71-75.
[25] Walia, (2010). Weed Management. Kalyan publishers, New Delhi, India. Pp. 20-27
[26] Wikipedia (2006). The Free Encyclopedia E: 1% 20 wikipedia.
[27] Worku, M. and Astatkie, T. (2011). Row and Plant Spacing Effects on Yield and Yield components of Soybean varieties under Hot Humid Tropical Environment of Ethiopia. Journal of Agronomy and Crop Science, 197: 6774.
[28] Zhou, X. B., Chen, Y. H. and Ouyang, Z. (2011). Row spacing Effect on Land Area Development, Light Interception, crop Growth and Grain Yield of Summer Soybean Crops in Northern China. African Journal of Agricultural Research, 6 (6) 1430-1437.