International Journal of Electrical and Electronics Research ISSN 2348-6988 (online) Vol. 10, Issue 3, pp: (10-19), Month: July - September 2022, Available at: www.researchpublish.com
IMPROVING THE EFFICIENCY OF LONGDISTANCE POWER TRANSMISSION SYSTEM USING THYRISTOR CONTROLLED SERIES COMPENSATOR DEVICE
Okenna Osmond1, F. U. Iloh2
Department of Electrical and Electronic, Faculty of Engineering, Enugu State University of Science & Technology
Enugu State University of Science & Technology Enugu State Nigeria1, 2
DOI: https://doi.org/10.5281/zenodo.7085447
Published Date: 16-September-2022
Abstract: Transmission infrastructure in Nigeria is plagued with weak power wheeling capability. Large amount of electrical power is transmitted over very long distances to load centers through weak transmission lines. This research therefore aims at improving the efficiency of long-distance transmission lines using FACTS devices. To improve on the efficiency of the long-distance transmission line, thyristor-controlled series compensation was used in this work, as the technique offers high efficiency on transmitting line voltage and current. The IEEE 9 Bus Power System was used as a case study. MATLAB software was the tool used in running the network with and without TCSC. The system was simulated and their transient performances were thoroughly analyzed. The load flow simulation was carried out on a faulty IEEE 9 bus system. Figure 4.1 and Table 4.1 show the result of the simulation. Bus 5 was detected to violate the voltage limit of 0.95 < V< 1.05 p.u. having a voltage magnitude of 0. 9488p.u, this indicates that there was power system instability while when the TCSC device is incorporated into the network, the voltage at bus 5 was regulated from 0.9488 p.u. to 1.01 p.u. and other buses that experienced voltage improvement. The result when compared without and with TCSC, shows that total active power Loss without TCSC was 348.6856MW while that with TCSC was 322.53MW. Also, the reactive power loss without and with TCSC was 146.8526MW and 32.96336MW respectively. Therefore, the percentage of power system improvement is 7.5% when TCSC was incorporated.
Keywords: Flexibility, Transmission, Electricity, FACTS, Thyristor-Controller, Series, Voltage.
I. INTRODUCTION
Quality of service has remained a major topic in the Nigerian power system as everyday final consumers either complain of no power supply or poor quality when supplied. It is no longer news that most of the equipments either at the generation, transmission or distribution section of the power system network are aged, and have contributed mainly to the poor quality of power supplied. Simplyreplacingallthemachineswouldhavebeentheidealthingtodo,butthecostimplication,especiallyatthis economic recession period makes such suggestion practically not possible for now. The application of Flexile AC transmission Systems (FACTS) have been proposed over time to deploy and solve this problem (Leite et al; 2014). This FACTS device for optimizing and enhancing the quality of power supply was first initiated by (Abouzari and Peman, 2012) and are of various types such as the static var compensator, unified power flow controller, Thyristor Controlled Series Compensator
International Journal of Electrical and Electronics Research ISSN 2348-6988 (online)
Vol. 10, Issue 3, pp: (10-19), Month: July - September 2022, Available at: www.researchpublish.com
(TCSC) among others. The TCSC was singled out due to its low cost, but very effective power control capacity using power electronic components. Various works which have used the TCSC for the control of the power flow stability includes Pau et al. (2012) used TCSC to improve the quality of power supply on 330KV transmission network and achieved average voltage stability margin of 0.9899p.u. Xie et al. (1998) applied the TCSC to control the nonlinear power flow formulated by Newton Raphson. The result achieved good stability on the 330KV transmission network. Hans et al. (2011) solved the problem o transient stability on power system network using TCSC and achieved power flow quality with average voltage stability margin of 0.9864p.u. Thomas and Doug (1993) presented an overview of FACTS components on power network and identified the TSCS as the capable of instability control. (Ying et al., 2010 and Furerte, 2000) equally applied the TSCS for stability control of power system network and achieved good performance. However solution has not been obtained which considered the stability of the Nigerian 330KV transmission network considering the use of TCSC. Hence this research proposed to remodel and improved the Nigerian power system network using the TSCS and achieved good quality of service.
II. LITERATURE REVIEW
Patil et al., (2020) presented a study on power loss minimization in transmission system using particle swarm optimization and Salp Swarm algorithm, this study presents a power loss minimization framework for Thyristor Controlled Series Compensator with the application of met heuristic methods used for the minimization of the power loss. This system uses particle swarm optimization (PSO) and Salp Swarm Algorithm (SSA) for determination of the optimal location of TCSC bus test systems. The result of the study suggests that SSA has the best performing algorithm when compared with PSO devices.
Nwohu et al., (2016) presented a study onoptimal placement of thyristor-controlled series compensation (TCSC) on Nigeria 330kV transmission grid to minimize real power losses. This work adopted Genetic Algorithm (GA) for effective optimizationfortheplacementofTCSContheNigeria330kVgridsysteminordertocontrolpowerfloweasilyandimprove the voltage on the bus. The result of this study shows that the overall power losses has been reduced from the initial 2.1% to 1.5%.
Ratra et al., (2016) researched on the optimal placement of thyristor-controlled series compensators for sensitive nodes in transmission system using voltage power sensitivity index. The study proposes of a voltage power sensitivity index (VPSI) which is used for the identification of optimal nodes for the placement of TCSCs. Taguchi Method (TM) was applied for the improvement of the voltage stability margins and voltage profile of the system and also to find the size of TCSCs to improve so as to cope up with the problem of the line congestion.
Abdel-Moamen and Padhy (2003) presented a study on power flow control and transmission loss minimization model with TCSC for practical power networks. The work developed an optimal power flow (OPF) model for the th analysis of thyristor-controlled series compensator for practical power networks application using Newton’s optimization technique. The main objective of this study is to minimize losses which occur while controlling the power flow of specific transmission lines. The result of this study suggested that the algorithm can be applied in to a larger system without it suffering computational difficulty.
Abdullah et al., (2011) presented a study on thyristor-controlled series compensator planning using evolutionary programming for transmission loss minimization for system under contingencies, this study proposes the of static voltage stability index (SVSI) for placement of thyristor-controlled series compensator and using Evolutionary Programming (EP) technique for finding the optimal size of the TCSC used on contingency situations. The result of the work was compared with the results obtained from artificial immune system (AIS) technique in order to highlight its merit, and it shows that the EP technique is more feasible for loss minimization operations in power system networks.
III. METHODOLOGY
The methodology employed for the development of this research employed load flow analysis to study the behavior of the 9Bus 330kv transmission network considering the frequency, real power, reactive power, and voltage magnitude and phase angle using Newton Raphson algorithm because of its fast convergence and accuracy with a small number of iterations. This was achieved using Simulink, while the readings were collected and analyzed based on the Nigerian Electricity Regulation Commission (NERC) standard of + 5% (1.00000p.u) for analysis of power system stability. Then the unstable buses were corrected using theTCSC which is a series-controlled capacitive reactance device which can provide continuous control of power on the AC lines over a wide range. TCSC functioning can be modelled as shown in Figure 1; TCSC injects
International Journal of Electrical and Electronics Research ISSN 2348-6988 (online)
Vol. 10, Issue 3, pp: (10-19), Month: July - September 2022, Available at: www.researchpublish.com
voltage in series with the line, and either supplies or consumes variable reactive power during operation. A series inserted voltage (SIV) and its phase angle are introduced into the TL. The SIV is 10% of the nominal voltage of the transmission line (TL). MATLAB/SIMULINK program was used to perform system implementation and then test the bus for stability analysis.
DEVELOPMENT OF THE TCSC
A TCSC is a series-controlled capacitive reactance that can provide continuous control of power on the ac line over a wide range. The principle of variable-series compensation is simply to increase the fundamental-frequency voltage across a fixed capacitor (FC) in a series compensated line through appropriate variation of the firing angle. This enhanced voltage changes the effective value of the series-capacitive reactance. A simple understanding of TCSC functioning can be obtained by analyzing the behavior of a variable inductor connected in parallel with an FC. The equivalent impedance, Zeq, of this LC combination is expressed as, the impedance of the FC alone, however, is given by −j(1/ ωC). If ωC−(1/ ωL) > 0 or, in other words, ωL> (1/ ωC), the reactance of the FC is less than that of the parallel-connected variable reactor and that this combination provides a variable-capacitive reactance are both implied. Moreover, this inductor increases the equivalentcapacitive reactance of the LC combination above that of the FC. If ωC − (1/ ωL) c 0, a resonance develops those results in an infinite-capacitive impedance is obviously unacceptable condition. If, however, ωC − (1/ ωL) < 0, the LC combination provides inductance above the value of the fixed inductor. This situation corresponds to the inductive-vernier mode of the TCSC operation.
In the variable-capacitance mode of the TCSC, as the inductive reactance of the variable inductor is increased, the equivalent-capacitive reactance is gradually decreased. The minimum equivalent-capacitive reactance is obtained for extremely large inductive reactance or when the variable inductor is open-circuited, in which the value is equal to the reactance of the FC itself. The behavior of the TCSC is similar to that of the parallel LC combination. The difference is that the LC-combination analysis is based on the presence of pure sinusoidal voltage and current in the circuit, whereas in the TCSC, because of the voltage and current in the FC and thyristor-controlled reactor (TCR) are not sinusoidal because of thyristor switching.
Bypassed Thyristor Mode:
In this bypassed mode, the thyristors are made to fully conduct with a conduction angle of 180. Gate pulses are applied as soon as the voltage across the thyristors reaches zero and becomes positive, resulting in a continuous sinusoidal of flow current through the thyristor valves. The TCSC module behaves like a parallel capacitor–inductor combination. However, the net current through the module is inductive, for the susceptance of the reactor is chosen to be greater than that of the capacitor. Also known as the thyristor-switched-reactor (TSR) mode, the bypassed thyristor mode is distinct from the bypassed-breaker mode, in which the circuit breaker provided across the series capacitor is closed to remove the capacitor or the TCSC module in the event of TCSC faults or transient over voltages across the TCSC. This mode is employed for control purposes and also for initiating certain protective functions. Whenever a TCSC module is bypassed from the violation of the current limit, a finite-time delay, T delay, must elapse before the module can be reinserted after the line current falls below the specified limit.
Thyristor Mode:
In this mode, also known as the waiting mode, the firing pulses to the thyristor valves are blocked. If the thyristors are conducting and a blocking command is given, the thyristors turn off as soon as the current through them reaches a zero crossing. The TCSC module is thus reduced to a fixed-series capacitor, and the net TCSC reactance is capacitive. In this mode, the dc-offset voltages of the capacitors are monitored and quickly discharged using a dc-o
The effective impedance of the TCSC is given by (Paul et al., 2012);
Where XL (α) is the variable impedance of TCR which can be taken from equation (2) that is
Where XL=ωL and α is the delay angle measured from the crest of the capacitor voltage or the zero crossing of the line current
International Journal of Electrical and Electronics Research ISSN 2348-6988 (online) Vol. 10, Issue 3, pp: (10-19), Month: July - September 2022, Available at: www.researchpublish.com
iS(t) = Transmission line current which is modelled as an external current source and assumed to be sinusoidal. iT(t) = Thyristor-valve current, u = switching variable when u =1, the thyristor is conducting i.e. switch S is closed when u = 0, the thyristor is blocked i.e switch S is open, C = Fixed capacitor used in parallel with TCR circuit, L = Inductance used in series with Thyristor bidirectional switch, Vc(t) = voltage across the capacitor, C=The current through the fixed capacitor C is expressed as (Paul et al., 2012); Cdvc dt =is(t) ir(t).u (3)

The current through thyristor is given by: LdiT dt =vC.u (4)
Let the line current iS(t) be represented by: iS(t) =Im coswt (5)
Model of the TCSC for power flow control
As Thyristor Controlled Series Capacitor (TCSC) will control the power flow in the transmission line of a large electrical network, here we modelled the TCSC as a variable reactance which varies in terms of firing angle of a thyristor. (By Murali et al 2010).
Figure 1: TCSC connected between two buses k and m
The fundamental frequency equivalent reactance XTCSC of the TCSC which is already derived which is given as (Paul et l., 2012);
Xtcsc = Xc + C1{2(π α)+sin[2(π α)]} C2cos2(π α){w̆tan[w̆((π α)] tan(π α)} (6)
The TCSC active and reactive power equations at bus k are (7) (8)
Where: (9) (10) (11)

International Journal of Electrical and Electronics Research ISSN 2348-6988 (online) Vol. 10, Issue 3, pp: (10-19), Month: July - September 2022, Available at: www.researchpublish.com
Where: (12)
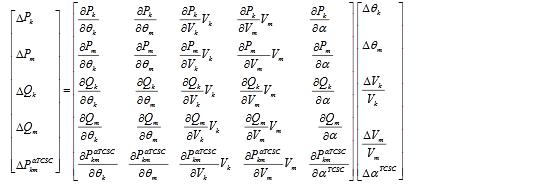
For the case when the TCSC controls active power flowing from bus k to bus m at a specified value, the set of linearized power flow equations is (Paul et a l., 2012):

(13 Where
Constitute power mismatch equation’ and these are expressed as: (14) (15)
Where:
International Journal of Electrical and Electronics Research ISSN 2348-6988 (online) Vol. 10, Issue 3, pp: (10-19), Month: July - September 2022, Available at: www.researchpublish.com
The Jacobian elements for the series reactance, as a function of the firing angle αTCSC, are given below. Partial derivatives of the variable series impedance model are: (16) (17) (18) (19) (20) (21)


IV. SYSTEMIMPLEMENTATION
The system was implemented using the models develop for the TCSC and also then integrated on the nine bus along the 330Kv network using power system toolbox in Simulink as shown in figure 2 and figure 4 which presented the model of the network without TCSC;
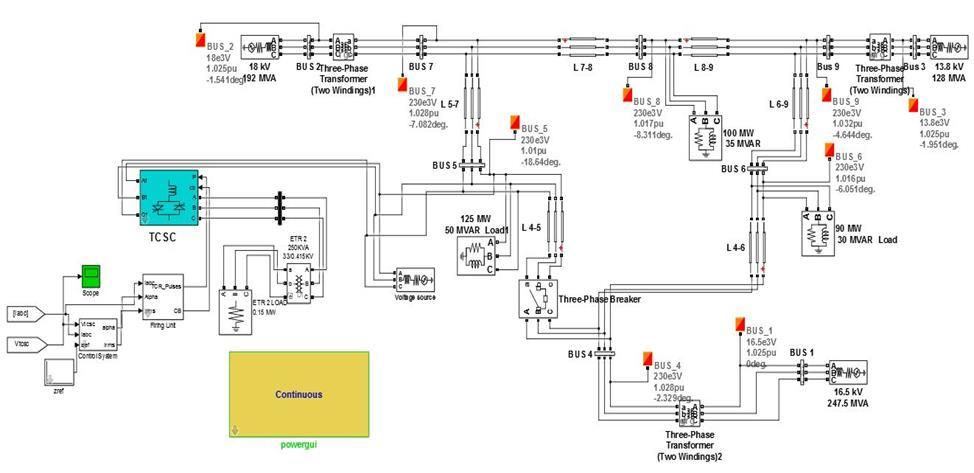
Figure 2: Simulink model of the network with TCSC
Journals
International Journal of Electrical and Electronics Research ISSN 2348-6988 (online) Vol. 10, Issue 3, pp: (10-19), Month: July - September 2022, Available at: www.researchpublish.com
Figure 3: Simulink model of load flow on a faulty 9-Bus IEEE system without TCSC V.
RESULTS AND DISCUSSION
a. Results of characterization without TSCS
The simulation results are presented to improve the Power transmission system without and with TCSC device and also compare the power loss of power system without TCSC and with TCSC. A three-phase fault was introduced to the system on lines 4- 5. The load flow simulation was carried out on a faulty IEEE 9 bus system. Figure 5 and Table 1 show the result of the simulation. Bus 5 was detected to violate the voltage limit of 0.95 < V< 1.05 p.u. having a voltage magnitude of 0.9488p.u. This indicates that there was power system instability.
Table 1: Table showing the load flow result of a faulty 9 bus system without TCSC
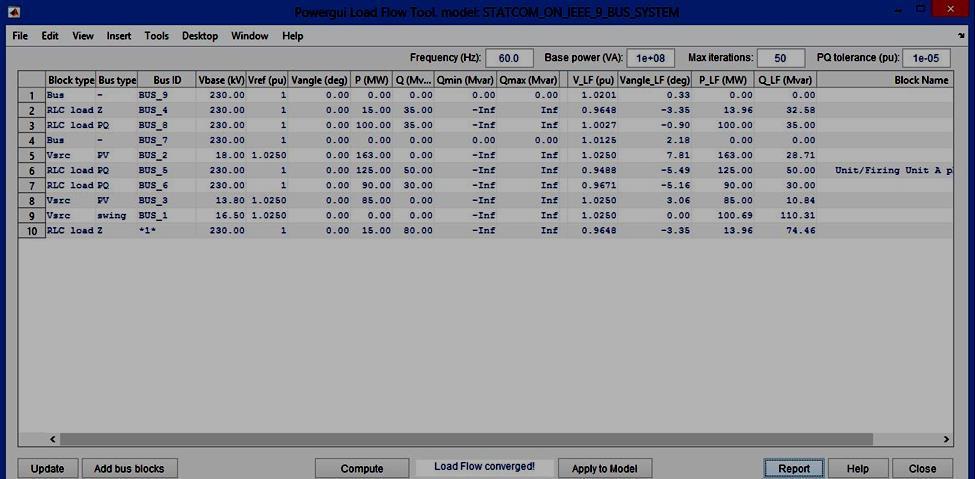
BUS Voltage (p.u.) Voltage Angle (deg) PGEN (MW) QGEN (MVAR) PLOAD (MW) QLOAD (MVAR)
BUS_1 1.025 0 100.6856 110.3052 0 0 BUS_2 1.025 7.81 163 28.71134 0 0 BUS_3 1.025 3.06 85 10.83609 0 0 BUS_4 0.9648 -3.35 0 0 0 0 BUS_5 0.9488 -5.49 0 0 125 50 BUS_6 0.9671 -5.16 0 0 90 30 BUS_7 1.0125 2.18 0 0 0 0 BUS_8 1.0027 -0.9 0 0 100 35 BUS_9 1.0201 0.33 0 0 0 0
Average 348.6856 146.8526 315 115
Figurec4: Simulink Result of load flow faulty 9-Bus IEEE system without TCSC

International Journal of Electrical and Electronics Research ISSN 2348-6988 (online) Vol. 10, Issue 3, pp: (10-19), Month: July - September 2022, Available at: www.researchpublish.com
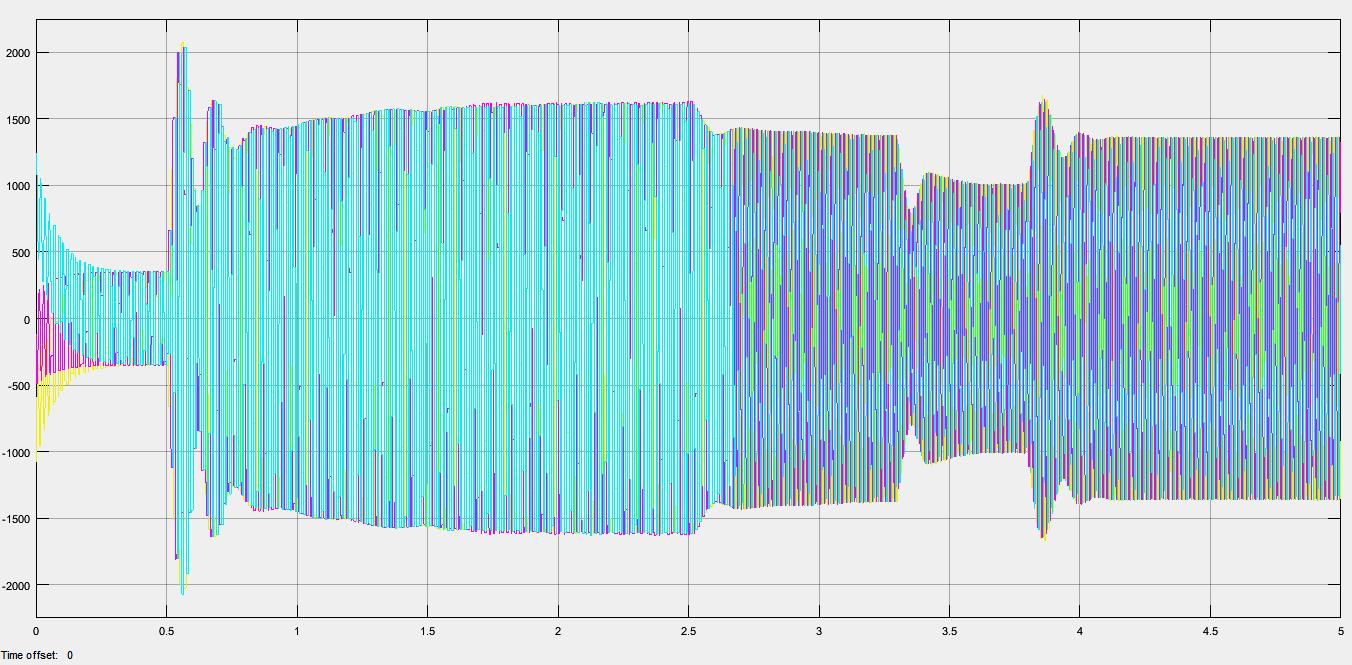
Figure 4 shows that at 0.5s a 5% change in the reference impedance is applied. The response indicates that TCSC enables tracking of the reference impedance and the settling time is around 500ms. At 0.63s a 4% reduction in the source voltage is applied, followed by the return to 1p.u. at 0.8s. It is seen that the TCSC controller compensates for these disturbances and the TCSC impedance stays constant. The TCSC response time is 200ms-300ms. At 0.6s to 0.7s and 0.7s to 0.8s the network experiences instability due to fault in the reference voltage, also at 0.8s to 1s the network experiences stability.
b. SIMULATION PERFORMANCE OF TSCS
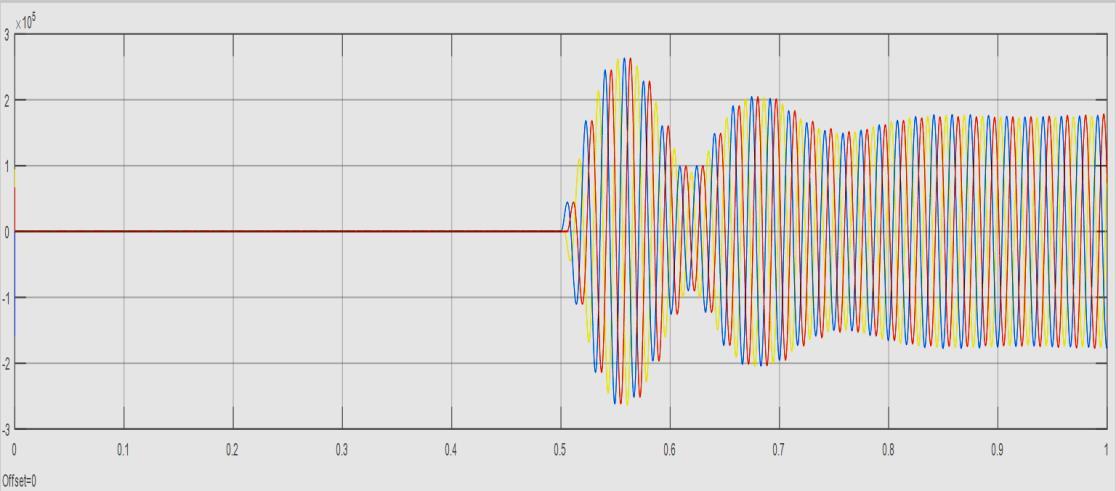
The TCSC response time is 200ms-300ms when activated on the network and simulated at fault condition as shown in figure 5
Figurev5: Transmission line TCSC Voltage
At 0.6s to 0.7s and 0.7s to 0.8s the network experiences instability due to fault in the reference voltage, also at 0.8s to 1s the network experiences stability. The TSCS capacitive mode is fire angle 69-90deg. The impedance is lowest at 90deg, and therefore power transfer increases as the firing angle are reduced. The figure 7 showed how the stability on the network is achieved with TSCS.
Figure 6: Transmission line TCSC Current
When TCSC operates in the constant impedance mode it uses voltage and current feedback for calculating the TCSC impedance. The reference impedance indirectly determines the power level, although an automatic power control mode could also be introduced. A separate proportional integral (PI) controller is used in each operating mode; the capacitive mode also employs a phase lead compensator. TCSC controller further includes an adaptive control loop to improve performance over a wide operating range. The controller gain scheduling compensates for the gain changes in the system, caused by the variations in the impedance. The firing circuit uses three single-phase phase locked loop (PLL) units for synchronization with the line current. Line current is used for synchronization, rather than line voltage since the TCSC voltage can vary widely during the operation. The performance of the bus with TSCS is presented in table 2;
International Journal of Electrical and Electronics Research ISSN 2348-6988 (online) Vol. 10, Issue 3, pp: (10-19), Month: July - September 2022, Available at: www.researchpublish.com
Table2: Load flow solution of 9-Bus IEEE system with TCSC
BUS Voltage (p.u.) Voltage Angle (deg) PGEN (MW) QGEN (MVAR) PLOAD (MW) QLOAD (MVAR)
BUS_1 1.025 0 74.52572 -2.95396 0 0
BUS_2 1.025 -1.54 163 3.217693 0 0
BUS_3 1.025 -1.95 85 -10.028 0 0
BUS_4 1.0276 -2.33 0 0 0 0
BUS_5 1.01 -18.64 0 42.72764 125 50
BUS_6 1.0166 -6.05 0 0 90 30
BUS_7 1.028 -7.08 0 0 0 0
BUS_8 1.017 -8.31 0 0 100 35 BUS_9 1.032 -4.64 0 0 0 0
Average 322.5257 32.96336 315 115
From the result it was observed that the TSCS was able to stability the bus voltage and controls the impact of the fault current on the load flow.
Comparative analysis
Figure 7: Graph showing the voltage profile at the buses without and with TCSC device.
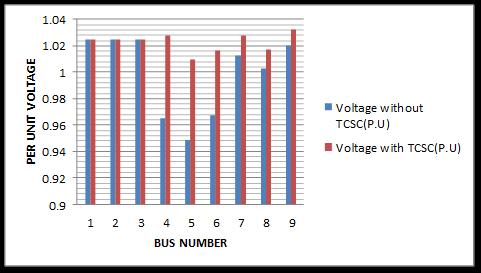
From the graph, there was a considerable improvement in the voltage profile of the system when the TCSC device is incorporated into the network. The voltage at bus 5 was regulated from 0.9488 p.u. to 1.01 p.u. other buses that experienced voltage improvement are buses 4, 6, 7, 8, and 9 with an increase from 0.9648 p.u. to 1.0276 p.u., 0.9671p.u to 1.0166p.u, 1.0125p.u to 1.028p.u, 1.0027p.u to 1.017p.u and 1.0201 to 1.032p.u respectively. It can also be seen that the TCSC device injected more reactive power into the system to obtain improved voltage profile and stability at the buses. The graph of figure 7 shows the voltage magnitude of the power system without and with TCSC. Bus 5 was seen to have a voltage boost which allows it to fall within the voltage limit range of 0.95 < V< 1.05 p.u.
Figure 8: Comparison between Active power and Reactive power
The result shows that total active power Loss without TCSC was 348.6856MW while that with TCSC was 322.53MW. Also, the reactive power loss without and with TCSC was 146.8526MW and 32.96336MW respectively. Therefore, the percentage of power system improvement is 7.5% when TCSC was incorporated. Finally, the Power transmission system tremendously improves when the TCSC device was applied

International Journal of Electrical and Electronics Research ISSN 2348-6988 (online) Vol. 10, Issue 3, pp: (10-19), Month: July - September 2022, Available at: www.researchpublish.com
VI. CONCLUSION
This study has discussed the importance of TCSC devices on power transmission system stability. The TCSC was applied to enhance optimal power flowinto thepower flownetwork.The devicewas attached toa suitable bus m,andthe expression of the source voltage was generated. The Three-phase fault was introduced to the system on lines 4-5 to violate the voltage limit of 0.95 < V< 1.05p.u. The load flow simulation was carried out on a faulty IEEE 9 bus system. MATLAB/SIMULINK software was performed to carry out an analysis of the power transmission system. The result shows that Bus 5 has a voltage magnitude of 0.9488p.u. Hence voltage magnitude without and with TCSC device are 0.9488p.u and 1.01p.u respectively. The total active powers Loss without and with TCSC devices are 348.6856MW and 322.53MW respectively. Therefore, the percentage of power system improvement was 7.5% when TCSC was incorporated. Finally, the Power transmission system improves when the TCSC device was applied.
CONTRIBUTION TO KNOWLDEGE
The study develop a TSCS for instability and loss compensation in 330KV transmission network
REFERENCES
[1] Abdel-Moamen M., &Padhy N., (2013). Power Flow Control and Transmission Loss Minimization Model with TCSC for Practical Power Networks. DOI: 10.1109/PES.2003.1270424 · Source: IEEE Xplore0-7803-7989-6/03/$l7.00 02003 IEEE
[2] Abdullah N., Musirin I. & Othman (2011). Thyristor Controlled Series Compensator Planning Using Evolutionary Programming for Transmission Loss Minimization for System under Contingencies. DOI: 10.1109/PECON.2010. 5697550 · Source: IEEE Xplore
[3] Abouzar Samimi, Peyman Naderi (2012). A New Method for Optimal Placement of TCSC Based on Sensitivity Analysis for Congestion Management. Scientific Research, Smart Grid, and Renewable Energy,
[4] Fuerte-Esquivel C. R, E. Acha, H Ambriz-Perez, (2000). A Thyristor Controlled Series Compensator Model for the Power Flow Solution of Practical Power Networks”, IEEE Transactions on power systems, Vol. 15, No. 1, pp. 58-64,
[5] Hassan M.O., Cheng S. J., and. Zakaria Z. A, (2011). Steady-state Modeling of SVC and TCSC for Power Flow Analysis. Proceedings of the International MultiConference of Engineers and Computer Scientists, Vol. II.
[6] John J. Paserba, (2014) How FACTS Controllers Benefit AC Transmission Systems. Proceedings of the Power Engineering Society General Meeting, IEEE, Vol. 02, pp. 1257-1262.
[7] Leite da silva A.M., Costa J.G.C., Manso L.A.F, and Anders G.J., (2014). Evaluation of transfer capabilities of transmission systems in competitive environments. Electrical Power and Energy Systems, Vol. 26, No. 4, pp. 257-263
[8] Nwohu M., Isah A., Usman U., & Sadiq A., (2016). Optimal Placement of Thyristor Controlled Series Compensator (TCSC) on Nigerian 330kV Transmission Grid to Minimize Real Power Losses. International Journal of Research Studies in Electrical and Electronics Engineering (IJRSEEE) Volume 2, Issue 4, 2016, PP 18-26 ISSN 2454-9436 (Online) DOI: http://dx.doi.org/10.20431/2454-9436.0204003 www.arcjournals.org
[9] Patil N., Kumar V., & Kulkarni G (2020). Power Loss Minimization in Transmission System using Particle Swarm Optimization and Salp Swarm Algorithm. European Journal of Molecular & Clinical Medicine ISSN 2515-8260 Volume 7, Issue 4, 2020.
[10] Paul Clee, SvlNarasimham (2012). Enhancement of Power Flow Using TCSC Controller. International Journal of Electrical and Electronics Engineering (IJEEE) Vol.1, Issue 1
[11] Ratra S., Singh P., Tiwari R., (2016). Optimal Placement of Thyristor Controlled Series Compensators for Sensitive Nodes in Transmission System Using Voltage Power Sensitivity Index. International Journal of Electrical Energy, Vol. 4, No. 4, December 2016
[12] Thomas J. overbye, Doug Brown, (1993). Use of FACTS devices for power system stability enhancement”, Proceedings of the 36th Midwest Symposium on Circuits and Systems, IEEE, Vol. 02, pp. 1019-1022.
[13] Xie Da, NiuHui, Chen Chen, Wu Jishun, (1998). An Algorithm to Control the Power Flow in Large Systems Based On TCSC. Proceedings of Power System Technology, IEEE, Vol. 01, pp. 344-348,
[14] Ying Xiao Y.H. Song, Sun Y.Z., (2010). Versatile Model forPower Flow Control Using FACTS Devices. Proceedings of the third International Power Electronics and Motion Control Conference, IEEE, Vol. 02, pp. 868-874.
