ISSN 2348-1218 (print)
International Journal of Interdisciplinary Research and Innovations ISSN 2348-1226 (online) Vol. 10, Issue 2, pp: (85-91), Month: April - June 2022, Available at: www.researchpublish.com

ISSN 2348-1218 (print)
International Journal of Interdisciplinary Research and Innovations ISSN 2348-1226 (online) Vol. 10, Issue 2, pp: (85-91), Month: April - June 2022, Available at: www.researchpublish.com
Özcan ÇETİNKAYA1
1Trakya University Keşan Vocational College, Edirne, Turkey.
DOI: https://doi.org/10.5281/zenodo.6659720
Published Date: 18-June-2022
Abstract: For many years, human beings have had to pay attention to weather events while performing their work and activities during the day in order to make good use of time. Weather is the events that change in a very short time in the atmosphere layer. Apart from natural weather events, the effects of air pollution on human health, which are caused by the emission releases of homes, workplaces, vehicles and production centers as a result of industrialization, are gradually increasing. In this study, in order to obtain information about the local weather conditions, data such as precipitation amount, wind speed and direction, air pressure and temperature, and dust density in the air will be displayed to the users instantly via an iot-based microcontroller on a web page and the data can be monitored by printing them on a screen. In addition, it is planned to create a database by storing these data on an SD card.
Keywords: Weather, quality, dust, iot.
Weather is the events that change in a very short time in the atmosphere layer. Different weather events can occur in each region of the atmosphere. Thanks to meteorology, which is the science of the atmosphere, atmospheric events can be followed on a large scale and the weather can be monitored instantly. Apart from this, predictions can be made about weather events in the near future with great accuracy. Meteorology uses satellite and radar images, ship and atmospheric observations and meteorology station data to monitor and forecast weather conditions. Apart from natural weather events, the effects of air pollution on human health, which are caused by the production and consumption activities of houses, workplaces, vehicles and production centers as a result of industrialization, are gradually increasing. For this reason, it is also necessary to have information about the quality of the air by measuring the harmful substances in the air in a region. In this study, these data are provided to the users to be watched instantly on a web page and screen, and to be stored and processed on the SD card for the processing of historical data when requested.[1, 2]
In recent years, with the concept of the Internet of Things, applications where all devices that can access the Internet exchange data with each other without the need for humans have been increasing. The concept of the Internet of Things was first used by Kevin Ashton in 1999, the first example was used in 1993 by Quentin Stafford-Fraser and Paul Jardetzky in imaging the coffee machine chamber at the Cambridge University Computer Laboratory.[3, 4] In this study, nodemcu development board with iot esp8266 microcontroller of espressif company was used as microcontroller. Sharp GP2Y10 Optical Dust Sensor was used to measure the dust density in the air, and a weather station with a barometer, temperature sensor, anemometer, minute hand and rain gauge developed by Sparkfun company was used to measure precipitation amount, wind speed and direction, air pressure and temperature data. In addition, an LCD screen is used to display all of these data instantly on an LCD screen, and an SD card module and real time clock are used to periodically record these data on the SD card with date and time information.
ISSN 2348-1218 (print)
International Journal of Interdisciplinary Research and Innovations ISSN 2348-1226 (online) Vol. 10, Issue 2, pp: (85-91), Month: April - June 2022, Available at: www.researchpublish.com
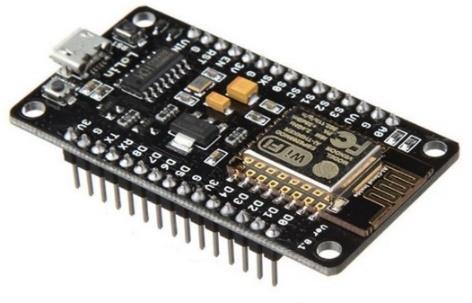
In our study, the ESP8266 WIFI NodeMCU development card was used to read the rainfall amount, wind speed and direction, air pressure and temperature, and dust density data in the air, to write these data on the LCD screen and to save them to the SD card. Since this development board was developed with the ESP8266 Software Development Kit (SDK), it does not need a separate microcontroller. In addition, since this development board has an integrated WIFI module, this data can be viewed remotely via the Internet network with the created Web Server. The development board is shown in figure-1.[5, 6]
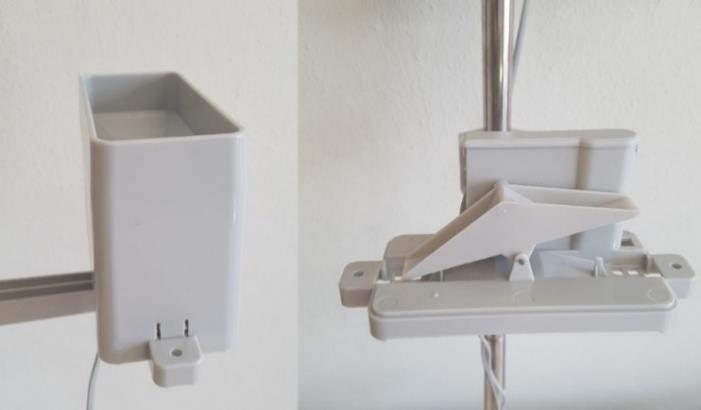
A weather station with a barometer, temperature sensor, anemometer, minute hand and rain gauge developed by the Sparkfun company was used to measure the precipitation amount, wind speed and direction, air pressure and temperature data to be followed by the system. The rainmeter consists of a mechanism with a self-emptying numerical counter for every 0.2794mm of rain measurement. It can be seen in figure-2
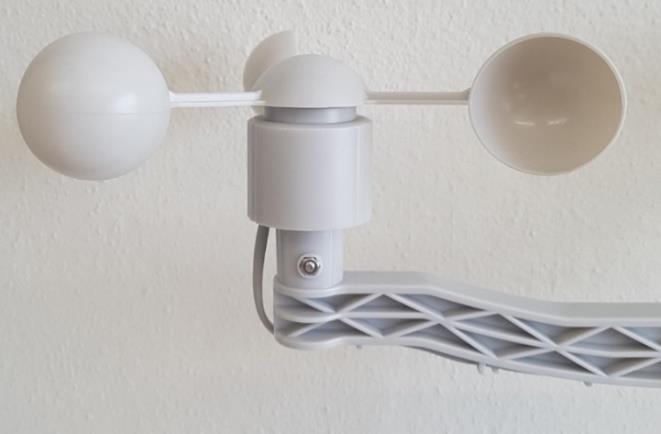
The anemometer has a mechanism that causes a magnet and tongue contact switch to close once every 2.4 km/h wind speed. It can be seen in figure-3.
The weather vane has eight switches, each connected to a different resistor for each polar direction. The magnet on the wing of the weather vane has a mechanism that can close two keys at the same time and allow 16 different positions to be displayed. It can be seen in figure-4. The switch and resistor layout is shown in the diagram to the right. Resistance values for all 16 possible positions are given in the table.
ISSN 2348-1218 (print)
International Journal of Interdisciplinary Research and Innovations ISSN 2348-1226 (online) Vol. 10, Issue 2, pp: (85-91), Month: April - June 2022, Available at: www.researchpublish.com
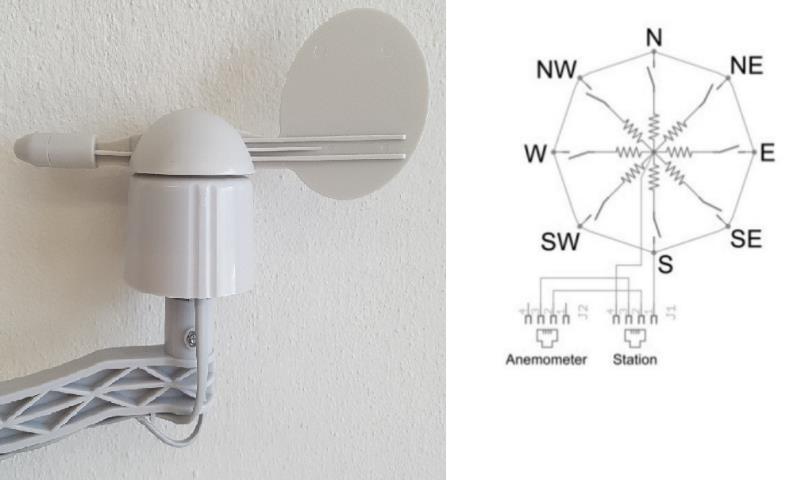
The resistance values for the positions shown in Figure-4 are the result of two adjacent resistors connected in parallel when the flap magnet activates the two switches at the same time.
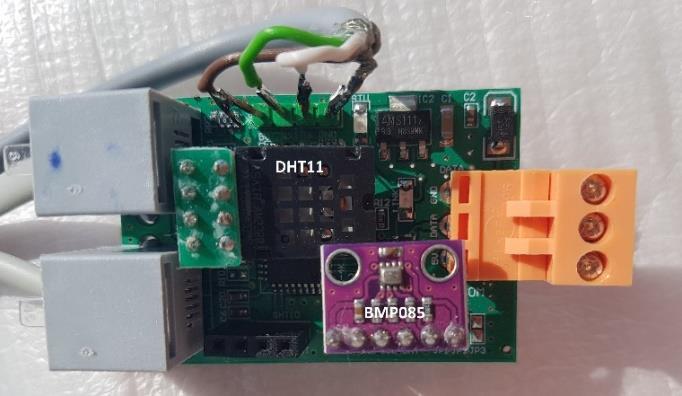
In addition, there are BMP085 barometric pressure sensor and DHT11 Humidity and Temperature Sensor on the control card of the system. The BMP085 pressure sensor measures in the range of 300-1100 hPa with absolute accuracy of 0.03 hPa. Based on piezo-resistive technology, the sensor has high accuracy, linearity and long-term stability at the same time. It is designed to be connected to the microprocessor with the I²C interface. It can be seen in figure-5
DHT11 temperature and humidity sensor is an advanced sensor unit that gives calibrated digital signal output. The unit, which measures temperature between -40 and +80°C with an error margin of +/-1°C, can measure humidity with an error margin of +/-5% RH between 0-100% RH. It can be seen in figure-5 [7]
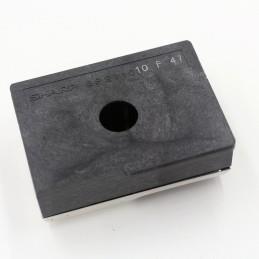
The Sharp optical dust sensor is a sensor that can be used to detect very fine particle dust particles such as cigarette smoke and to measure air pollution. The dust sensor has a sensitivity of 0.5V/1mg/m3 and gives an analog voltage output proportional to the dust density. It can be seen in figure-6.[8]
ISSN 2348-1218 (print)
International Journal of Interdisciplinary Research and Innovations ISSN 2348-1226 (online) Vol. 10, Issue 2, pp: (85-91), Month: April - June 2022, Available at: www.researchpublish.com
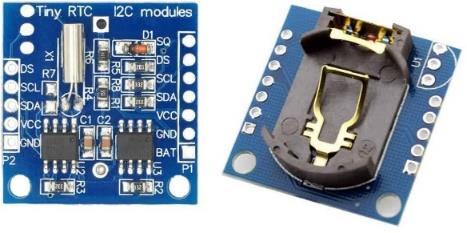
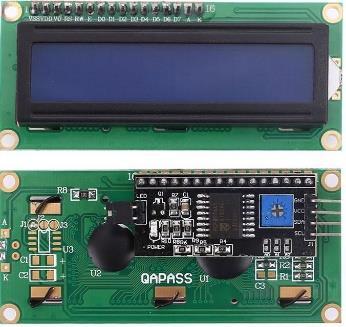
A 4x16 LCD screen is used to instantly read the read data. The I2C converter card was used to connect this display to the development board, and the DS1307 RTC real time clock module was used to save these data to the SD card with instant date and time information. Thanks to the 24C32 EEPROM of this module, Date and Time information is stored. LCD screen and I2C converter are shown in figure-7 and DS1307 RTC module is shown in figure-8 [9]
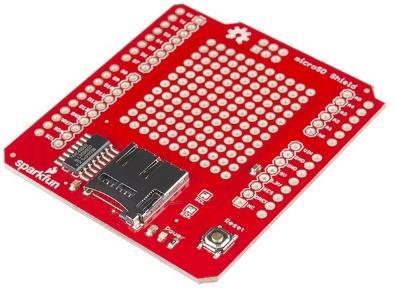
With the real time clock module, all data is instantly recorded on the SD card with a 1-minute period. SD card module is seen in figure-9 [10]
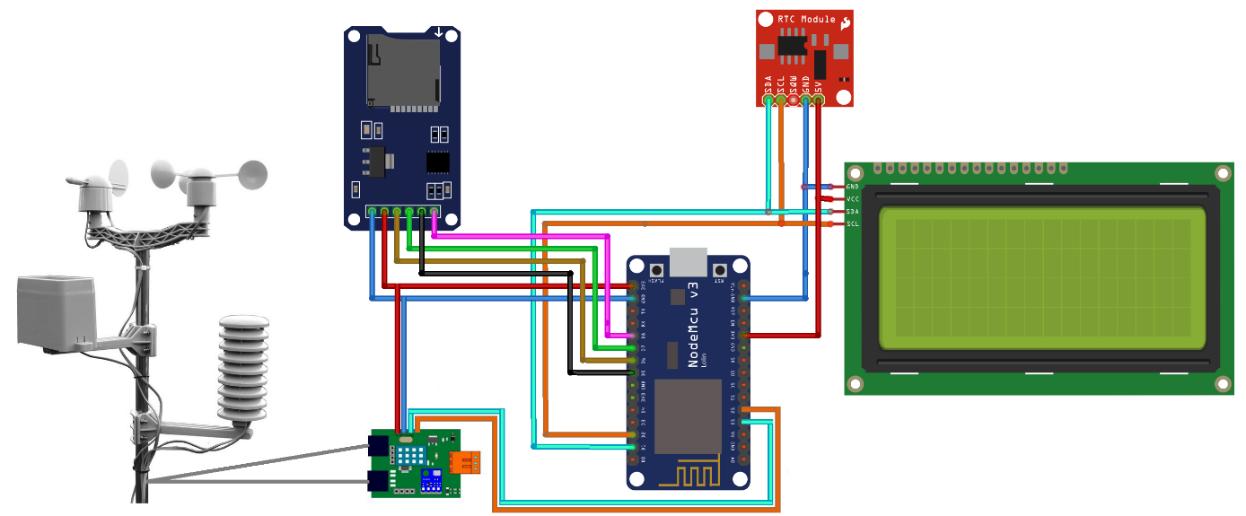
The electrical connection diagram of the development board and other equipment of our study is shown in figure-x and the realization of the study is shown in figure-10
Figure 10: The electrical connection diagram of the development board and other equipment
ISSN 2348-1218 (print)
International Journal of Interdisciplinary Research and Innovations ISSN 2348-1226 (online) Vol. 10, Issue 2, pp: (85-91), Month: April - June 2022, Available at: www.researchpublish.com
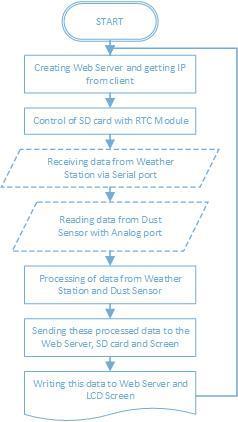
The development board software flow chart of our study is shown in figure-11
In our study, a user software is needed in order for the development board to read the data from the relevant sensors and to print these data to the web server, sd card and screen after processing. Thanks to this user software, by setting up a Web Server in the ESP8266 WIFI module, all the data read is connected to the development board from the outside world with an IP address given by the network administrator, and the data is displayed like a web page. For this purpose, ESPAsyncWebServer[11] and ESPAsyncTCP libraries[12] were used instead of the standard ESP8266 library to set up a web server. Thanks to the ESPAsyncWebServer and ESPAsyncTCP libraries, a web page consisting of html codes named index.html has been created in the ESP8266 WIFI Web Server, and users accessing this page do not need to refresh the page to refresh the data in the html page as the data changes. As all these data change, the page is automatically refreshed every 10 seconds.
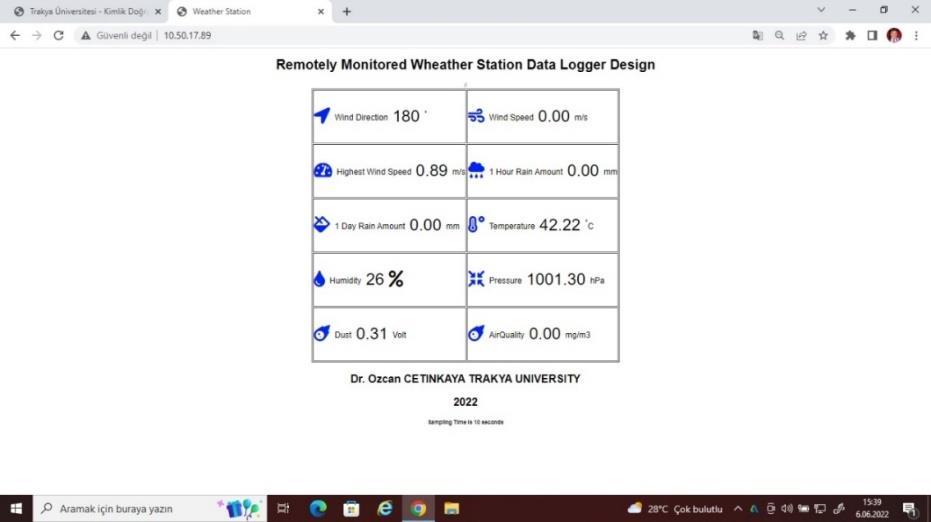
The following figure-12 shows the computer screen when a user accesses the web page remotely.
Figure 12: Web pages
ISSN 2348-1218 (print)
International Journal of Interdisciplinary Research and Innovations ISSN 2348-1226 (online) Vol. 10, Issue 2, pp: (85-91), Month: April - June 2022, Available at: www.researchpublish.com
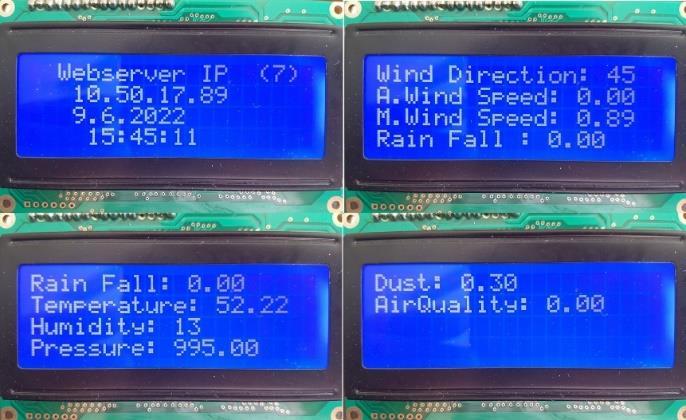
The IP number assigned by the network administrator and the date and time information, together with all the read data, are written on the LCD screen in 5 seconds. LCD screen images appear in Figure-13 and Figurex below.
Apart from these, all the data read to the file named LOG.txt created on the SD card is printed together with the instant date and time information obtained from the DS1307 RTC module. The data written to the log.txt file is visible in the figure 14. All data read in order to be used statistically are recorded in this way.
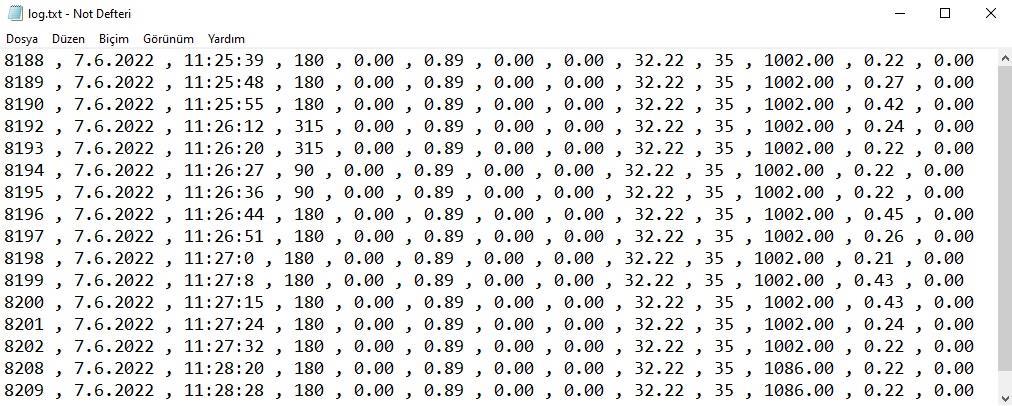
Figure 14: The data written to the log.txt file
The data of precipitation amount, wind speed and direction, air pressure and temperature, and dust density in the air were read with the ESP8266 WIFI development card, and these data were written to the html page created on the development card via the web server created on the development card in order to monitor these data remotely by the users. In addition, the purpose of the study was achieved by saving these data on both the LCD screen and the SD card. We think that this study will be beneficial to researchers who will work on the Internet of Things.
[1] Türkeş, M., Hava, İklim, Şiddetli Hava Olayları ve Küresel Isınma. TC Başbakanlık Devlet Meteoroloji İşleri Genel Müdürlüğü, 2000: p. 187-205.
[2] Zencirci, S.A. and B. IŞIKLI, Hava kirliliği. ESTÜDAM Halk Sağlığı Dergisi, 2017. 2(2): p. 24-36.
[3] Madakam, S., R. Ramaswamy, and S. Tripathi, Internet of Things (IoT): A Literature Review. Journal of Computer and Communications, 2015. Vol.03No.05: p. 10.
[4] Vlasios, T., et al., Chapter 1 - Why the Internet of Things? 2019: p. 3-7.
[5] Schwartz, M., Internet of Things with ESP8266. 2016: Packt Publishing Ltd.
ISSN 2348-1218 (print)
International Journal of Interdisciplinary Research and Innovations ISSN 2348-1226 (online) Vol. 10, Issue 2, pp: (85-91), Month: April - June 2022, Available at: www.researchpublish.com
[6] Team, E.I. ESP8266-DevKitC Getting Started Guide. 2018 [cited 2019; Available from: https://www.espressif.com/ sites/default/files/documentation/ESP8266-DevKitC_getting_started_guide__EN.pdf
[7] DFRobot. Weather Station Sensor Kit. [cited 2022 01.02.2022]; Available from: https://wiki.dfrobot.com/APRS_ Weather_Station_Sensor_Kit_SEN0186.
[8] SHARP. Optical Dust Sensor. 2022 [cited 2022 02.2.2022]; Available from: https://global.sharp/products/device/ lineup/data/pdf/datasheet/gp2y1010au_e.pdf
[9] Product, M.I., DS1307 RTC i2c real time clock module 2015.
[10] SparkFun. microSD Card Shield. 2014 [cited 02.03.2022; Available from: https://github.com/sparkfun/microSD_ Shield/tree/V_1.4.
[11] ESPAsyncWebServer Tutorial. [cited 2019; Available from: https://github.com/me-no-dev/ESPAsyncWebServer.
[12] ESPAsyncTCP Tutorial. [cited 2019; Available from: https://github.com/me-no-dev/ESPAsyncTCP