ISSN 2348-3156 (Print)
International Journal of Social Science and Humanities Research ISSN 2348-3164 (online)
Vol. 10, Issue 3, pp: (210-219), Month: July - September 2022, Available at: www.researchpublish.com

ISSN 2348-3156 (Print)
International Journal of Social Science and Humanities Research ISSN 2348-3164 (online)
Vol. 10, Issue 3, pp: (210-219), Month: July - September 2022, Available at: www.researchpublish.com
College of Mathematics and Computer Science
Zhejiang Normal University, 688 Yingbin Ave, Jinhua 321004, China
DOI: https://doi.org/10.5281/zenodo.6948335 Published Date: 01-August-2022
Abstract: An international trade network system is crucial for developing Countries' Economies. Countries Export products not far from their Product Space Network, as they will require the same technology, skills, and institutions. The exportation of products can be affected by disruptions in the global Economic system, Such as COVID -19 recently. During the pandemic, Country lockdown and Import restriction policies led to a decline in Global products export.Thereisarequirementtohavearesilientsystem insuch awayitwouldwithstanddisruptionsintheeconomy. Most studies were done to determine whether the Global trade system is resilient. Determination of criticaltransition values, which mark the points at which the system will lose or gain resilience, is not well covered yet. In this study, we developed the Lotka-Volterra model to determine critical values for the United States dollar index and proximity Index for four years, from 2018 to 2021. The critical transition values show that the significant effect of the pandemic on the global exportation of products was prominent in the year 2020 compared to the other three years
Keywords: Export; Product space Network; COVID-19; Lotka-Volterra; United states dollar Index (USDX); Proximity Index.
The exportation of products is essential in generating income in economies. Hidalgo et al. [1] defined product space as the Network of relatedness among products. Most countries export products that do not vary away from their current structure of products since it is easier to encompass the same skills, technology, and institution than to introduce a different product. As countries change their export mix, there is a strong tendency to move towards related goods rather than goods farther away [2] The proximity between any pair of products is defined according to the relative frequency with which they are jointly exported by countries having a revealed comparative advantage in those specific product categories [3] Mathematically proximity can be explained as the probability of exporting one product with a comparative advantage given that you can export the other product.
The United States (U.S.) dollar is unquestionably the most dominant international currency and functions as the foundation of the current global monetary system [4]. The U.S dollar index (USDX) is a geometrically averaged of six currencies (the Canadian Dollar, the Euro, the British Pound, the Japanese Yen, the Swedish Krona, and the Swiss Franc) against the U.S dollar [5]. Initially, the DYX was developed by the U.S Federal Reserve in 1973 to provide an external bilateral tradeweighted average value of the U.S. dollar as it freely floated against global currencies [5].therefore, the devaluation of the United States dollar index led to the rise of Price of commodities.
Mena et al. [6] Defined Resilience in International trade as the ability of a country to both resist disruptions to international trade andrecover afterdisorders occur.In this study,the definition is further extended for the case of Product space Network
ISSN 2348-3156 (Print)
International Journal of Social Science and Humanities Research ISSN 2348-3164 (online)
Vol. 10, Issue 3, pp: (210-219), Month: July - September 2022, Available at: www.researchpublish.com
as the ability of the Network to retain its normal functioning after Economic disruptions or recover from the Effects of Economic disturbances. Ferrer [7] stated that the first case of COVID 19 appeared in December 2019 in Hubei Province in China, whereas on 11 March 2020, it was declared a Pandemic by WHO. Vo and Tran [8] found a Negative effect of COVID-19 in exporting and importing Countries. Therefore we study the effects Of COVID-19 on the resilience of the Global product space Network structure.
Hidalgo et al. [1], Hausmann and Klinger [2], and Ferrarini and Scaramozzino [3] stated that the Evolution of production and Exportation of commodities depends on the current Country's production structure. They further explained that innovation and the introduction of new products would depend on the available products since they will require similar technology, skills, and institutions. Mena et al. [6] studied the factors influencing International Trade Resilience. They mentioned those factors to be Economic globalization, National Governance support, Logistic Performance, Healthcare Preparedness, and Income Levels. It was also found that the resilience of international trade was affected by the COVID19 pandemic. All these studies were able to study whether Network was resilient or not. Still, they were not yet able to establish points where the resilience characteristics of the International trade changed. This study will determine the critical transition values of the United States dollar Index and Proximity index before and after the COVID-19 pandemic.
The biological models have been used over time to study the dynamic system. Venturino [9] stated that the first Interacting species was introduced by Mathematician, Lotka, and developed further by another Mathematician, Volterra. The whole mathematical model is called Lotka Volterra. Although initially the model was used to study the ecological dynamics of interacting species, it was further developed to explore other areas such as epidemiological, social, and Economic studies. InEconomicstudies, Wanget al.[10] studiedtheCompetitionanalysisoftheIndustrypopulationbasedonthreedimensions Lotka-Volterra Model, and Orlando and Sportelli [12] used the Lotka model to study the Growth and cycles in Economics as a struggle between Workers and capitalist. In technological innovation studies, Zhang and Huang [11] surveyed the Grey Lotka-Volterra model for the co-evolution of technological innovation, resource consumption, environmental quality, and high-quality industrial development in Shaanxi Province in China,
Most studies on the International trade network were on its resilience or non-resilient state and factors that affect the resilience of the International Trade Network system. But less is known about the values that mark the transition of the resilient state of the system. This study will determine the critical transition values of the United States dollar Index and Proximity Index, which mark points at which the system will change its resilience behaviour.
2.1
Moutsinas and Guo [13] used Lotka-Volterra mode; to explain the Node-level loss in Complex networks. In this study, the Lotka-Volterra model is developed further to study the trends in the exportation of products in the Global Product Space Network. The developed model will include the significant characteristics of the Product space Network in addition to the Influence of the United States dollar Index. Export of product i is represented by ix . The product space Network will be in the form of
ISSN 2348-3156 (Print)
International Journal of Social Science and Humanities Research ISSN 2348-3164 (online) Vol. 10, Issue 3, pp: (210-219), Month: July - September 2022, Available at: www.researchpublish.com
Where i is the intrinsic growth rate of exports of product i , iK is the carrying capacity of global International trade network for Exportation of Commodity i , iC is the Alee effect of the system whereby beyond this point there will be the decrease in Exportation of Commodities, I is the United States Dollar Index Value, is the mean dollar Index Value and is the coefficient of variation for the dollar index.
Economies grow by upgrading the products they produce and Export [1]; therefore, proximity between products is essential for determining a Country's new exports. The proximity index() ij will serve as the interaction index between Commodity i and j . The formula can determine the proximity co-efficient …..………….. (ii)
Where RCA stands for the Revealed comparative advantage …………………..………………..……..(iii) Shows whether a country c exports more of product i as the share of its total output than the average Country, for a country to have an advantage in Transportation of output, then RCA>1 (not RCA<1). The overall interaction dynamics between commodities with the effect of a half-saturation constant ( ) ih can be written as.
(iv)
ISSN 2348-3156 (Print)
International Journal of Social Science and Humanities Research ISSN 2348-3164 (online) Vol. 10, Issue 3, pp: (210-219), Month: July - September 2022, Available at: www.researchpublish.com
The Similar critical values of the proximity index () c eff and the effective number of product exports () c effx must satisfy. ( ) ,0
The export data from 2018 to 2019 are extracted from the website https://comtrade.un.org/data/. The data comprises 88 Countries exporting 1059 different products as categorized in the form of Standard International Data Level 4 (SITC-4). These export data from 1059 products were further grouped into 66 major groups of products for analysis purposes. The United States dollar indices data from 2018 to 2021 were delivered from the timely updates published on https://www.investing.com/indices/usdollar-historical-data
Results show that the system is highly affected by United States dollar index variation and proximity indices between the product regardless of other parametric values such as intrinsic growth rate, Carrying capacity, alee effects, and half saturation contact. The system will exhibit high resilience H x as critical transition values of the United States dollar index become larger or the proximity index become smaller than the data-based values United States dollar index and Proximity index.
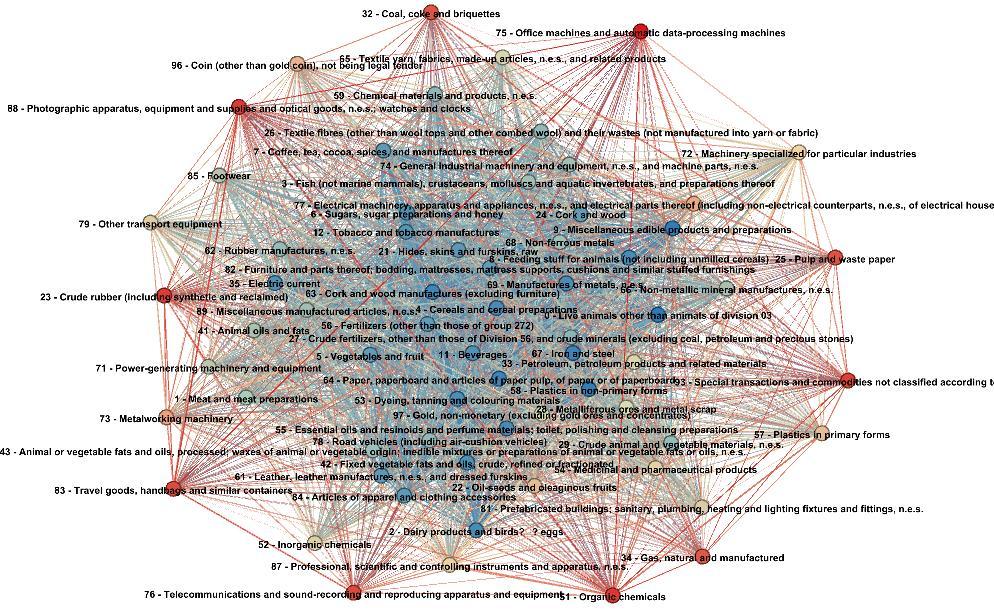
Exportation of products in any country is highly related to the products' relatedness. Some products are more connected to other products in the exportation structure. For example, a country that exports Live Farm Animals such as Cows, pigs, hens, and ducks will be in a good position to export Farm animals' related products such as eggs, Meat, and skin since they need similar manpower, machinery, and institutions in their production and exportation compared to the Country that does not produce or export Farm animals.
Source: Authors simulation
Figure 1: Product space Network for 2019, whereby Nodes represent exported Products and Edges represents proximities between products.
ISSN 2348-3156 (Print)
International Journal of Social Science and Humanities Research ISSN 2348-3164 (online)
Vol. 10, Issue 3, pp: (210-219), Month: July - September 2022, Available at: www.researchpublish.com
Figure 1 show the connectivity among 66 major groups of products (nodes) deduced from 1059 as they are represented in SITC-4. This Network indicates that a country that transports highly connected products found at the centre of the Network can produce and export many products. In this Network, the highly connected products are such as Dairy products, birds and eggs (2), Feeding stuff foranimals (not including un-milled cereals)(8), Miscellaneousedible products and preparations (9), Beverages(11), Electric current (35), Plastics in non-primary forms (58), Non-metallic mineral manufactures 67) and Manufactures of metals (69). Some products are not highly connected in such a way its production and exports do not easily give the high possibility to transport other products; in this Network, products that are not highly connected are such as Pulp and waste paper(25), Coal, coke, and briquettes (32), Gas, natural and manufactured (34), Organic chemicals (51), Metalworking machinery(73), Office machines and automatic data-processing machines (75), Telecommunications and sound-recording and reproducing apparatus and equipment (76), Travel goods, handbags and similar containers (83) and Special transactions and commodities not classified according to kind(93).
There are variations in the Export of products from 2018 to 2021 as affected by both the United States Dollar Index and Proximities. The high value of the United States Dollar Price index led to a decrease in exports compared to the lower Price Index. Any economy exporting one product is better positioned to produce and export other products that share the same technology and institutions; therefore, proximities between products positively affect the production and exportation of products.
Figure 2: Trend of exportation of exports from 2018 to 2021, (a) 2018 (b) 2019 and (d) 2021.
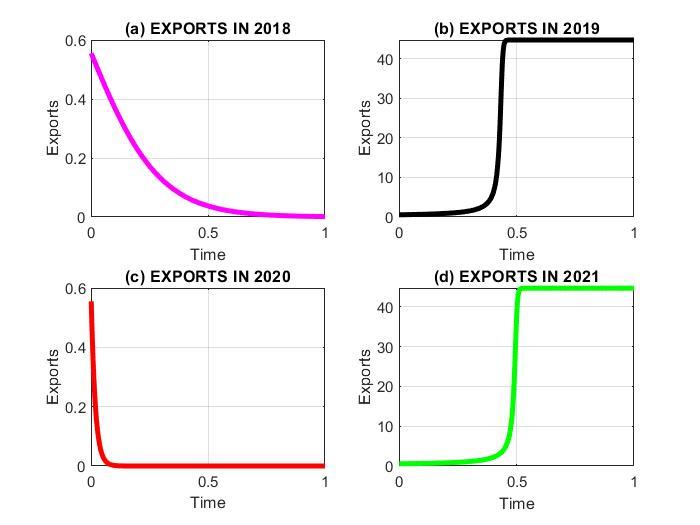
Using the developed mathematical model, Figure 2 shows the trends of Product exports from 2018 to 2021. From figure 2(a), in 2018, there was a minor decrease in exports. Zeng and Hu [14] postulated that World Economies in 2018 faced several uncertainties and factors that affect the resilience of economic systems, such as Unilateralism, Trade Protectionism, and Market fluctuation in oil prices. Figure 2(b) Ciotti et al. [15] stated that the outbreak of Covod-19 was first reported in December 2019; therefore, its major effect on Global product exportation was not expected to be the same year. From the developed model it shows that there was an average increase in Exports of products in 2019. Ponshunmugaraja [16] stated that there was a noted annual increase of Global exports in the dollar term by 2% to the U.S. $ 6.03 trillion. Figure 2(c) shows that in the year 2020, there was a decrease in global exports because the significant effect of the pandemic was evident during this year. Several factors associated with controlling Pandemics, such as Country Lockdowns and Restrictions on the importation, Led to this significant decrease. For example, Heiland and Ulltveit-Moe [17] stated that in just the first quarter of 2020, Container ship departure decreased by 29% compared to 2019. Figure 2 (d) shows an increase in exportation compared to 2021 due to the reduction of lockdown and Import restriction policies. The recovery during the first half of2021 continued tobe synchronous across countries. Its pace continued to evolve [18], andwith time the recovery was stated to be vivid from the second half of 2021.
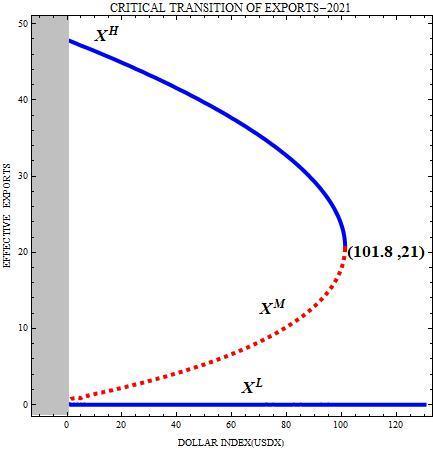
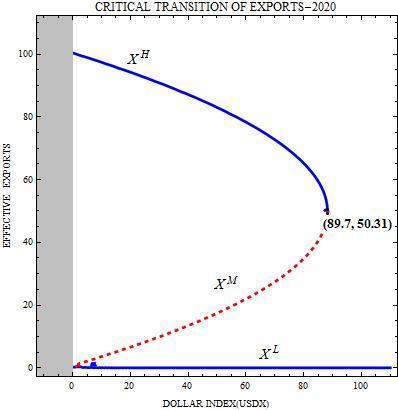
Using the developed Lotka-Volterra mathematical model, The United States dollar Index's critical transition values were determined. The system with a sizeable Critical transition value is more resilient than the system with smaller transition
ISSN 2348-3156 (Print)
International Journal of Social Science and Humanities Research ISSN 2348-3164 (online)
Vol. 10, Issue 3, pp: (210-219), Month: July - September 2022, Available at: www.researchpublish.com
values. From 2018 to 2020, the annual average value for the United States dollar Index is calculated and compared to the transition value. If the data-based value of USDX is smaller than the required critical value of USDX, the system is said to be resilient.
(a) (b)
(c) (d)
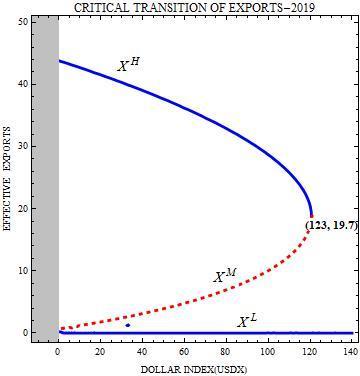
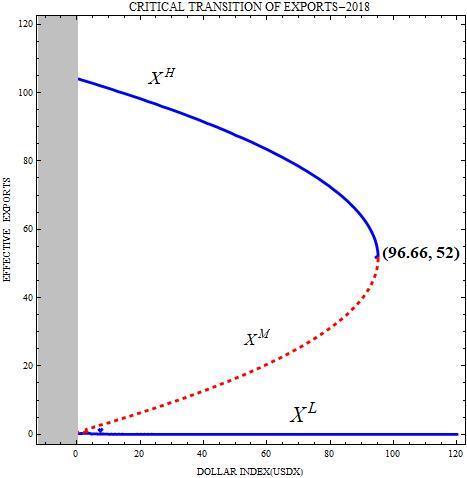
The change in network resilience as a function of the United States Dollar Index (��������(��������)) from 2018 to 2021 (a) 2018(b) 2019(c) 2020 and (d) 2021.
Figure 3 shows the Resilience status of Product exportation as determined by the United States dollar index. Figure 3(a) shows that in the year 2018, the calculated critical transition point of the system was 96.66, and the economy had to export at least 52 products, but the data based on USDX was 93.45. In 2018 the data-based USDX was smaller than the calculated critical point of USDX. For the system to be resilient, an economy should export at least 52 products. From Figure 3(b), in 2019, the calculated threshold value for USDX was 123 when the economy exported 20 products. The data-based USDX was 97.41; therefore, for the system to be stable, at least 20 products should be exported in 2019. Figure 3(c) shows that the Product space network was not resilient in the year 2020; in this year, the data-based USDX was 95.92, which was more significantcomparedtothe89.7criticalUSDXvalueofthesystem..Figure3(d)showsthatduringtheyear2021theresilient state of the system was recovering. In contrast, the Data USDX value was 92.27, which was smaller than the critical value of USDX derived from the system, 101.08. In 2021 for the Product space Network to be resilient, at least 21 countries must be produced and exported.
The system with a larger critical transition value is more resilient; therefore, from figure 3, during the year 2019, the Product space Network was more resilient for all four years from 2018 to 2021. The effect of COVID-19 was more vivid in 2020 as the Product space Network was less resilient in this year while resilient in the other three years, 2018, 2019, and 2021.
ISSN 2348-3156 (Print)
International Journal of Social Science and Humanities Research ISSN 2348-3164 (online) Vol. 10, Issue 3, pp: (210-219), Month: July - September 2022, Available at: www.researchpublish.com
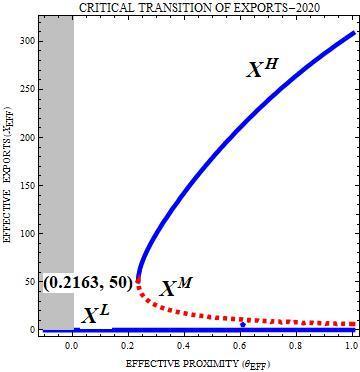
When using Proximities to determine the resilient state of the product space Network system, we use the calculated critical transition point of the developed mathematical model of the Product space network and compare it to the data-based Proximity Index. The system is said to be resilient if the calculated critical transition value of the proximity index is less than the data-based critical transition value.
(a) (b)
(c) (d)
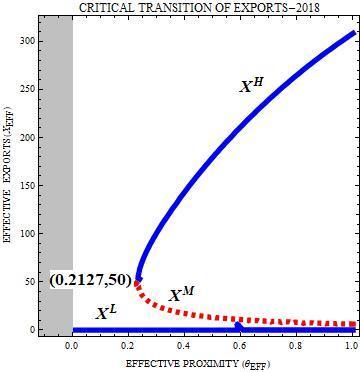
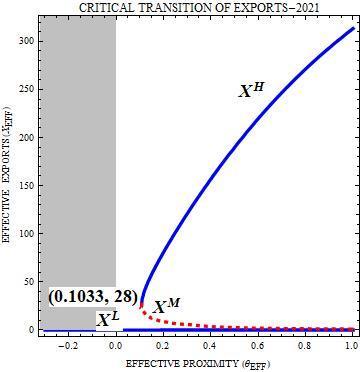
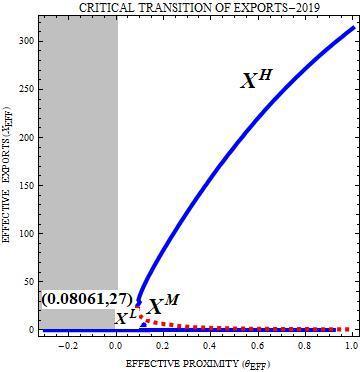
The change in network resilience as a function of Proximities between products (��������(��������)) from 2018 to 2021 (a) 2018(b) 2019(c) 2020 and (d) 2021
Figure 4 shows the Resilience of the Product space Network for each year from 2018 to 2021. Figure 4(a) shows that during 2018, system based Proximity index was 0.2127 when the economy was able to export at least 50 groups of products, whereas the data-based proximity was 0.23194. Since the data-based proximity index is greater than the system based criteria, for the system to be stable, at least 50 groups of products need to be exported. Figure 3(b) shows that During the year 2019, the calculated critical point of proximity index was 0.08061, where 27 groups of products need to be exported. The data-based proximity index is 0.262869; therefore, for the system to be stable, at least 27 groups of products need to be produced and exported. Figure 3(c) portrays that in the year 2020, the calculated critical value of the proximity index was 0.2163 when at least 50 products were exported, but the data-based proximity index was 0.215886. Since the data-
ISSN 2348-3156 (Print)
International Journal of Social Science and Humanities Research ISSN 2348-3164 (online)
Vol. 10, Issue 3, pp: (210-219), Month: July - September 2022, Available at: www.researchpublish.com
basedproximityindex islessthan thesystembasedcriticalvalueoftheproximityindex,thesystemis saidtobenotresilient. Figure 3(d) shows that during the year 2021, the System based calculated proximity index was 0.1033 when at least 29 groups of products need to be exported. The data-based proximity Index was 0.26268; therefore, there was a recovery in the resilient state of the global product space Network system.
Generally using the proximity index value to determine the resilience state of the system, out of four years from 2018 to 2021, in the year 2020, the Global Product space Network lost its resilience. In contrast, due to the reduction of Importation restrictions and loosening the importation restriction in the Year 2021, the Product space Network started to recover into its Resilient state.
The resilience system of the Product space Network can be affected by Economic instabilities. Over the years, the World has been affected by many Economic fluctuations which are named after their causes, such as OPEC Oil Shock[19], Energy crisis [20], Asian Financial crisis [21], 2007-2008 Financial crisis[22], Covid 19-Pandemic [6] and recently RussianUkraine conflict[23]
In This study, the Lotka-Volterra ordinary differential model was developed to study the influence of USDX and Proximity Index in product space network resilience during the COVID-19 Pandemic in particular. Through the determination of critical values of USDX and Proximities. These values were compared with the data-based value to know the resilient state of the product space network each year from 2018 to 2021. This study reveals that the Product space Network was resilient two years before the pandemic was declared a global pandemic. On 30 January 2020, the WHO Emergency Committee declared a global health emergency based on growing case notification rates at Chinese and international locations [25] COVID-19 epidemic has driven a surge in trade costs in the form of trade protectionism, transport costs, tariff increases, and volatile trade policies undermining investment activity and consumer demand for goods and weakening global trade growth[8]. Therefore From this study, the vivid effect of the pandemic was vivid in 2020; that's why figure 3(c) and figure 4(c) show that using critical values of proximity index and USDX leads that the Product space Network was not resilient during this year. The year 2021 recorded the recovery of the system's resilient state due to loosening Restrictions in Importation and Vaccination strategies to enable trade activities to carry on. Generally, a specific international agreement must be required to reduce USDX values and increase the proximity index value among products. The USDX values can be controlled by lowering the United States dollar variation to maintain other countries' Currency value exchange rates variation against the U.S dollar. Strategies to improve the Proximities are through improving technology, inputs, infrastructure, and institutions surrounding the export basket of countries and introducing new goods for exportation.
Besides getting the desired results for the points at which the system changes its resilience characteristics from resilient to non-resilient state, known as critical transition values for USDX and Proximity index, this study has some challenges. Variation of data for the number of reporting exporting Countries whereby in the year 2018, 2019,2020, and 2021 countries which reported were 152,130,68 and 88 respectively, to deal with these, the proximity indices were calculated according to the registered number of countries and exported products. There were no challenges in USDX values as the reported values were timely and updated daily.
In this study, we explored the product's resilience as it could be determined by USDX and Proximity index during the COVID-19 Ranging from the year 2018 before the pandemic to 2021 when there was an advanced control of the pandemic. Beyond the contribution of this study to study the Global level of product exports, more can be extended to explore the local level, Country, or continental level. The resilience of the product space network during other major crises can also be studied, such as OPEC Oil, Energy, financial, and the current Russian-Ukraine conflict.
Conflict of interest statement: This study has no conflict of interest.
Data availability: Open source data, https://comtrade.un.org/data/ and https://www.investing.com/indices/usdollarhistorical-data
ISSN 2348-3156 (Print)
International Journal of Social Science and Humanities Research ISSN 2348-3164 (online) Vol. 10, Issue 3, pp: (210-219), Month: July - September 2022, Available at: www.researchpublish.com
[1] C. A. Hidalgo, B. Klinger, A.-L. Barabási, and R. Hausmann, "The product space conditions the development of nations," Science, vol. 317, pp. 482-487, 2007.
[2] R. Hausmann and B. Klinger, "The structure of the product space and the evolution of comparative advantage," CID Working Paper Series, 2007.
[3] B. Ferrarini and P. Scaramozzino, "The product space revisited: China's trade profile," The World Economy, vol. 38, pp. 1368-1386, 2015.
[4] H. Ito and M. Kawai, "The Global Monetary System and Use of Regional Currencies in ASEAN+ 3," REDEFINING STRATEGIC ROUTES TO FINANCIAL RESILIENCE IN ASEAN+ 3, p. 86, 2021.
[5] M. M. Charme, "Estimating the United States Dollar Index Returns' Value at Risk: Empirical Evidence from RiskMetrics and Simultaneous Bootstrap Quantile Regression Methods," Global Journal of Management And Business Research, 2020.
[6] C. Mena, A. Karatzas, and C. Hansen, "International trade resilience and the Covid-19 pandemic," Journal of Business Research, vol. 138, pp. 77-91, 2022.
[7] R. Ferrer, "COVID-19 Pandemic: the greatest challenge in the history of critical care," Medicina intensiva, vol. 44, p. 323, 2020.
[8] T. D. Vo and M. D. Tran, "The impact of covid-19 pandemic on the global trade," Int. J. Soc. Sci. Econ. Invent, vol. 7, pp. 1-7, 2021.
[9] E. Venturino, "The influence of diseases on Lotka-Volterra systems," The Rocky Mountain Journal of Mathematics, pp. 381-402, 1994.
[10] S.-Y. Wang, W.-M. Chen, and X.-L. Wu, "Competition analysis on industry populations based on a three-dimensional lotka–volterra model," Discrete Dynamics in Nature and Society, vol. 2021, 2021.
[11] Y. Zhang and G. Huang, "Grey Lotka-Volterra model for the co-evolution of technological innovation, resource consumption, environmental quality, and high-quality industrial development in Shaanxi Province, China," Environmental Science and Pollution Research, vol. 28, pp. 57751-57768, 2021.
[12] G. Orlando and M. Sportelli, "Growth and cycles as a struggle: Lotka–Volterra, Goodwin and Phillips," in Nonlinearities in Economics, ed: Springer, 2021, pp. 191-208.
[13] G. Moutsinas and W. Guo, "Node-level resilience loss in dynamic complex networks," Scientific reports, vol. 10, pp. 1-12, 2020.
[14] C. Zeng and Q. Hu, "2018 petroleum & chemical industry development report," Chinese Journal of Chemical Engineering, vol. 27, pp. 2606-2614, 2019.
[15] M. Ciotti, M. Ciccozzi, A. Terrinoni, W.-C. Jiang, C.-B. Wang, and S. Bernardini, "The COVID-19 pandemic," Critical reviews in clinical laboratory sciences, vol. 57, pp. 365-388, 2020.
[16] T. Ponshunmugaraja, "61. THE IMPACTS OF COVID-19 ON GLOBAL TRADE," International Review of Business and Economics, vol. 4, pp. 401-404, 2020.
[17] I. Heiland and K. H. Ulltveit-Moe, "11 An unintended crisis is sea transportation due to COVID-19 restrictions," COVID-19 and trade policy: Why turning inward won't work, p. 151, 2020.
[18] S. Konstas and S. Kalogiannidis, "A Conceptual Forecasting Analysis of International Trade Aspects Based on Globalization Impact Issues," International Journal of Scientific Research and Management, vol. 10, pp. 2881-2887, 2022.
[19] D. Haqeem and N. Zulkifli, "The Opec Oil Price Shock Crisis (1973) And The Actions Taken By The United States," Asia Pacific Journal of Social Science Research, vol. 7, 2022.
ISSN 2348-3156 (Print)
International Journal of Social Science and Humanities Research ISSN 2348-3164 (online) Vol. 10, Issue 3, pp: (210-219), Month: July - September 2022, Available at: www.researchpublish.com
[20] C. Wellum, "Energizing finance: the energy crisis, oil futures, and neoliberal narratives," Enterprise & Society, vol. 21, pp. 2-37, 2020.
[21] E. J. Choi, J. Choi, and H. Son, "The long-term effects of labor market entry in a recession: Evidence from the Asian financial crisis," Labour economics, vol. 67, p. 101926, 2020.
[22] J. L. Fernández Sánchez, M. D. Odriozola Zamanillo, and M. Luna, "How corporate governance mechanisms of banks have changed after the 2007–08 financial crisis," Global Policy, vol. 11, pp. 52-61, 2020.
[23] A. K. Henrikson, "The Trauma of Territorial Break-up: The Russia-Ukraine Conflict and Its International Management Geopolitical Strategy and Diplomatic Therapy," Geopolítica (s), vol. 13, pp. 11-36, 2022.
[24] L. Pan, M. Mu, P. Yang, Y. Sun, R. Wang, J. Yan, et al., "Clinical characteristics of COVID-19 patients with digestive symptoms in Hubei, China: a descriptive, cross-sectional, multicenter study," The American journal of gastroenterology, vol. 115, 2020.
[25] T. P. Velavan and C. G. Meyer, "The COVID‐19 epidemic," Tropical medicine & international health, vol. 25, p. 278, 2020.