International Journal of Civil and Structural Engineering Research ISSN 2348-7607 (Online) Vol. 10, Issue 1, pp: (110-118), Month: April 2022 - September 2022, Available at: www.researchpublish.com
Numerical Study for Progressive Failure of High Rise Stepped Steel Building
Mohamed Basel Emara1, Sameh Moustafa Gaawan2 , Mahmoud Shahat Mahmoud3 , Mohamed Mohamed Yahia4
1Professor of Analysis and Mechanics of Structures, Faculty of Engineering at Mataria, Helwan University, Cairo, Egypt
2Professor of Steel Structures, Faculty of Engineering at Mataria, Helwan University, Cairo, Egypt
3Teaching Assistant of Structural Engineering, Faculty of Engineering at Mataria, Helwan University, Cairo, Egypt
4Assistant Professor of Structural Engineering, Faculty of Engineering at Mataria, Helwan University, Cairo, Egypt
DOI: https://doi.org/10.5281/zenodo.6670584
Published Date: 20-June-2022
Abstract: Progressive collapse of a structure happens when one or more primary members are suddenly lost due to an unfortunate accident such as a gas explosion, bomb attack, fire, or overloaded. Building irregularity is one aspect that might aggravate the damage caused by gradual failure. The progressive failure of high rise stepped frames was investigated using 3-dimensional modelling and the finite element approach in this paper. The steel structure has 30 stories and rigid moment-resisting steel frames. Abaqus software is used to perform nonlinear dynamic analysis in accordance with GSA criteria. The results of Abaqus model are verified with an experimental data and good agreement is achieved. The structural behaviour of the building under sudden column loss was studied in detail using this model for several scenarios of column removal.
Keywords: Progressive failure; Nonlinear dynamic analysis; High rise steel building; Finite element; Column removal.
1. INTRODUCTION
Progressive failure occurs when a system fails in a way that is disproportionate to the reason, and it is frequently brought on by unanticipated extreme occurrences. Over the past years, there have been various cases of buildings failing due to unanticipated loads generated by manmade or natural risks. Vehicle collisions, gas explosions, blast attacks, fire, earthquakes, and rapid column loss are all possible causes of such collapse. Therefore, numerous design codes, standards, and guidelines have been issued in order to prevent the damage caused by progressive failure The American Society of Civil Engineers (ASCE) [1] recommends two general design approaches for sustaining structural integrity following an unforeseen event: direct design approach and indirect design approach. The US General Services Administration (GSA) standards [2], [3] offer linear and nonlinear static as well as dynamic approaches for preventing broad collapse after a local failure. In the framework of the Unified Facilities Criteria, the US Department of Defense (DoD) [4], [5] published a document titled "Design of buildings to withstand progressive collapse" (UFC). This document included procedures for analysing and designing buildings that would be able to endure progressive failure.
Many researchers looked into the behaviour and developed progressive failure design approaches. They conducted their research using a variety of methods, including experimental investigations, numerical models, and analytical methods. Izzuddin et al. [6] created a new methodology for progressive failure assessment. The methodology provides a realistic way to evaluate structural resilience at different levels of structural idealization. Ruth et al [7] evaluated the DoD and GSA guidelines' dynamic increase factor to see how conservative it was. The authors created 11 steel moment frame structures models, including eight two-dimensional and three three-dimensional models. The study showed that a reasonable value of the dynamic multiplier was well below 2.0
International Journal of Civil and Structural Engineering Research ISSN 2348-7607 (Online)
Vol. 10, Issue 1, pp: (110-118), Month: April 2022 - September 2022, Available at: www.researchpublish.com
Khandelwal et al. [8] studied the behaviour of steel constructions with two types of moment resisting frames by removing the central column and assuming the vertical displacement on it. The constructions were made up of three columns that supported two beams of varying spans. The behaviour of the connections was studied, as well as their resistance to tensile forces in the beams. Under static analysis, Kim and An [9] investigated the effect of catenary action on progressive failure of stiff jointed two-dimensional steel frames. Catenary action's contribution to resisting applied load is discovered to be strongly reliant on joint rigidity, and this action is mobilised if beam ends are constrained against lateral displacement.
Feng Fu [10] investigated the behaviour of high-rise buildings under column-loss positions using two 3D models of 20story steel frame buildings that used shear walls and cross bracing to resist lateral loads, respectively. It was demonstrated that numerical findings matched experimental data, indicating that the suggested model was precise enough to reflect the structure's responses in column-loss scenarios. Nonlinear dynamic analysis was carried out using the Alternative Path approach. The author concluded from the findings that the dynamic response of the structure under column-loss scenarios was mostly connected to the affected loading area, with the larger the affected loading area, the greater the potential damage.
Lee et al. [11] provided two nonlinear analysis methods for evaluating the progressive failure potential of welded steel moment frames in a basic but accurate manner. A collapse spectrum was developed to allow for a fast assessment of the maximal deformation demands in progressive collapse. Hoffman and Fahnestock [12] developed three-dimensional nonlinear finite element models to investigate the progressive collapse behavior of typical multi-story steel moment frames buildings with composite steel-concrete floors. They carried out nonlinear dynamic analysis on a 3-storey and a 10-storey building by considering a several of column loss scenarios. The results presented that building height did not significantly affect progressive collapse of steel frames.
Junling Chen et al. [13] carried out a numerical and experimental analysis on a two-story steel moment frame when a side column in the first floor was suddenly removed. The slabs were discovered to be transferring the partial loads previously supoorted by the demolished column to its nearby columns. Due to composite action, the tensions in the beams and vertical movements above the removed column were greatly decreased. Bandyopadhyay et al. [14] established a simplified computational model to investigate the progressive failure of a 3D-skeleton frame without taking into account the slab effect. Utilizing SAP 2000 software, a nonlinear static analysis approach was performed in compliance with UFC (2009) recommendations using the alternate load path method, which cannot capture the whole picture of the dynamic elimination of a column.
2. DEVELOPMENT OF NUMERICAL MODEL
2.1. Model description
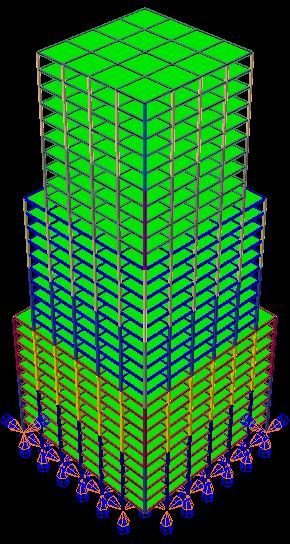
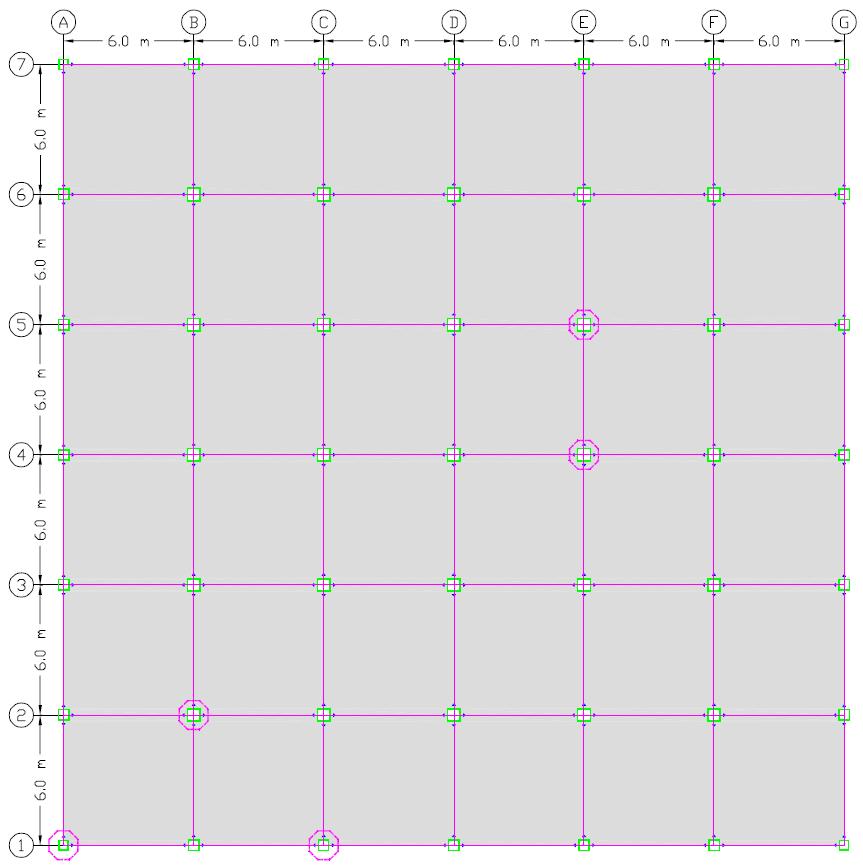
To conduct the progressive failure investigation of a high-rise stepped steel frame building as illustrated in Fig. 1, a threedimensional finite element model was created using Abaqus software [15]. As shown in Fig. 2 to 4, the 3d-model represents the 30 storey examined building with first tenth stories have six spans in both horizontal directions, the second tenth stories have five spans in both horizontal directions, and the third tenth stories have four spans in both horizontal directions, creating stepped frames. The ground level is 4.0 metres tall, while the average floor height is 3.0 metres. Intermediate Steel Moment Resistant frames form the major lateral structural structure. The deck concrete slab is 100 mm thick on average, the columns are hollow box sections, and all of the beams are conventional IPE sections. TABLE I shows the size of each member's section.
2.2. Elements types
Beam element (B31), a 2-node shear deformable element, is used to imitate steel beams and columns. Using this element saves a lot of time when it comes to structural calculations. The relevant cross-sectional shape from the Abaqus crosssection library is used to define the beam characteristics. The four-node uniform thickness shell element (S4R) with bending and membrane stiffness is used to model the concrete slab, which has six degrees of freedom per node.
2.3. Interaction between elements
The concrete slab is modelled using shell elements at the slab centreline, and the structural beam elements are modelled near to the principal beam components' centrelines. To simulate the interaction between steel beams and RC slabs, the beam and shell elements are connected together utilising stiff beam constraint (Tie constraint). Furthermore, by joining
International Journal of Civil and Structural Engineering Research ISSN 2348-7607 (Online) Vol. 10, Issue 1, pp: (110-118), Month: April 2022 - September 2022, Available at: www.researchpublish.com
steel beams and columns directly, the connections between them are treated as rigid connections. To imitate column support, the "Encastre" option was chosen. All degrees of freedom of the supports (rotations and displacement) are restrained to be fixed support at the base level using this option.
2.4. Material Definitions
2.4.1. Steel Material Properties
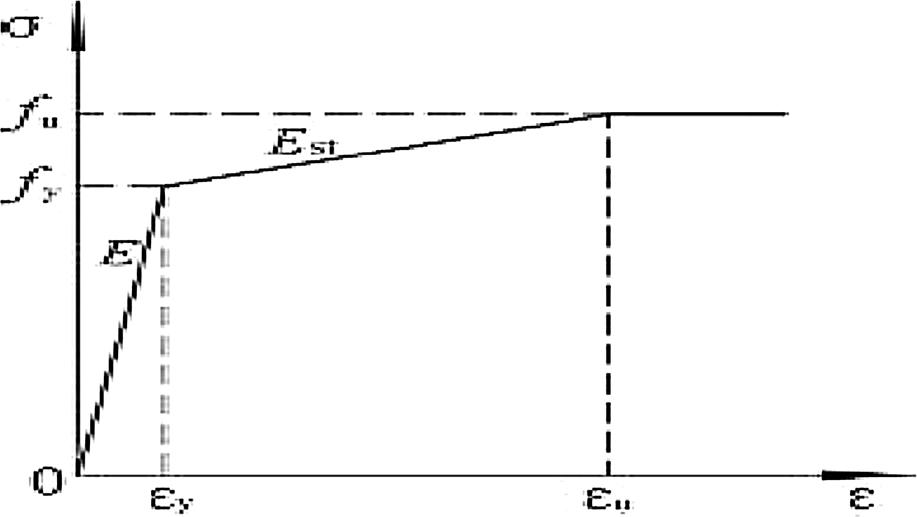
An elastic-plastic material model was used to model all steel members in Abaqus software. The stress–strain relationship of steel, which was obtained using engineering stress–strain diagrams, is required to incorporate material non-linearity in an Abaqus model. The stress-strain relationship is supposed to be the same in compression and tension. As demonstrated in Fig. 5, the bi-linear strength relationship considering stress hardening stiffness after yield is equivalent to 1%Es. TABLE II lists the material properties of the steel elements that were used. Steel's Poisson ratio has been assumed to be 0.3.
2.4.2. Concrete Material Properties
For slab shell elements, an Abaqus concrete damage plasticity model was used to model the concrete material. As demonstrated in Fig. 6, the inelastic behaviour of concrete is represented by the isotropic damaged elasticity idea, as well as compressive plasticity and the isotropic tensile. The compressive yielding curve was taken from ACI 332-08 [17] TABLE III shows the CDP model parameters other than damage variables. The density of the concrete is 2500 Kg/m3 and the elasticity module is 22.1 GPa. For concrete, the Poisson ratio has been calculated to be 0.2.
Fig. 1. 3-D finite element model of 30-storey irregular plan building Fig. 2. Plan geometry of the first tenth stories
International Journal of Civil and Structural Engineering Research ISSN 2348-7607 (Online) Vol. 10, Issue 1, pp: (110-118), Month: April 2022 - September 2022, Available at: www.researchpublish.com
Fig. 3. Plan geometry of the second tenth stories
Fig. 4. Plan geometry of the third tenth stories
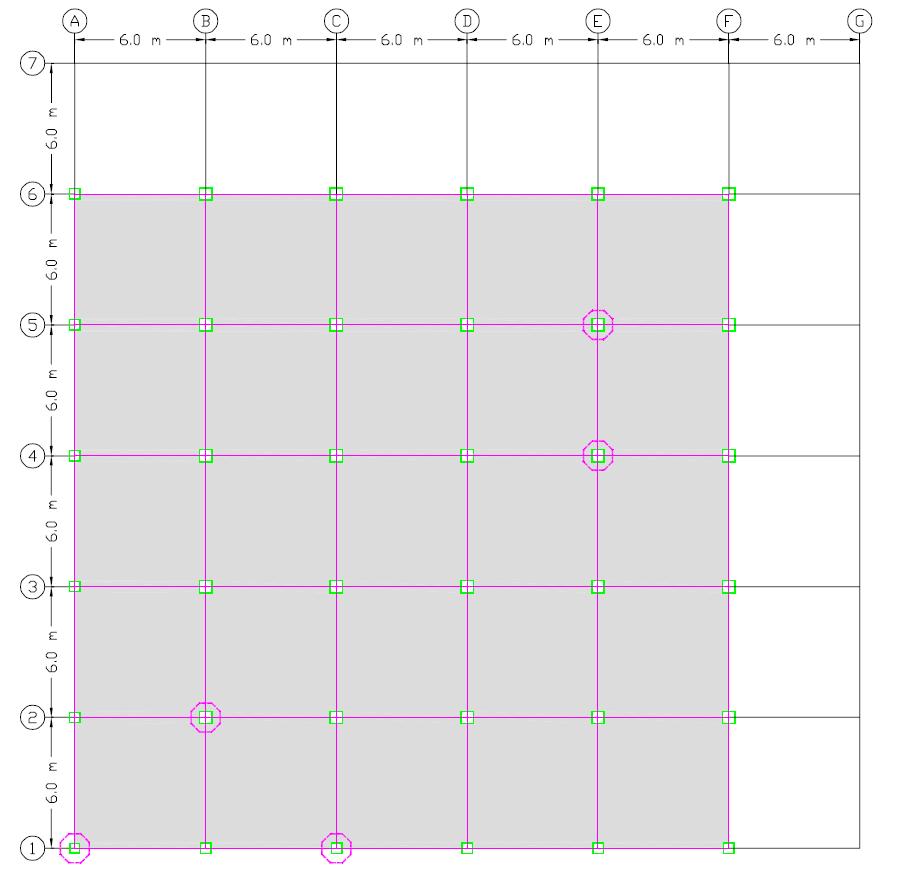
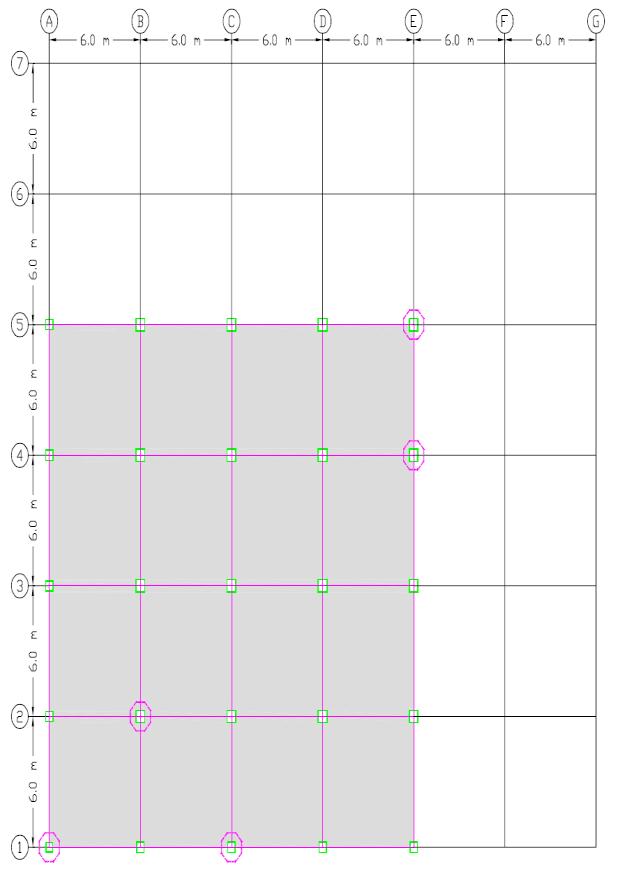
TABLE I: Member sections sizes
tf (mm) tw (mm) bf (mm) d (mm) Section Floor 14.6 13.5 12.7
1-5 6-10 11-15 16-20 21-25 26-30
IPE 450 IPE 400 IPE 360
SHS 450*22 SHS 450*18 SHS 400*14 SHS 350*12 SHS 300*10 SHS 250*8
450 400 400
450 450 400 350 300 250
190 180 170
450 450 400 350 300 250
9.4 8.6 8.0
1-10 11-20 21-30 Beams 22 18 14 12 10 8
22 18 14 12 10 8
Corner columns up to 30 stories 30 25 22 18 14 10
1-5 6-10 11-15 16-20 21-25 26-30
SHS 500*30 SHS 500*25 SHS 450*22 SHS 450*18 SHS 400*14 SHS 350*10
500 500 450 450 400 350
500 500 450 450 400 350
30 25 22 18 14 10
Edge columns up to 30 stories 30 25 22 16 14 10
Interior columns up to 30 stories
1-5 6-10 11-15 16-20 21-25 26-30
SHS 600*30 SHS 600*25 SHS 500*22 SHS 500*16 SHS 400*14 SHS 400*10
600 600 500 500 400 400
600 600 500 500 400 400
30 25 22 16 14 10
12 10 12 10 350 300 350 300 SHS 350*12 SHS 300*10 1-5 6-10
Corner columns up to 10 stories 14 12 14 12 450 350 450 350 SHS 450*14 SHS 350*12 1-5 6-10
Edge columns up to 20 stories
Edge columns up to 10 stories 20 16 12 10
Interior columns up to 20 stories
1-5 6-10 11-15 16-20
1-5 6-10 11-15 16-20
SHS 450*20 SHS 450*16 SHS 400*12 SHS 350*10
SHS 500*22 SHS 500*18 SHS 450*16 SHS 400*12
450 450 400 350
500 500 450 400
450 450 400 350
500 500 450 400
20 16 12 10
22 18 16 12
22 18 16 12
International Journal of Civil and Structural Engineering Research ISSN 2348-7607 (Online) Vol. 10, Issue 1, pp: (110-118), Month: April 2022 - September 2022, Available at: www.researchpublish.com
.
Fig. 5. Stress–strain relationship of steel material [16]
a) Compressive relationship b) Tensile relationship
Fig. 6. Stress–strain relationship of concrete [16]
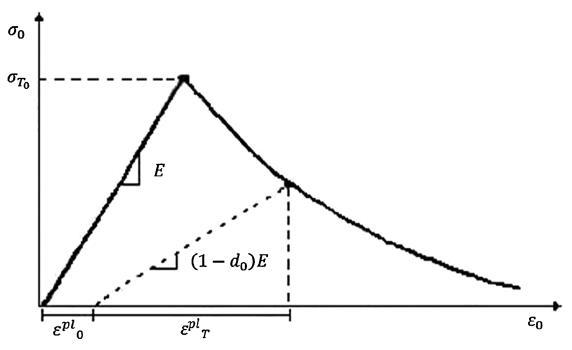
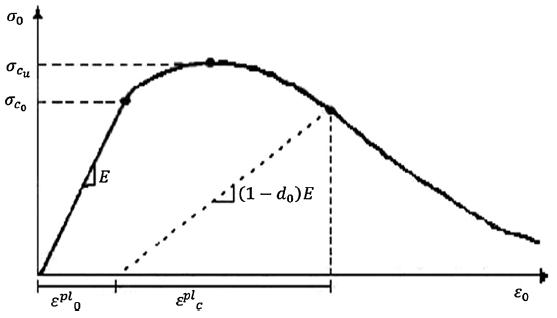
TABLE II: Material properties of the steel used in the study
Ultimate stress (MPa) Yield stress (MPa) Density (kg/m³) Steel material 0.018 0.0018 200000 500 345 7850 ASTM A572
Rupture strain Yield strain Elasticity modulus (MPa)
TABLE III: Concrete damage plasticity (CDP) model values
Parameter Dilation angle (°) Eccentricity fbo=fco k Viscosity parameter Value 36 1 1.16 0.667 0.1
3. VERIFICATION OF THE MODEL RESULTS
Junling et al. [13] employed a numerical model for a two-bay two-story 3D steel–concrete composite frame subjected to rapid column removal to test and numerically validate the numerical model's ability to conduct progressive failure analysis under column removal scenarios. The longitudinal and transverse bay lengths were 4.0 and 2.0 metres, respectively, with a consistent story height of 2.0 metres. The cross section of beams and columns are H-shaped sections The dimensions of transverse beams were 150×75×5×7, longitudinal beams were 200×125×6×8, and columns were 150 × 150 × 7 × 10 The slab was 130 mm thick, and the rebar was spaced 150 mm apart in both directions. The longitudinal beams were built of Q460 steel with yielding stress (Fy = 460 MPa), whereas the columns and transverse beams were made of Q235B steel with yielding stress (Fy = 235 MPa). The steel's elastic modulus was 206,000 MPa, and the Poisson's ratio was 0.3. The C40 concrete slabs (with a yielding capability of 40 MPa) were cast in place to make the concrete slabs. 3.5 % was chosen as the damping ratio.
International Journal of Civil and Structural Engineering Research ISSN 2348-7607 (Online)
Vol. 10, Issue 1, pp: (110-118), Month: April 2022 - September 2022, Available at: www.researchpublish.com
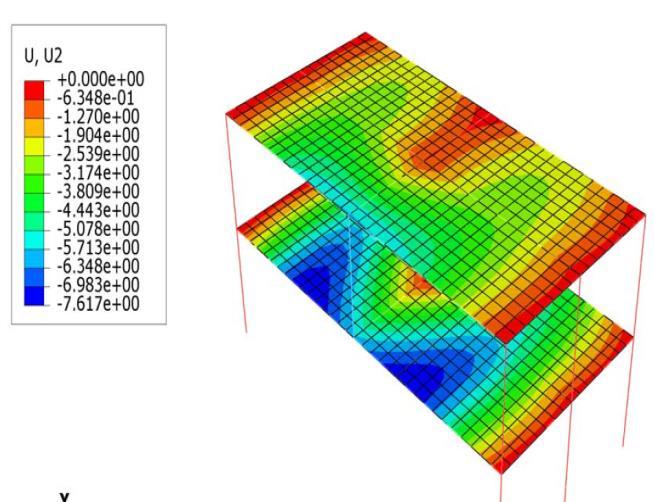
The experimental test setup is illustrated in Fig. 7, and the loading parameters have already been discussed in detail by Junling et al. [13], thus they will not be reproduced here for brevity. The deformed shape view of the 3D composite building in the vertical direction following column removal is shown in Fig. 8, which shows that the greatest vertical displacement was 7.62 mm, which is in good agreement with the experimental and numerical results acquired by Junling et al. [13]. The highest vertical displacement in the experimental test was 4.9 mm, and the numerical model created by Junling et al [13] using Ansys software yielded a value of 7.4 mm.
4. NONLINEAR DYNAMIC ANALYSIS PROCEDURES
4.1. Loading
Progressive failure is fundamentally a dynamic event; the sudden loss of a column releases significant internal energy, disrupting the initial load equilibrium of external loads and internal forces, which must be absorbed by the ductile elements of the remaining structure in order for the structure to reach a new equilibrium position, failing otherwise. In order to produce precise and realistic results, the nonlinear dynamic analysis approach was applied in this study. According to GSA (2003), dead loads + 25% of live loads are applied downward to the structure for dynamic analysis. There were two kinds of loads applied to the floors: total dead load and live load. The total dead load (DL) was 5.0 kN/m2 in all floors except the roof, and the live load (LL) was 2.5 kN/m2. The total dead (DL) for the roof was set at 4.0 kN/m2. The live load (LL) on the roof is 1.0 kN/m2. In the meantime, the uniformly distributed load caused by walls on the building's outer beams was estimated to be 7.0 kN/m. Only the parapet load was applied to the roof wall load of 3.0 kN/m on the outer beams.
4.2 Case studies of column removal scenarios
The most common column removal occurs on the ground floor, as this creates the most critical structural stability conditions. In order to produce meaningful failure configurations, a variety of column-removal cases have been proposed. In each of these cases, a column is abruptly removed, and the structure's response is investigated using nonlinear dynamic analysis. TABLE IV displays the columns that have been selected for removal.
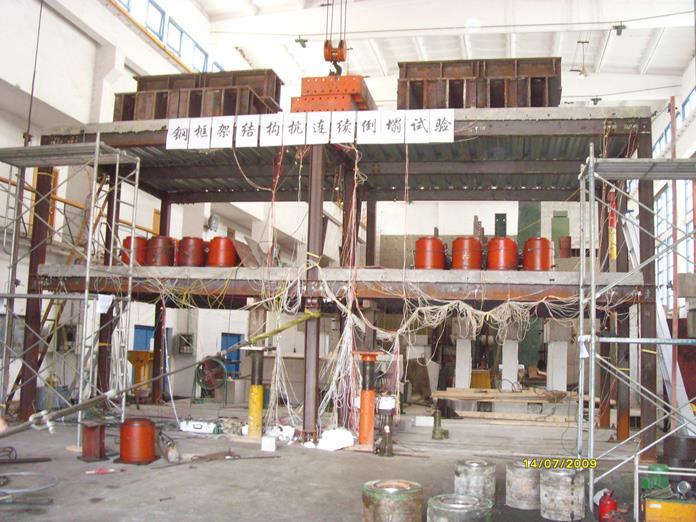
TABLE IV: Column removal cases
S-1A1
International Journal of Civil and Structural Engineering Research ISSN 2348-7607 (Online) Vol. 10, Issue 1, pp: (110-118), Month: April 2022 - September 2022, Available at: www.researchpublish.com
S-2B21 21 B 2 9 S-1A30 30 A 1 10 S-1C30 30 C 1 11 S-2B30 30 B 2 12
S-4E1 1 E 4 13
S-4E11 11 E 4 14 S-4E21 21 E 4 15 S-4E30 30 E 4 16
S-5E1 1 E 5 17 S-5E11 11 E 5 18 S-5E21 21 E 5 19 S-5E30 30 E 5 20
4.3. Cases of column removal at different story levels
For all cases of column removal scenarios, the vertical displacement time history for the node above the removed columns is displayed in Fig. 9 to 12. Fig.9 displays the vertical displacement of the node above the removed corner column (1A) at the 1st story, 11th story, 21th story and 30th story. The maximum displacement of the node above the removed corner column (1A) is 521 mm at the 30th story which is much larger than that at the other scenarios at the lower stories. Also, it is evident that the remaining building vibrates more severely after removing the corner column at the 30th floor than it does after removing the corner column at the 1st, 11th, and 21st stories.
Time ( S )
-550 -500 -450 -400 -350 -300 -250 -200 -150 -100 -50 0 0.0 0.5 1.0 1.5 2.0 Vertical Displacement (mm)
Vertical Displacement (mm)
Vertical Displacement (mm)
0 0.0 0.5 1.0 1.5 2.0
-30
-60
-90
-120
-150
Fig.9 Displacement of the node above the removed corner column (1A) Fig.10 Displacement of the node above the removed edge column (1C)
Time ( S )
0 0.0 0.5 1.0 1.5 2.0
-30
-60
-90
-120
S-4E1 S-4E10 S-4E20 S-4E30
Time ( Sec. ) S-1A1 S-1A11 S-1A21 S-1A30 -150
Vertical Displacement (mm)
Time ( S )
0 0.0 0.5 1.0 1.5 2.0
-30
-60
-90
-120
S-5E1 S-5E10 S-5E20 S-5E30
S-1C1 S-1C10 S-1C20 S-1C30 -150
Fig.11 Displacement of the node above the removed interior column (4E) Fig.12 Displacement of the node above the removed interior column (5E)
Research Publish Journals
International Journal of Civil and Structural Engineering Research ISSN 2348-7607 (Online) Vol. 10, Issue 1, pp: (110-118), Month: April 2022 - September 2022, Available at: www.researchpublish.com
At the 1st storey, 11th story, 21st story, and 30th story, the vertical displacement of the node above the removed edge (1C), interior (4E), and interior (5E) columns is shown in Figs. 10 to 12. The 30th storey has a greater potential for both edge and interior column removal than the lower stories, with the maximum displacement of the node above the removed edge column (1C), interior (4E), and interior (5E) at the 30th story being 145, 146, and 147mm, respectively. The vertical displacement of the node above the deleted interior column is smaller than that of the removed corner column due to spatial impact, catenary action, and more members dissipating energy (1A).
4.4. Plastic hinge rotation and ductility values for stepped building
Plastic deformations or hinge rotations, as recommended in GSA [3] recommendations for evaluating the structures performance under nonlinear dynamic analysis, may be more realistic than GSA [3] criteria for force demands or demand capacity ratio (DCR) values. Table 4.10 summarises the ductility values and maximum rotation angle for the tested cases of column removal scenarios. The rotations of the plastic hinges in all cases are less than the GSA's approval threshold of 12°. Furthermore, the ductility values are less than 20, indicating that the irregular plan building under study is not prone to progressive collapse.
TABLE V: Axial force in critical adjacent columns for 1st story removal scenarios
Column plan position
Column removal scenario
Vertical displacement at point just above removed column (mm)
Ductility
Rotation (Degree)
0.55 0.88 58 S-1A1
Corner (1A) 0.83 0.96 87 S-1A11 1.10 0.99 115 S-1A21 4.66 1.76 489 S-1A30 0.61 0.98 64 S-1C1 Edge (1C) 0.89 1.002 93 S-1C11 1.15 1.003 120 S-1C21 1.28 1.01 134 S-1C30 0.65 1.02 68 S-4E1 Interior (4E) 0.94 1.01 98 S-4E11 1.28 1.035 134 S-4E21 1.38 1.05 145 S-4E30 0.65 0.99 70 S-5E1 Interior (5E) 0.95 1.005 97 S-5E 11 1.17 1.01 129 S-5E 21 1.30 1.03 149 S-5E 30
5. CONCLUSION
In this research, a stepped building with moment-resisting frame is investigated by using the finite element software Abaqus to study the behaviour of 30-storey stepped steel building under sudden column removal It can be concluded that the 30-storey stepped building designed to meet American requirements has appropriate load paths and redundancy to prevent the spread of local failure caused by unexpected column removal. Also, because there is less spatial effect and members dissipating energy, the ability of the remaining structure to dissipate energy after a corner column loss is weaker than after an edge or middle column removal. Also, single column removal scenarios for the moment resisting frame system of the examined stepped building are not susceptible to to progressive collapse where they meet the GSA approval criteria, according to the analysis results ductility and plastic hinge values are with accepted range.
REFERENCES
[1] ASCE. SEI/ASCE 7-10, Minimum Design Loads for Buildings and Other Structures, American Society of Civil Engineers, Washington DC, 2010.
[2] GSA. Progressive collapse analysis and design guidelines for new federal office buildings and major modernization projects. The US General Services Administration; 2003.
[3] GSA. 2013. Alternate Path Analysis and Design Guidelines for Progressive Collapse Resistance. General Services Administration (GSA). Washington, D.C.
International Journal of Civil and Structural Engineering Research ISSN 2348-7607 (Online) Vol. 10, Issue 1, pp: (110-118), Month: April 2022 - September 2022, Available at: www.researchpublish.com
[4] Unified Facilities Criteria (UFC)-DoD. Design of buildings to resist progressive collapse. Department of Defense; 2005.
[5] Unified Facilities Criteria (UFC)-DoD. Design of buildings to resist progressive collapse. Department of Defense; 2009.
[6] Izzuddin BA, Vlassis AG, Elghazouli AY, Nethercot DA. Progressive collapse of multi-storey buildings due to sudden column loss Part 1: simplified assessment framework. Eng Struct 2008;30(5):1308–18.
[7] Ruth, P., Marchand, S.M. and Williamson, E.B. (2006) Static equivalency in progressive collapse alternate path analysis: reducing conservatism while retaining structural integrity. Journal of Performance of Constructed Facilities: ASCE, 20: (4): 349–364.
[8] Khandelwal, K., El-Tawil, S. and Sadek, F. (2009) Progressive collapse analysis of seismically designed steel braced frames. Journal of Constructional Steel Research, 65: (3): 699-708.
[9] Kim J, An D. Evaluation of progressive collapse potential of steel moment frames considering catenary action. Struct. Design Tall Spec. Build. 2009;18:455–65.
[10] Feng, F. (2009) Progressive collapse analysis of high-rise building with 3-D finite element modelling method. J Constr Steel Res, 65: 1269–1278.
[11] Lee CH, Kim SW, Han KH, Lee K. Simplified nonlinear progressive collapse analysisof welded steel moment frames. J Constr Steel Res 2009;65:1130–7.
[12] Hoffman, S.T. and Fahnestock, L.A. (2011) Behaviour of multi-storey steel buildings under dynamic column loss scenarios. Steel Compos. Struct., 11: (2): 149-168.
[13] Junling, C., H. Xin, M. Renle, and H. Minjuan. 2012. “Experimental study on the progressive collapse resistance of a two-story steel moment frame.” J. Perform. Constr. Facil. 26 (5): 567–575.
[14] Bandyopadhyay, M., A. K. Banik, and K. D. Tushar. 2016. “Progressive collapse of three-dimensional semi-rigid jointed steel frames.” J. Perform.Constr. Facil. 30 (3): 04015051.
[15] ABAQUS, ABAQUS/standard, Version 2017, ABAQUS, Inc., Pawtucket, R.I, 2017.
[16] Rohola Rahnavarda, Faramarz Fathi Zadeh Fard, Ali Hosseini and Mohamed Suleimand (2018) Nonlinear Analysis on Progressive Collapse of Tall Steel Composite Buildings
[17] ACI 332-08, Code Requirements for Residential Concrete and Commentary, American Concrete Institute, 2008.
Research Publish Journals
