ISSN 2348-1218 (print)
International Journal of Interdisciplinary Research and Innovations ISSN 2348-1226 (online) Vol. 8, Issue 2, pp: (50-58), Month: April - June 2020, Available at: www.researchpublish.com

ISSN 2348-1218 (print)
International Journal of Interdisciplinary Research and Innovations ISSN 2348-1226 (online) Vol. 8, Issue 2, pp: (50-58), Month: April - June 2020, Available at: www.researchpublish.com
Ayuba Abubakar Fusami1, Abubakar Abdulgaffar A.2 , Hassan Hashimu Abdu3 , Abubakar Muhammad Yarima4
Department of Surveying and Geoinformatics, ATBU Bauchi
Corresponding Author Email fusamiabubakar@yahoo.com abdul.3plea@gmail.com surveyorhassan@gmail.com maybfika@gmail.com
Abstract: Effect of desertification in Sub-Saharan Africa is one of the challenges affecting the region and has produced a lot of damages to its socio-economic activities. It can be seen in crop failures, livestock mortality and drought leading low economic output. The research attempts to evaluate the level of desertification in Yunusari Local Government Area. Satellites imageries with temporal and synoptic view were used in the assessment of desertification using supervised classification by maximum likelihood technique. Imageries from 1988 to 2018 at interval of ten years (10) were used. Early warning to the appropriate beneficiaries will strengthen capacity and increasing resiliency in disaster risk reduction and mitigation process. The findings in this research identified decrease healthy vegetation, increase arid land and increase dunes area coverage. This indicates desertification in the study area has increased, 41.215km2 of land areas covered by healthy was lost between 1988 and 2018, while arid land areas and dune fields increased from 398.113km2 in 1988 to 439.328km2 in 2018.
Keywords: Desertification, monitoring and mitigation
Agricultural activities, fuel wood collection, settlements and over grazing are element of desertification where by lands use was changed to suite human need but it imparts negatively on the soil fertility, vegetation cover and forest land Rapp A. (2019), viewed desertification problem and its processes to confusing and not been clearly defined. To Panel et al. 2019, desert can be seen as a mixture of particulate matter emitted from the surface of arid and semi-arid regions. Desertification can be seen as the changes from productive to unproductive land as a result of man-induced activities (Sen Li et al. 2019) Ismat M., (2004) concluded that desertification in tropical Africa was due to man's activity and not as a result of the Sahara spreading or climatic causes. In an International Conference on Desertification held by United Nations in Nairobi, Kenya (August and September of 1977) with representatives from at least 100 nations, projected that from 1969 to 1973, drought in African Sahel savannah has affected six countries to the southern border, it led to the deaths of thousands people and the disruption of millions of livestock. The growth domestic product of the areas was affected too. At the global level, it is estimated that the annual income of areas immediately affected by desertification has decreased by 42 billion American dollars (Musa et al 2010). Morgan et al. (2016) carried a research on how desertification affects ecosystems where experimental plots were established and divided among controls of experimental manipulations. Their result shows the response to populations and communities to long‐term changes in climate and habitat with challenging effect to ecosystems.
Desert encroachment being an environmental problem that affects northern Nigeria, heading towards the southern part may lead to a lot of socio-economic problem. Even though desertification is an age-old phenomenon, it affects countries
ISSN 2348-1218 (print)
International Journal of Interdisciplinary Research and Innovations ISSN 2348-1226 (online) Vol. 8, Issue 2, pp: (50-58), Month: April - June 2020, Available at: www.researchpublish.com
and people over the world either directly or indirectly, what seems certain about desertification is that, it has effect on social, economic and political dimensions of existence (Elijah E. et al 2013). Environmental sustainability does not only include proper description of the respective threats, but also a definition of systematic pathways on how these problems can be approached methodologically (Hill et al. 1995). Monitoring desertification can be made through measuring land degradation processes. This is rather unspecific system which may involve a large array of processes, each with its own boundary conditions for its detection or monitoring (Hoffman, T. 2002). The conventional method has short of standardization because of its range of criteria and indicators (Hill, 2004). Various data source available through remote sensing offers possibility of gaining temporal environmental data sources or inventory in monitoring desertification, however, it is obvious that it can play a vital role in assessing and monitoring desertification. Sen-Li et al. (2019) uses Grain-to-Green Program (GTGP) in northern China to monitor the conversion from grassland to cropland. Their program of grassland reclamation has significantly increased and was evaluated using a Landsat dataset in the northern China region. Their result shows grassland reclamation increased by 411.29 km2 from 2010 to 2015 and was mainly distributed in the southeastern and southwestern parts of the MUD, accounting for 9.78% of the total cropland area in 2015.
The assessment methods may evolve from classical field survey for soil and vegetation mapping, land suitability evaluations and to the more recent approaches (Imeson, 2005). Ground-based methods score low for most of the practical requirements, but based on broad field experience, they yield very accurate results in relatively small areas. These initial mapping experiments on one hand suffered from methodological shortcomings but also revealed major deficits due to the limited availability of data layers on large scale (Grimm et al., 2001). Vegetation indexes derived from satellite images provide accurate monitoring of the degree of desertification (Rapp A. 2019). The vegetation index represents biological and physiological characteristics of vegetation through remotely sensed data. Normalized Difference Vegetation Index (NDVI), Soil Adjusted Vegetation Index (SAVI) and Modified Soil Adjusted Vegetation Index (MSAVI) have also been used to index the desertification process and change monitoring (Li and Zhou 2002). NDVI is one of the most common vegetation indexes and provides information about vegetation cover on the ground surface (Rapp A. 2019). Gunin et al. (2019), shows how NDVI was used in monitoring current state of the dry-steppe, desert-steppe, mountain-steppe, and desert ecosystems of the Gobi Desert (Mongolia) where their results indicate a decrease in the phytocenotic indicators of plant communities, deterioration of the state of dominants, also a change in composition of soil has been revealed and the proportion of desert shrubs.
Guishan Cui, et al, (2011) uses vegetation and soil change indices to extract desertification trend in China determined by classifying the land cover into four categories to reveal the latent state of desertification. Jennifer Yu (2010) studied of vegetation change of the Ansai region of Shaanxi, China from 1998 to 2010. She discovered that there was a net gain of vegetation from 1998-2010 in the Ansai region of Shaanxi. Based on the Class Statistics output of her data, she saw more positive change (increase in vegetation) overall when compared to negative change (a decrease in vegetations). There is need to provide stakeholders with a sound assessment of present stage and, if possible, the temporal development thereof of information needed for larger landscape units, through integrating field based approaches with remote sensing techniques about the dangers and level of encroachment posed by desertification.
Yunusari Local Government Area (LGA) of Yobe state has an area of 3,790km², located within the geographical coordinates of 12⁰52'15"N - 13⁰11'15"N of the equator and between 11⁰17'20"E - 12⁰34'17"E meridian. The mean annual temperature degrees range between 36°C and 46°C, during summer and decreases down to 250C during the month of September to December. Rainfall ranges between 400 mm and 800 mm during rainy season with an annual mean of 650 mm for about 120 days. It is a Sahel savannah zone with sparse grassland, desert shrub and taller trees The climate is characterized by hot summers and cool rainy winters. To the north, the Sahel is bounded by the Sahara, a belt of dry tropical savanna with a summer rainy season that extends across Africa from east to west (Ndiaye, O. et al, 2011). It is a belt of semi-permanent subtropical warm pressure where the air from upper levels of the troposphere tends to sink towards the ground. This steady descending airflow causes warming and drying effect in the upper troposphere (Hostert, P. et al, 2004) It is a transition zone of Africa between the Sahara to the north and the Sudanian Savanna to the south (Natalie and Sumant, 2018).
ISSN 2348-1218 (print)
International Journal of Interdisciplinary Research and Innovations ISSN 2348-1226 (online) Vol. 8, Issue 2, pp: (50-58), Month: April - June 2020, Available at: www.researchpublish.com
Figure 1.1a: Map Nigeria showing the study area Figure 1.1b: Google earth map the study area (Arc Gis Shapefile) (www.google.com)
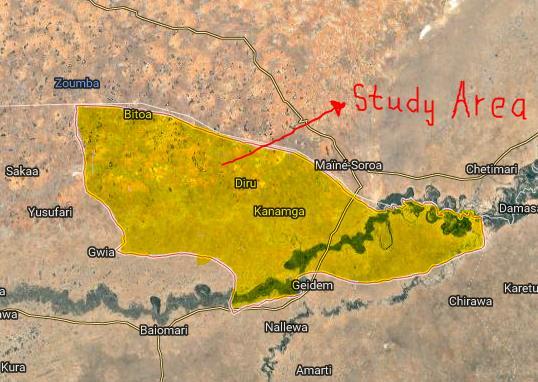
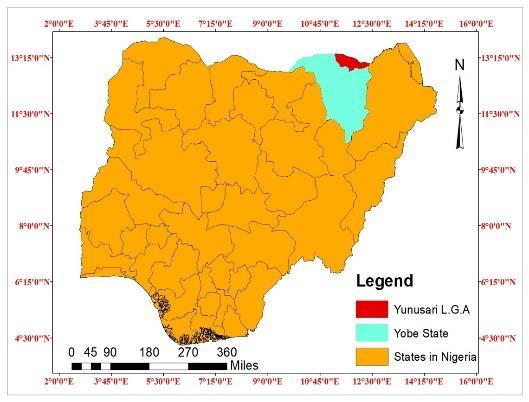
Table 1.1 shows the summary of materials used in the study. Satellite datasets were acquired from United States Geological Survey Agency (USGS) of 30 years from 1988-2018 at the interval of ten years. To Sen Li et al. (2019) desertification can be effectively monitored and evaluated using a Landsat dataset. Mobile topographer was used in ground truthing of the classified data.
TABLE 1.1: DATASET AND SOURCES
S/N DATA TYPE SOURCE
1 Yunusari shape file
Secondary Nigerian political boundary map
2 Satellite imagery Primary USGS (1988, 1998, 2008 and 2018)
3 Epoch images Primary http://earthexplorer.usgs.gov/
To ensure quality of end result, image processing was carried out to restore the quality of representation of the earth surface and geometrically restoring the image. Most of the distortions were restored by USGS, they include: Random noise removal (noise due to unpredictable and unsystematic performance of the sensor or transmission of the data); and destriping formed from detectors going out of calibration. Image enhancement is followed to modify images for suitable human vision capability.
Using Arc GIS 10.3, multiple bands were composed to form a composite band with RGB colors which aided the visualization of the imageries. The study area requires two scenes to covered by row 51 path 186 and row 51 path 187, the two images were mosaicked to carve out the study area. The study area was extracted from large imagery using a shapefile obtained. NDVI was used to quantify vegetation by measuring the difference between near-infrared (which vegetation strongly reflects) and red light (which vegetation absorbs). It always ranges from -1 to +1 but there is not a distinct boundary for each type of land cover. Negative values (approaching -1) correspond to water. Values close to zero (-0.1 to 0.1) correspond to barren areas of rock, sand, or snow, low positive values represent shrub and grassland (approximately 0.2 to 0.4) (Buczak, et al. (2012), while high values indicate temperate and tropical rainforests (values approaching 1). It is given by:
NDVI
For healthy vegetation (chlorophyll), it reflects more near-infrared than green light compared to other wavelengths but it absorbs more red and blue light (National Aeronautics and Space Administration, Science Mission Directorate) (Signorelli S. et al, 2016).
ISSN 2348-1218 (print)
International Journal of Interdisciplinary Research and Innovations ISSN 2348-1226 (online) Vol. 8, Issue 2, pp: (50-58), Month: April - June 2020, Available at: www.researchpublish.com
Land cover classification depends on two things: the presence of distinctive signatures for the land cover classes of interest in the band set used; and the ability to reliably distinguish these signatures from other spectral response patterns that are present. To achieve this, training sites signature file were created from training samples for each class. Representative training sites were chosen using NDVI created from the satellite imagery for each selected year. However, during classification of the image, the spectral signature of buildings was clashing with that of trees, thus they were classified as trees and buildings. The following were classification schemes used in the research:
i. Wet land: Consisting of surface water river, lakes, ponds a stream or standing body of water
ii. Trees and buildings: These are riparian tree, buildings, marsh woodland, trees inundated by water, orchard, planted trees, trees taller than 5m and short trees.
iii. Vegetated soil: It consist of shrub less than 3m tall, mixed species, inundated shrubs and grass in water.
iv. Dry land: These are dunes of bare ground, bare ground and dry mud.
v. Arid land: comprises of sand dunes and very dry bare soil
vi. Healthy vegetation; these are vegetation that are very healthy in nature, greener areas.
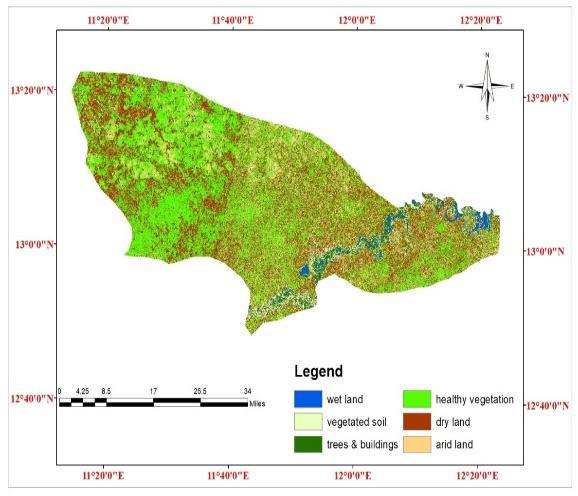
The Fig. 1.2a shows study area land cover in 1988. It was observed that the spatial coverage of wet land was mostly seen along the river valleys of Komadugu Yobe. The western parts of the study area have higher densities of healthy vegetation, shrubs and grassland and also on the flood plains of River (Komadugu) Yobe, while the eastern parts of the area are mostly covered by few patches of shrubs and grass and scattered trees. From the map, arid land covered 9%, dry land 36%, wet land 5%, trees and buildings 3%, vegetated soil 8% and healthy vegetation 39%. The NDVI classification in fig. 1.2b shows the range of values from -0.389 to +0.414 indicating that the dry land in the area was of significance, however, the healthy vegetation was the dominant land cover.

Figure 1.2a.1: land use/land cover map 1988
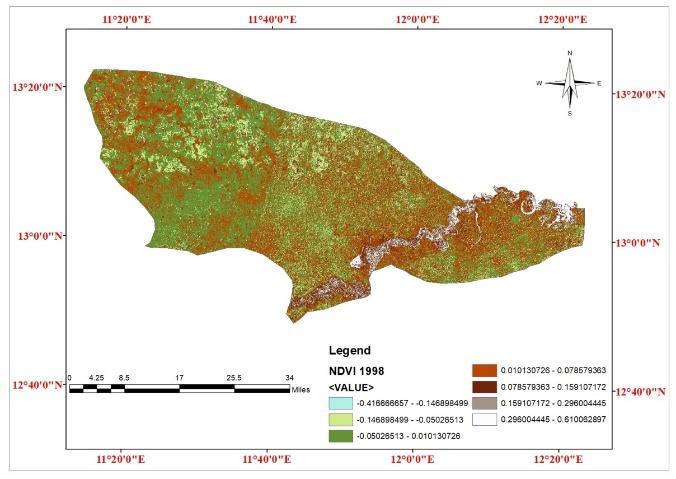
Figure 1.2b.1: NDVI map 1988
The spatial distribution of the various landcover types in the area in 1998 is shown in Fig. 1.3a. The period between 1988 and the year 1998 recorded a change in the landscape of the study area. The nature of the landscape showed that water was also mostly found in river valleys and some patches around the western and some scanty areas which can be hardly seen because of its quantity. Consequentially, the arid land and sand dunes were found to be more pronounced in 1998 than in 1988. During this period, major parts of the study area were covered by dry land and healthy vegetated land where, dry land was 36% which shows an increase of 3%, healthy vegetation was 39% a 2% decrease also wet land was 0.7% less than in 1988, arid land and vegetated soil also experienced changes from 9% to 10%, and 8% to 7% respectively while, trees/buildings maintained 3%. The NDVI classification in fig. 1.3b shows the range of values from0.417 to +0.610 indicating that the area was mostly covered with healthy vegetation; however, the dry land is the dominant land cover.
4.3
ISSN 2348-1218 (print)
International Journal of Interdisciplinary Research and Innovations ISSN 2348-1226 (online) Vol. 8, Issue 2, pp: (50-58), Month: April - June 2020, Available at: www.researchpublish.com
Figure 1.3a: land use/land cover map 1998
1998 and 2008
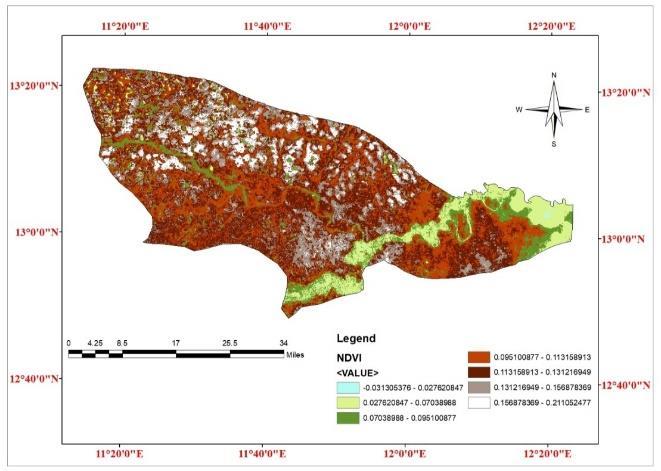
Figure 1.3b.1: NDVI map 1998
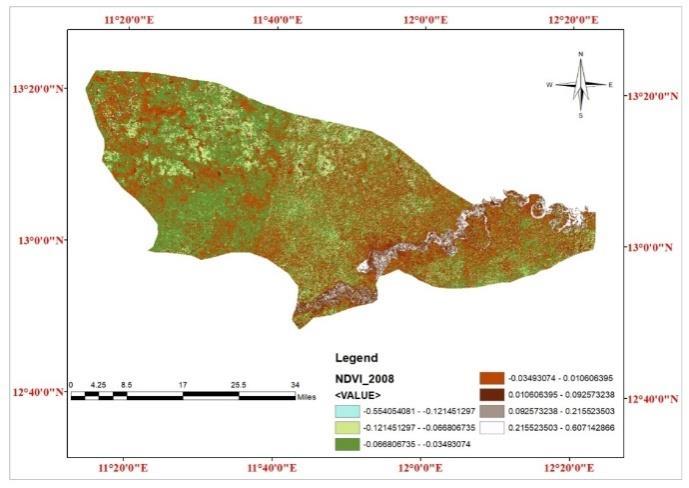
Figure 1.4a shows the spatial distribution of landcover in the area in 2008. The image still revealed the southward shift in the area coverage of bare land areas and dune fields in the northern and central parts of the study area. The landscape also showed that healthy vegetation dominates in the study area, the areas maintained their vegetation cover mainly due to the soil type in the area which is clay-silt and retains moisture for a long period. Re-growth of trees and grasses were also found around some places as also shown by the increase in land area of shrubs and grasses. However, the map of the area still reveals the expansion of area coverage of arid land and buildings in most parts of the study area as also complemented by the increase in urbanization activities during the study period. The relative percentage of the various classes, the analysis of 1998 and 2008 indicates; a decrease in healthy vegetation, and wet land from 37% to 31%, and 3.96% to 3.46% respectively while an increase in area covered by dry land from 39% to 43% and arid land also increased from 10.28% to 10.85%, trees and buildings from 2.7% to 3.0% vegetated soil from 7% to 8%. The NDVI classification in fig. 1.4b shows the range of values from -0.554 to +0.607 indicating that the healthy vegetation values reduced compared to that of 1998, however, area covered by healthy vegetation was about 31% of the total area.


The spatial distribution of landcover in the area in 2018 is shown in Fig. 1.5a. By 2018, the landcover of the study area indicates that accumulation of surface water was mostly seen at the northeastern part of KomaduguYobe. There was disappearance of healthy vegetation; trees, shrubs and grasses were found at the rivers valleys. (Amadi, Maiguru, Zaku and Yakubu, 2013) report on desertification conclude that conducive climate can reduce the rate of desertification, in this study, despite the increase in vegetated soil the healthy vegetated land area still, Yunusari Local Government Area experienced a huge change as revealed from the statistical values which shows the dominance of dry land covering 47%
ISSN 2348-1218 (print)
International Journal of Interdisciplinary Research and Innovations ISSN 2348-1226 (online) Vol. 8, Issue 2, pp: (50-58), Month: April - June 2020, Available at: www.researchpublish.com
an increase 4% to that of 2008 which was 43%, trees and buildings increased from 3% to 5%, arid land increased very scantly with 0.494 as seen in table 4.3, however, both healthy vegetation and wet land areas decreased from 31% to26% and 4% to 3% respectively. The NDVI classification in fig. 1.5b shows the range of values from -0.030 to +0.211 indicating that the area covered by healthy vegetation reduced compared to that of 2008 where it reduced by 5%
Figure 1.5a: land use/land cover map 2018
Figure 1.5b: NDVI map 2018
The trend of changes in land area covered by wet land, trees and buildings, dry land, vegetated soil, arid land and healthy vegetation as well as their respective percentages is presented in Table 1.2 & 1.3 respectively. Arid land and sand dunes are identified as physical indicators of desertification in this study. This can be associated with the decrease in the trees, shrubs and grassland communities which played major roles of intercepting or resisting the movement of sand blown by wind, the reduction of vegetation paved way for increased wind velocity in the area and consequentially movement of large amounts of sand particles as dust through increased soil erosion. The table 1.4 and 1.5 also shows the trend of change in the arid land area class and the values indicates that there was increase in the percentage of arid land between 1988 and 2018 from 9.097% to 11.339%, this leads to increased sand dunes and sand movement in the area. This can also be attributed to increase in agricultural activities in the area, in which some of the tree communities were cleared for crop cultivation as observed in the vegetated soil class in the land use landcover classification in which the vegetated soil increased from 7.586% in 1988 to 7.975% in 2018.
Between 1988 and 2018 the study area experienced decrease in the percentage of land area covered by healthy vegetation from 39.455% in 1988 to 25.732% in 2018, which shows decline in productive capacity of the soil in the area. It also shows an increase in area coverage of trees and buildings from 2.9% to 4.4%, this is due to re-growth of trees in some areas and constructions of new buildings due to urbanization during the study period. The wetland class in Table 1.2 was also shown to decrease from 1988 to 2018. The increase in the area coverage of this class in the study period was related to the amount of rainfall recorded during that period.
CLASS 1988 (Km2) 1998 (Km2) 2008 (Km2) 2018 (Km2) dry land 1407.387 1513.376 1678.204 1830.932 healthy vegetation 1528.586 1418.256 1216.378 996.937 vegetated soil 293.890 287.456 310.240 308.975 trees & buildings 113.403 103.721 115.134 169.482 wet land 178.518 153.321 134.109 128.587 arid land 352.458 398.113 420.172 439.328 3874.242 3874.243 3874.237 3874.241
ISSN 2348-1218 (print)
International Journal of Interdisciplinary Research and Innovations ISSN 2348-1226 (online) Vol. 8, Issue 2, pp: (50-58), Month: April - June 2020, Available at: www.researchpublish.com
TABLE 1.3: TREND FROM 1988 TO 2018 IN PERCENTAGE OF LANDCOVER OF EACH CLASS
CLASS 1988 (%) 1998 (%) 2008 (%) 2018 (%) dry land 36.327 39.062 43.317 47.259 healthy vegetation 39.455 36.607 31.396 25.732 vegetated soil 7.586 7.421 8.008 7.975 trees & buildings 2.927 2.677 2.972 4.375 wet land 4.608 3.957 3.462 3.32 arid land 9.097 10.276 10.845 11.339 100 100 100 100
TABLE 1.4 DIFFERENCE IN AREA COVERAGE OF CLASSES FROM 1988 TO 2018 IN KM2
Class 1988 (Km2) 2018 (Km2) Differerence (Km2)
dry land 1407.387 1830.932 423.545 healthy vegetation 1528.586 996.937 -531.649 vegetated soil 293.890 308.975 15.085 trees & buildings 113.403 169.482 56.079 wet land 178.518 128.587 -49.931 arid land 352.458 439.328 86.870 3874.242 3874.241 -0.001
TABLE 1.5: DIFFERENCE IN AREA COVERAGE OF CLASSES FROM 1988 TO 2018 IN PERCENTAGE
Class 1988 (%) 2018 (%) Difference (%)
dry land 36.327 47.259 10.932 healthy vegetation 39.455 25.732 -13.723 vegetated soil 7.586 7.975 0.389 trees & buildings 2.927 4.375 1.448 wet land 4.608 3.32 -1.288 arid land 9.097 11.339 2.242 100 100 0
The findings in this research identified decreased healthy vegetation (trees, shrubs and grasses) and increased arid land and dunes area coverage. This indicates desertification in the study area has increased, where 41.215km2 of land areas covered by healthy was lost between 1998 and 2018, while arid land areas and dune fields increased from 398.113km2 in 1988 to 439.328km2 in 2018. The spatial distribution of the land cover class also shows that the western part of the study area was mostly affected by vegetation loss compared to the eastern part, where they are mostly seen along the flood plains of river Komdugu Yobe. Variation in annual amount of rainfall received in the area in relation to other anthropogenic factors such as farming influenced the rate of desertification in the study area. Therefore, it can be concluded that desertification has increased over the time period of the study.
In order to address issues discussed through the findings of this study, the following recommendations are offered:
i. The use of higher resolution imageries for future research.
ii. There has to be a need for regular monitoring and assessment of desertification in the affected areas and to ensure that desertification control measures put in place by communities and all stakeholders.
iii. Farmers should be encouraged to practice agro-forestry on their farmlands as trees planted like Moringa, Acacia spp, and so on will help to minimize the impact of wind erosion and also serve as source of food and income for the family in the future
ISSN 2348-1218 (print) International Journal of Interdisciplinary Research and Innovations ISSN 2348-1226 (online) Vol. 8, Issue 2, pp: (50-58), Month: April - June 2020, Available at: www.researchpublish.com
iv. Grazing and farming should be Integrated where conditions are favourable, allowing for a more efficient cycling of nutrients within the agricultural systems.
v. Community-based tree planting programs should be encouraged with incentives so as to boost their morale to plant more trees thereby reducing the rate of desertification
[1] Buczak, A.L., Koshute, P.T., Babin, S.M. et al. (2012) A Data-Driven Epidemiological Prediction Method for Dengue Outbreaks Using Local and Remote Sensing Data BMC Med Inform Decis Mak 12, 124 Research article doi:10.1186/1472-6947-12-124
[2] Elijah E., Ikusemoran M., Nyanganji, K. J., Mshelisa, H. U. (2013). Detecting and Monitoring Desertification Indicators in Yobe State, Nigeria. Journal of Environmental Issues and Agriculture in Developing Countries, Volume 9, Number 1, April 2017/33, (pp. ISBN: 2141-2731).
[3] Grimm, M. R. (2001). Soil Erosion Risk in Europe. Office for Official Publications of the European CommunitiesEUR 19939 EN. Luxembourg:.
[4] Guishan C. , Woo-Kyun L. , Doo-Ahn K. , Sungho C , Taejin P & Jongyeol L. (2011). Desertification monitoring by LANDSAT TM satellite imagery. Forest Science and Technology, (pp. 7:3, 110-116, DOI: 10.1080/ 21580103.2011.594607).
[5] Gunin P. D., Dedkov V. P., Danzhalova E. V., Bazha S. N., Zolotokrylin A. N. and Kazantseva T. I. (2019), NDVI for Monitoring of the State of Steppe and Desert Ecosystems of the Gobi Arid Ecosystems. Springer Nature Switzerland AG. Volume 9, Issue 3, pp 179–186|
[6] Hill J., Mégier J., Mehl W., . (1995a). Land degradation, Soil Erosion and Desertification Monitoring.Mediterranian ecosystems remote sensing revised (pp. 107 - 130).
[7] Hoffman, T. (2002). Remote Sensing Methodologies Used for Assessment of Desertification in Southern Africa. Capetown. Symposium on desertification in South Africa.(p. 13).
[8] Hostert, P., A. Röder & J. Hill. (2004). Coupling Spectral Unmixing and Trend Analysis for Monitoring of LongTerm Vegetation Dynamics in Mediterranean Rangelands. Remote Sensing of Environment, (pp. 87,183-197).
[9] Imeson, A. C. (2005). Indicator Concepts for Desertification Policy. Combating Desertification in Mediterranean Europe Linking Science with Stakeholders, a Contract Report. (pp. Pp. 15-17.http://www.kcl.ac.uk/projects/ desertlinks).
[10] Ismat M. El Hassan (2004) International Conference on Water Resources & Arid Environment Desertification Monitoring Using Remote Sensing Technology.Civil Engineering Department, College of EngineeringKing Saud University P.O. Box 800Riyadh 11421 Kingdom of Saudi Arabia, ismat@ksu.edu.sa
[11] Jennifer, Yu. (2017). Successes and Failures of China’s Grain-For-Green Program. ARemote Sensing Analysis of Reforestation in the Ansai, Shaanxi region., (p. CEE 194).
[12] Mouat, D.A., C.A. Fox, & M.R. Rose,. (1992). Ecological Indicator Strategy for Monitoring Aridecosystems.Proceedings of an International Symposiumin: McKencie, D.H., D.E. Hyatt, & V.J. McDonald, Florida, USA
[13] Morgan Ernest S. K., Glenda M. Yenni, Ginger Allington, Erica M. Christensen Keith Geluso, Jacob R. Goheen, Michelle R. Schutzenhofer, Sarah R. Supp and Katherine M. Thibault (2016), Long‐term Monitoring and Experimental Manipulation of a Chihuahuan Desert Ecosystem Near Portal, Arizona (1977–2013) Journal Storage: Ecology Bulletin Volume 97, Issue 4 No. 24. https://doi.org/10.1890/15-2115.1
[14] Musa, H. D. and Shaib, B. (2010). Integrated Remote Sensing Approach to Desertification Monitoring in the CropRangeland Area of Yobe State, Nigeria. Journal of sustainable development in Africa., (pp. Volume 12, No.5. Pp. 236-249).
ISSN 2348-1218 (print) International Journal of Interdisciplinary Research and Innovations ISSN 2348-1226 (online) Vol. 8, Issue 2, pp: (50-58), Month: April - June 2020, Available at: www.researchpublish.com
[15] Natalie Thomas, Sumant Nigam. (2018) Twentieth-Century Climate Change over Africa: Seasonal Hydroclimate Trends and Sahara Desert Expansion Journal of Climate, 2018; 31 (9): 3349 DOI: 10.1175/JCLI-D-17-0187.1 University of Maryland
[16] National Aeronautics and Space Administration, Science Mission Directorate. (2016). Reflected Near-Infrared Waves. Science website: http://science.nasa.gov/ems/08_nearinfraredwaves
[17] Ndiaye, O.; Ward, M. N.; Siebert, A. B. (2011) The Sahel Region of West Africa: Examples of Climate Analyses Motivated By Drought Management Needs, American Geophysical Union, Fall Meeting 2011, abstract id. GC33C07
[18] PanelX. Querol, Tobías A., Pérez N., Karanasiou A., Amato F., Stafoggia M., Pérez García-Pando C., Ginoux P., Forastiere F., Gumy S., Mudu P. and Alastuey A. (2019) Monitoring the Impact of Desert Dust Outbreaks for Air Quality for Health Studies. Environment International science direct, Volume 130, Published by Elsevier Ltd Environ Int. doi: 10.1016/j.envint.2019.05.061.
[19] Rapp A. (2019) Needs of Environmental Monitoring for Desert Encroachment Control Ecological Bulletins No. 24, Can Desert Encroachment Be Stopped? (1976), pp. 231-236 Published by: Oikos Editorial Office https://www jstor.org/stable/20112555
[20] Sen Li, Changzhen Yan, Tao Wang, He-qiang Du (2019) Monitoring Grassland Reclamation in the Mu Us Desert Using Remote Sensing from 2010 to 2015 Journal of Environmental Earth Sciences Volume 78 Issue 10 SpringerVerlag GmbH Germany https://doi.org/10.1007/s12665-019-8317-x DOI: 10.1007/s12665-019-8317-x
[21] Signorelli, Sara, Azzarri, Carlo, Roberts, Cleo (2016) Technical Report series No. 2 Strengthening the Evidence Base for Resilience in the Horn of Africa ( Report number 9, Affiliation: Malnutrition and Climate Patterns in the ASALs of Kenya: A Resilience Analysis based on a Pseudopanel Dataset ) DOI: 10.13140/RG.2.1.1297.3203