ISSN 2348-313X (Print)
International Journal of Life Sciences Research ISSN 2348-3148 (online) Vol. 8, Issue 2, pp: (74-83), Month: April - June 2020, Available at: www.researchpublish.com

ISSN 2348-313X (Print)
International Journal of Life Sciences Research ISSN 2348-3148 (online) Vol. 8, Issue 2, pp: (74-83), Month: April - June 2020, Available at: www.researchpublish.com
Salihu Mohammed a*, Mohammed Ahmeda
a) Department of Physical Sciences, Niger State Polytechnic, Zungeru, Nigeria
Corresponding Author’s Email: salmedangle@yahoo.co.uk
Abstract: In the present work, a total of ninety seven (97) randomly selected residential buildings across sixteen (16) linked villages of Rijau city were investigated. Solid track detectors; CR-37 were each exposed for a period of twelve (12) months after which they were etched and analyzed to determine their respective track densities. The detectors were etched in a 6.25 M solution of NaOH at 90 oC for 3 hours. The concentrations were used to compute exposures to dwellers and other radiological parameters per dwelling. Result of the survey yielded least, average and peak radon concentrations of 158.00±28.38 at Gyalle Area, 125.61±24.10 and 87.67±16.26 Bqm-3 at Low-cost Area respectively. This translated to least, average and peak Annual Effective Dose of 2.66, 3.13 and 3.99 mSvy-1 respectively When compared with the standards set by International Centre for Ionizing Radiation (ICRP), both the measured Concentration and consequent Annual Effective Dose were within safe limit. The result from this work shall serve as a baseline radon data in the study area.
Keywords: Radon gas, CR-37, Annual Effective Dose, Rijau.
Radon gas is significantly influenced by geological bed rock, topography, house construction type, soil Radium content, soil density, radioactivity of building materials, ventilation conditions, meteorological conditions and human activities (Ursulean, 2013, Fahiminia et al., 2016) which differs from place to place. More than two third of the approximately 200,000 population of Rijau dwellers are predominantly farmers living in the interior villages. The houses they dwell in are mostly the local hut type usually built with red mud. In addition to poor ventilation, the huts are almost always without flooring of any form other than the same mud compressed locally in a process traditionally referred to as dabe The dabe flooring which is a condensed soil-on-soil flooring system renders the dwellers potentially exposed to Rn-222 gas due to infiltration arising from geological bed rock and soil radium (Ra-226) content.
Measurement is the only means of ascertaining the radiological exposure risk posed to dwellers by Radon gas and other Natural Occurring radioactive Materials (NORMS) for a given residential building or area. Indoor Radon exposure is responsible for approximately 60% of the total natural background radiation. Surveys to directly measure radon concentration in a significant and representative sample of dwellings are generally used to estimate the distribution of indoor radon concentration.
According to the United States Environmental Protection Agency (USEPA), radon is the second most frequent cause of lung cancer, after cigarette smoking, accounting for some 21,000 lung cancer deaths per year in the United States (USEPA; UNSCEAR, 2000; Shoeib and Thabayneh, 2014).
ISSN 2348-313X (Print)
International Journal of Life Sciences Research ISSN 2348-3148 (online) Vol. 8, Issue 2, pp: (74-83), Month: April - June 2020, Available at: www.researchpublish.com
Radon is a chemical element with symbol Rn and atomic number 86. It is radioactive, colorless, odorless, tasteless occurring naturally as a result of the decay of Radium 226. Its most stable isotope is Ra-222 which has a half-life of 3.8 days and disintegrates by emission of alpha particle of energy 5.5 MeV. Rn-222 decays directly into Polonium–218 which following a chain of β− and α decays is transformed into Polonium–214 (Farid, 2016).
Rijau is a Local Government Area in Niger State, Nigeria. It has an area of 3,196 km² and a population of 176,053 according to 2006 National Census. The GPS coordinates of Rijau is: 11.10621˚N 5.26352˚E (weather-forecast.com). In accordance with the sampling method established by Mahmood et al. (2016), a total of ninety seven (97) randomly selected residential buildings across sixteen (16) linked Areas of Rijau city were investigated; Warari, Shambo, Jamaare, Vocational, Low Cost, Tungan Anini, Ratayagiwa, Rijau Town, Danrimi, Sabon Gari, Magajiya Metropolis, Tsohon-gari, Marke, Alamberu, Gidan-dogo, Unguwan Gyalle and Tungan Bunu in Rijau LGA for the present survey. The distribution of the sampling sites encompassed settlements depicted in Figure 2.1
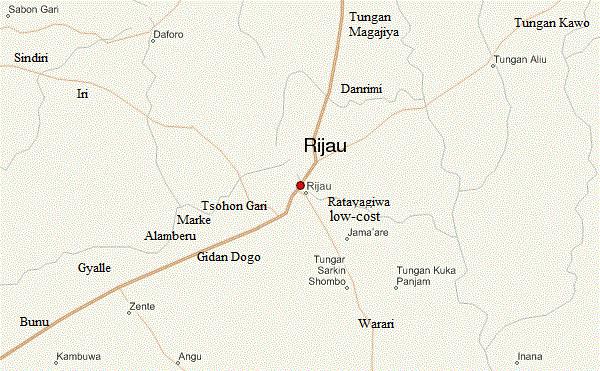
Figure 2.1: Google map for sampling area (weather-forecast.com)
The selection criteria included geological feature and building type. The research only considered buildings and dwellings of traditional hut type which are usually built without cemented floor and sufficient ventilation. The measurement was carried out over a period of twelve consecutive (12) months spanning September, 2018 - August, 2019
To achieve the goals of the research, dwellings of interest were identified and marked with the cooperation of traditional leaders and literate volunteers among the indigenous people who aided in educating the stakeholders on the purpose of the research after which agreement to place the detectors in the dwellings of interest was granted In order to obtain results representative of dwellers’ exposure, radon detectors were placed in inhabited rooms only.
A number of reviews on Indoor Radon concentration trends from reviewed literatures are presented in Table 3.1
Table 3.1: Trends of Indoor Radon Concentration
Place No. of Houses Rn 222 (Bqm-3) DT (mSvy-1) Reference
Dar es salam 32 166±12 - Mlay and Makundi, 2018 Iran 24 55.19 1.9 Hassan et al., 2019
ISSN 2348-313X (Print)
International Journal of Life Sciences Research ISSN 2348-3148 (online) Vol. 8, Issue 2, pp: (74-83), Month: April - June 2020, Available at: www.researchpublish.com
Jordan - 26.28 - Abu-Haija et al., 2010. Nigeria - 176.15±21.15 1.114±0.134 Obed et al., 2018
Iraq - 59.93 1.43 Battawy et al., 2013
Iran 123 95.83 - Fahiminia et al., 2016
Rijau 125.61 3.17 Present work
Iran - 0.47 Mirdoraghi et al., 2018
Iran 50 117.4 ±97.7 1.4 Sherafat et al., 2019 Nigeria 91.62±5.9 0.87 Okeji and Agwu, 2012 Nigeria 293.3±79.6 1.85 Obed et al., 2010
Nigeria 77 259±67 6.5 Obed et al., 2011 Nigeria 30 448.98 - Yusuf and Adamu, 2014
Results of the preliminary measurements in Table 3.1 indicated a trend of interest. This begs the need for measurements in the area under review.
The survey will enable the scientific community to determine mean concentration in places of interest, determine the annual effective and absorbed doses due to inhalation of radon. This will help to established baseline survey data on Radon concentration and distribution in places of interest thereby alerting both policy makers and public on radon exposure prone areas.
Measurement of the indoor radon concentration measurements was achieved using CR-39 solid track detector. The CR-39 detector is made up of a cylindrical plastic, the plastic cover and a one square centimeter CR-39 strip. The detectors were placed at a height of at least 1 m from the floor of the dwelling during a twelve (12) months exposure. In order to ensure that the maximum Ra-222 concentration was obtained, drought–free areas of the marked dwellings were selected for detector placement. As Rn-222 decays, the emitted alpha particles interact with the CR-39 strip and leave behind tracks that would be revealed by etching with aqueous alkaline solutions of sodium hydroxide (NaOH). The etching of the exposed detectors was conducted using a 6.25 M solution of NaOH heated at a fixed temperature of 90 oC for a period 3 hours. Based on track effect, the solution of NaOH etches the surface of the CR-39 strip, but with a faster rate in the region of the tracks which made it possible to see the ‘‘track’’ of the particle under an optical microscope. After the etching, the etched detectors were placed under an optical microscope of 100× magnification were the visible tracks were counted and used to determine the track density using equation 4.1.
( )
Finally the computed track densities were converted using calibrated standards to determine the required concentration of Rn-222 for each location investigated Table 4.1 gives the summary of the location description and measured activity.
Table 4.1: Location Description and Measured Activity
House Code Location Latitude, Longitude CRn (Bqm-3) Min.,Max. CRn (Bqm-3) Annual Average Warari
Areas
H1 10.92102˚N 5.31895˚E 67,145 99 H2 10.92091˚N 5.31912˚E 81,148 113 H3 10.92076˚N 5.31903˚E 78,189 144 Mean 118.67
Shambo
H4 11.01437˚N 5.29593˚E 78,155 117 H5 11.01449˚N 5.29593˚E 56,145 108 H6 11.01464˚N 5.29586˚E 55,108 89 H7 11.01596˚N 5.29427˚E 88,134 109
ISSN 2348-313X (Print)
International Journal of Life Sciences Research ISSN 2348-3148 (online) Vol. 8, Issue 2, pp: (74-83), Month: April - June 2020, Available at: www.researchpublish.com
H8 11.01618˚N 5.29505˚E 78,111 98 H9 11.01596˚N 5.29507˚E 77,156 105
Mean 104.33
Jama'are H10 11.04915˚N 5.28138˚E 103,211 154 H11 11.04930˚N 5.28128˚E 87,132 109 H12 11.04924˚N 5.28114˚E 56,102 67 H13 11.07000˚N 5.27107˚E 77,156 123 H14 11.06950˚N 5.27141˚E 99,149 125
Mean 115.60
Low Cost H15 11.08270˚N 5.26521˚E 49,132 77 H16 11.08298˚N 5.26511˚E 89,177 108 H17 11.08313˚N 5.26517˚E 67,156 84
Mean 89.67
Tungan Anini H18 11.08915˚N 5.26482˚E 56,143 112 H19 11.08930˚N 5.26468˚E 56,201 115 H20 11.08954˚N 5.26475˚E 67,133 81
Mean 102.67
Rataya Giwa H21 11.09839˚N 5.26428˚E 67,205 123 H22 11.09852˚N 5.26406˚E 56,123 82 H23 11.09852˚N 5.26408˚E 95,212 125
Mean 110.00
Rijau H24 11.10337˚N 5.26412˚E 97,234 119 H25 11.10329˚N 5.26436˚E 98,123 106 H26 11.10337˚N 5.26389˚E 87,183 123 H27 11.10573˚N 5.26355˚E 87,234 145 H28 11.10602˚N 5.26361˚E 89,235 136 H29 11.10621˚N 5.26352˚E 87,286 234 H30 11.11646˚N 5.26309˚E 56,102 84 H31 11.11639˚N 5.26287˚E 62,187 156 H32 11.11679˚N 5.26288˚E 98,167 135 H33 11.10825˚N 5.26306˚E 56,145 109 H34 11.10802˚N 5.26338˚E 87,246 117 H35 11.10825˚N 5.26344˚E 98,146 128
Mean 132.67
Danrimi
H36 11.12501˚N 5.26273˚E 86,168 146 H37 11.12560˚N 5.26265˚E 125,197 167 H38 11.12617˚N 5.26241˚E 122,167 117 H39 11.13908˚N 5.26280˚E 118,189 156 H40 11.13858˚N 5.26265˚E 123,189 176 H41 11.13786˚N 5.26257˚E 99,167 133
Mean 149.17
ISSN 2348-313X (Print)
International Journal of Life Sciences Research ISSN 2348-3148 (online) Vol. 8, Issue 2, pp: (74-83), Month: April - June 2020, Available at: www.researchpublish.com
Sabon Gari
H42 11.20518˚N 5.14473˚E 100,156 123 H43 11.20583˚N 5.15343˚E 97,177 146 H44 11.20577˚N 5.15126˚E 67,166 112
Mean H45 11.20557˚N 5.14957˚E 67,145 118 124.75
Magajiya
H46 11.15915˚N 5.27199˚E 78,156 127 H47 11.16136˚N 5.27323˚E 78,158 126 H48 11.15999˚N 5.27248˚E 78,156 118
H49 11.16817˚N 5.27595˚E 123,190 178 H50 11.16824˚N 5.27563˚E 89,156 119 H51 11.16903˚N 5.27575˚E 97,187 145 H52 11.17428˚N 5.27692˚E 67,156 106 H53 11.17408˚N 5.27688˚E 87,154 129 H54 11.17389˚N 5.27679˚E 98,188 167 H55 11.17994˚N 5.27798˚E 67,133 104 H57 11.17995˚N 5.27746˚E 111,201 134 H57 11.18001˚N 5.27682˚E 122,187 156
Mean 134.08
Tsohon Gari
H58 11.10282˚N 5.25572˚E 79,167 137 H59 11.10252˚N 5.25608˚E 111,186 134 H60 11.10235˚N 5.25589˚E 99,189 136 H61 11.10233˚N 5.25559˚E 87,156 124 H62 11.09930˚N 5.25397˚E 85,178 143 H63 11.09926˚N 5.25226˚E 56,134 95 H64 11.09939˚N 5.25443˚E 78,167 121
Mean 127.14
Marke
H65 11.05727˚N 5.18055˚E 112,178 145 H66 11.05703˚N 5.18084˚E 79,167 135 H67 11.05703˚N 5.18006˚E 133,206 186 H68 11.05730˚N 5.18027˚E 56,133 99 H69 11.05742˚N 5.17992˚E 90,185 165 H70 11.05712˚N 5.17957˚E 88,177 145 H71 11.05592˚N 5.17810˚E 67,122 94 H72 11.05569˚N 5.17832˚E 54,143 81 H73 11.05565˚N 5.17806˚E 76,166 143
Mean 132.56
Alamberu
H74 11.21608˚N 5.16342˚E 99,198 156 H75 11.21189˚N 5.16393˚E 88,144 113 H76 11.20710˚N 5.16558˚E 78,133 123
Mean 130.67
Gidan Dogo
H77 11. 04083˚N 5.13299˚E 141,202 187
ISSN 2348-313X (Print)
International Journal of Life Sciences Research ISSN 2348-3148 (online) Vol. 8, Issue 2, pp: (74-83), Month: April - June 2020, Available at: www.researchpublish.com
H78 11.04098˚N 5.13286˚E 56,144 117 H79 11.04090˚N 5.13265˚E 77,174 126
Mean 143.33
Gyalle
H80 11.00236˚N 5.10743˚E 82,237 196 H81 11.00218˚N 5.10759˚E 108,213 155 H82 11.00195˚N 5.10744˚E 90,187 143 H83 11.00250˚N 5.10717˚E 122,231 188 H84 11.00279˚N 5.10726˚E 97,172 143 H85 11.00313˚N 5.10704˚E 88,177 123
Mean 158.00
Bunu
H86 10.98698˚N 5.09158˚E 89,145 143 H87 10.98669˚N 5.09152˚E 57,234 151 H88 10.98651˚N 5.09127˚E 113,223 175 H89 10. 98338˚N 5.08924˚E 123,221 144 H90 10.98357˚N 5.08892˚E 96,154 122 H91 10.98308˚N 5.08882˚E 78,144 109 H92 10.97864˚N 5.08603˚E 133,233 175 H93 10.97883˚N 5.08590˚E 56,154 101 H94 10.97854˚N 5.08584˚E 67,155 132 H95 10.97165˚N 5.08024˚E 78,149 123 H96 10.97146˚N 5.07990˚E 77,147 108 H97 10.97181˚N 5.07954˚E 88,186 155
Mean 136.50
Place No. of Houses SD (Ambient Gamma) CRn (Bqm-3) SD
Warari 3 0.014142 118.67 23.03 Shambo 6 0.010435 104.33 9.71
Jama'are 5 0.001 115.60 31.71
Low Cost 3 0.002357 89.67 16.26
Tungan Anini 3 0.016499 102.67 18.82 Rataya Giwa 3 0.004714 110.00 24.27
Rijau 12 0.005025 132.67 37.13 Danrimi 6 0.004472 149.17 21.87 Sabon Gari 4 0.001443 124.75 14.86 Magajiya 12 0.003015 134.08 23.22
Tsohon Gari 7 0.006999 127.14 16.10
Marke 9 0.006285 132.56 34.65
Alamberu 3 0.004714 130.67 22.50
Gidan Dogo 3 0.002357 143.33 38.08 Gyalle 6 0.001491 158.00 28.38 Bunu 12 0.005276 136.50 24.97 Mean 0.005639 125.61 24.10
ISSN 2348-313X (Print)
International Journal of Life Sciences Research ISSN 2348-3148 (online) Vol. 8, Issue 2, pp: (74-83), Month: April - June 2020, Available at: www.researchpublish.com
The magnitudes the Annual Effective Dose (DT) (mSvy-1) and Annual Effective Dose to lungs (ET) (mSvy-1) are given by equations 4.2 and 4.3 respectively.
CRn= Radon Concentration (Bqm-3)
D=Dose Conversion Factor (9.0×10⁻⁶ mSvh-1 per Bqm-3)
F=equilibrium factor (0.4)
T=hours in a year (8760 h/yr)
H= Indoor Occupancy Factor (0.4)
The Annual Effective Dose (E) to lungs is the measure of energy deposited in the human lungs by ionizing radiation arising from the emitted Alfa particle.
Annual Effective Dose to lungs (ET) (mSvy-1)
D= Annual Effective Dose to lungs (mSvy-1)
WR=radiation weighing factor for Alfa particles (20)
WT=tissue weighing factor for lungs (0.12) (Bodansky et al., 1989)
The standard deviations were computed using equation 4.4 √ ( )
Where; N is the population size xi is each value from the population µis the population mean
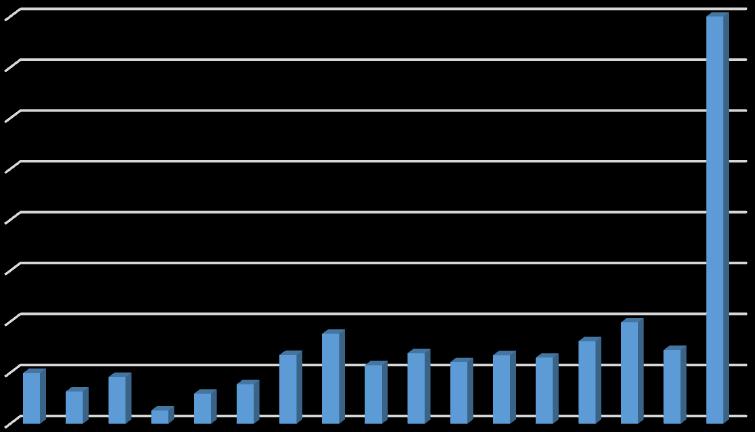
The highest and least radon concentrations were recorded in Gyalle and Low cost Areas with 158.00 and 89.67 Bqm-3 respectively. As depicted in Figure 5.1, 100% of the areas yielded Rn-222 concentrations less than the ICRP limit of 148 Bqm-3. Additionally, 87.5% of the measurements conducted fell below the 148 limit set by EPA. This also falls below the average measured concentration of the reviewed measurements of 159.61 Bqm-3 presented in Table 3.1.
Although overall, the highest recorded mean concentration in the present work is greater than both the world average and the limit of 100 Bqm-3 set by WHO, it is only a mere 33% of the 448.98 mean concentration published by Musa and Adamu (2014) in a research area which according to distancefromto.net is only 211 km away from Rijau.
ISSN 2348-313X (Print)
International Journal of Life Sciences Research ISSN 2348-3148 (online) Vol. 8, Issue 2, pp: (74-83), Month: April - June 2020, Available at: www.researchpublish.com
Rn222 (Bqm3 )
330.00
280.00
230.00
180.00
130.00
80.00
Warari Shambo Jama'are Low Cost Tungan Anini Rataya Giwa Rijau Danrimi Sabon Gari Magajiya Tsohon Gari Marke Alamberu Gidan Dogo Gyalle Bunu ICRP ESPA WHO
Figure 5.1: Plot of Radon Concentration (Bqm-3) against Area
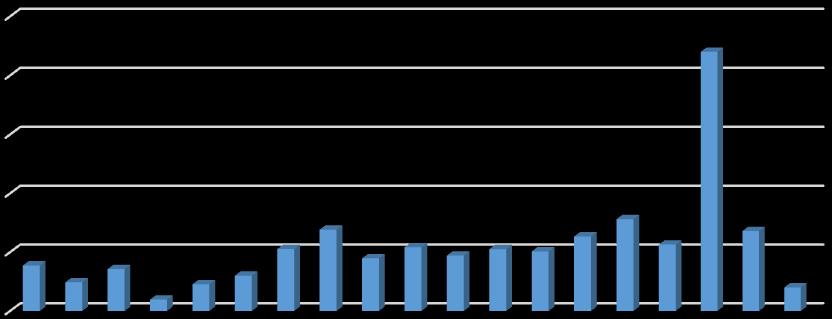
The trend of the mean of the computed DT (mSvy-1) for the present study is presented in Figure 5.2.1.
Annual Effective Dose (mSvy1)
10.00
9.00
8.00
7.00
6.00
5.00
4.00
3.00
Location 2.00
Warari Shambo Jama'are Low Cost Tungan Anini Rataya Giwa Rijau Danrimi Sabon Gari Magajiya Tsohon Gari Marke Alamberu Gidan Dogo Gyalle Bunu ICRP
Location
Figure 5.2.1:
As presented in Figure 5.2.1, mean values of 3.99 mSvy-1 and 2.66 mSvy-1 were obtained for Gyalle and Low-cost Areas respectively as the highest and lowest values of computed Annual Effective Dose (DT). However, in the entire study, values of computed DT were below the limit set by ICRP of 10 mSvy-1 .
An overview on radiological risks from exposure to radon gas accumulation is presented. Solid State Nuclear Track Detectors as well as underlying physics of track effect are discussed. Results of mean radon concentration and associated radiological hazards were presented The observed trend of radon distribution in Rijau when compared with ICRP limits indicated that dwellers are not at risk of exposure to ionizing radiation due to radon
ISSN 2348-313X (Print)
International Journal of Life Sciences Research ISSN 2348-3148 (online) Vol. 8, Issue 2, pp: (74-83), Month: April - June 2020, Available at: www.researchpublish.com
a) A country with age long rampant cases of lung cancer among its population need to conducted holistic radon survey in order to establish reliable data on the distribution of radon across the country. This Radon map when placed side by side with map-based prevalence of Lung Cancer may provide some correlation between prevalence of lung cancer and radon gas distribution.
b) There is need for policy makers in Nigeria to promulgate regulations to compel housing developers to conduct radon survey in proposed residential sites in order to ascertain the level of background radon radiation and where it is observed to be within an unsafe range, necessary measures should be put in place by the stakeholders to ensure safety of occupants.
c) There is need for the scientific community to embark on sensitization of the public on the need to conduct quick assessment of radon concentration in their homes and offices, ensure proper ventilation and also insist on thick Germanflooring during construction of houses.
This work is sponsored by Tertiary Education Trust Fund (TETFund) via Institutional Based Research Intervention (2018) to Niger State Polytechnic Zungeru. The contributions of Physics/Electronics class of 2019, Abey Joshua of Graduate School of Nuclear and Allied Sciences, University of Ghana and that of Emmanuel Paul of Dana Pharmaceuticals Limited, Minna, Nigeria are hereby acknowledged.
[1] Mlay, G. M., & Makundi, I. N. (2018). Assessment of indoor radon-222 concentrations in the vicinity of Manyoni uranium deposit, Singida. Tanzania Journal of Science, 44(1), 191-206.
[2] Yusuf A. M., & Adamu N. B. (2014). Estimation of the Level of Indoor Radon in Sokoto Metropolis. Advance Physics Letters, 1(2), 2349-1108.
[3] Hassanvand, H., Birjandi, M., Amiri, A., Hassanvand, M. S., & Kamarehie, B. (2019). Investigation of indoor radon concentration in dwellings of Aleshtar (western part of Iran) and estimation of the annual effective dose from exposure to radon. International Journal of Radiation Research, 17(4), 659-666.
[4] Abu-Haija, O., Salameh, B., Ajlouni, A. W., Abdelsalam, M., & Al-Ebaisat, H. (2010). Measurement of radon concentration inside houses in Tafila Province, Jordan. International Journal of Physical Sciences, 5(6), 696-699.
[5] Obed, R. I., Oyelade, E. A., & Lateef, H. T. (2018). Indoor radon levels in some selected nursery and primary schools in Ibadan, Oyo State, Nigeria. Journal of radiation research and applied sciences, 11(4), 379-382.
[6] Battawy, A. A., Jaafar, M. S., Tawfiq, N. F., Mustafa, I. S., Ali, A. H., & Hussein, Z. A. (2013). Indoor radon concentration measurement in selected factories in northern and central Iraq. Measurement, 4, 5.
[7] Fahiminia, M., Fard, R. F., Ardani, R., Naddafi, K., Hassanvand, M. S., & Mohammadbeigi, A. (2016). Indoor radon measurements in residential dwellings in Qom, Iran. International journal of radiation research, 14(4), 331.
[8] ICRP (2010), Lung Cancer Risk from Radon and Progeny and Statement on Radon, (International Commission on Radiological Protection) ICRP Pub. pp. 115.
[9] Mirdoraghi, M., Masoumi, S., & Einor, D. (2018). Data on assessment excess lifetime cancer risk and risk of lung cancer from inhalation of Radon 222 in radiotherapy centers in Tehran, Iran. Data in brief, 20, 1367-1370.
[10] Sherafat, S., Mansour, S. N., Mosaferi, M., Aminisani, N., Yousefi, Z., & Maleki, S. (2019). First indoor radon mapping and assessment excess lifetime cancer risk in Iran. MethodsX, 6, 2205-2216.
[11] Okeji, M. C., & Agwu, K. K. (2012). Assessment of indoor radon concentration in phosphate fertilizer warehouses in Nigeria. Radiation Physics and Chemistry, 81(3), 253-255.
[12] Obed, R. I., Lateef, H. T., & Ademola, A. K. (2010). Indoor radon survey in a university campus of Nigeria. Journal of Medical Physics/Association of Medical Physicists of India, 35(4), 242.
ISSN 2348-313X (Print) International Journal of Life Sciences Research ISSN 2348-3148 (online) Vol. 8, Issue 2, pp: (74-83), Month: April - June 2020, Available at: www.researchpublish.com
[13] Obed, R. I., Ademola, A. K., Vascotto, M., & Giannini, G. (2011). Radon measurements by nuclear track detectors in secondary schools in Oke-Ogun region, Nigeria. Journal of environmental radioactivity, 102(11), 1012-1017.
[14] Bodansky D., Maurice A. R. and David R. S. (1989). Indoor Radon and its Hazards. University of Washington Press Seattle and London, Second Edition
[15] Dubois G. (2005). An overview of radon surveys in Europe, EUR 21892 EN, E.C 1–168.
[16] Farid S. M. (2016). Indoor radon in dwellings of Jeddah city, Saudi Arabia and its Correlations with the radium and radon exhalation rates from soil. Indoor and Built Environment. 25(1) Pp. 269–278
[17] Fahiminia1 M., Fouladi R. Fard1, Ardani1 R., Naddafi K. , Hassanvand M.S., Mohammadbeigi A. (2016) Indoor radon measurements in residential dwellings in Qom, Iran. International Journal of radiation Research. 14 (4). Pp. 331-339.
[18] Hesham A. Y., Gehad M. S., El-Farrash A.H., Hamza A. (2016). Radon exhalation rate for phosphate rocks samples Using alpha track detectors. Journal of Radiation Research and Applied Sciences (9) Pp. 41- 46.
[19] SON (2007). Nigerian Standard for Drinking Water. Standard Organization of Nigeria. NIS 554
[20] Shoeib M.Y., Thabayneh K.M. (2014). Assessment of Natural Radiation Exposure and Radon Exhalation Rate in Various Samples of Egyptian Building Materials. Journal of Radiation Research and Applied Sciences (7) Pp. 1 7 4 -1 8 1
[21] US EPA- Citizen’s Guide to Radon (2010). Epa.gov. Retrieved 2012-04-28
[22] Ursulean E I., Coreţchi L., Chiruţă I., Vîrlan S. (2013). Estimation of Indoor Radon Concentrations in the Air of Residential Houses and Mines in the Republic of Moldova, Rom. Journ. Phys., Vol. 58, Supplement, P. S291–S297, Bucharest
[23] United Nations Scientific Committee on the Effects of Atomic Radiation, Sources and effects of ionizing radiationUNSCEAR (2000) Report to the General Assembly, with annexes. New York
[24] World Health Organization -WHO (2009). Handbook on Indoor Radon: A Public Health Perspective, WHO, Geneva.
[25] Mahmood S. K., Hasan H. D., Ali N. M. (2016). Assessment of Indoor Radon Concentrations in Dwellings for Baghdad Governorate by Using RAD-7 Detector. Detection (4) Pp. 40-44
[26] Post Offices- with map of LGA-NIPOST. Retrieved 2009-10-20. http://www.weather-forcast.com/locations/rijau.