ISSN 2348-1218 (print)
International Journal of Interdisciplinary Research and Innovations ISSN 2348-1226 (online) Vol. 8, Issue 3, pp: (6-14), Month: July - September 2020, Available at: www.researchpublish.com

ISSN 2348-1218 (print)
International Journal of Interdisciplinary Research and Innovations ISSN 2348-1226 (online) Vol. 8, Issue 3, pp: (6-14), Month: July - September 2020, Available at: www.researchpublish.com
Zmarai Niazi1, Malik Khan Ayar2
1,2Lecturer of Environmental Science Department Faculty of Natural Science Shaheed Professor Burhanuddin Rabbani Education University, Kabul, Afghanistan zmarainiazi11@gmail.com, malikkhanayar@gmail.com
Abstract: The lakes and reservoirs, all over India without exception, are in environmental degradation, might be due to encroachments, eutrophication (from domestic and industrial effluents) and silt. There has been a quantum jump in population during the last century without corresponding expansion of civic facilities resulting in lakes and reservoirs, especially the urban ones, becoming sinks for contaminants. The large density of human population in metropolitan cities like Bangalore, affects the environmental conditions of the city. The wetlands in Bangalore city are now dying, the effect of urbanization has taken some heavy toll on the lakes of Bangalore. and as result, in the heart of the city only 17 good lakes exist as against of 51 healthy lakes in 1985. The remaining lakes of the Bangalore city are facing extinction due to pollution. One such highly polluted lake is ‘Bellandur Lake’. It is located at latitude of 12°58’ N and longitude of 77°35’ E at an elevation of 921 m above the sea level. about 20 km towards the south-east of Bangalore city. A comparative study/work carried out between two years (2013 and 2017) analyzed data with reference to water quality status of Bellandur Lake as per recent years’ research papers and analyzed data to generate sufficient comparison. The result showed that the Lake is Polluted and as per CPCB water Quality classification Bellandur Lake comes in class E category and water used for Irrigation, Industrial cooling and Controlled Waste disposal.
Keywords: Bellandur Lake, Water Quality, Physico-chemical Parameters, Comparison of Lakes.
Bangalore district is situated in the heart of the South- Deccan plateau of peninsular India to the South-Eastern corner of Karnataka State of India. between the latitudinal parallels of 12°39'N and 13°18'N and longitudinal meridians of 77°22'E and 77°52'E at an average elevation of about 920 m covering an area of land about 2,174 km2 (Bangalore rural and urban districts) (Ravikumar, et al., 2013). Its population is over 13 million and making it a megacity and the third most popular city and fifth populous urban in India. According to recent survey, conducted by the global HR consultancy Mercer, Bangalore was voted the most livable city in India, beating Mumbai, Chennai, New Delhi and Kolkata. In terms of cleanliness, Bangalore ranks 12th in India.
In the 16th century, Kempe Gowda, constructed many lakes meet the town's water requirements, there is no perennial source of water supply to Bangalore city. In the half of 20th century, the Nandi Hills water works was commissioned by Sir Mirza Ismail (Diwan of Mysore, 1926–41 to provide a water supply to the city). Currently, the River Kaveri provides around 80% of the total water supply to the city with the remaining 20% being obtained from the Thippagondanahalli and Hesaraghatta reservoirs of the Arkavathi River. Bangalore receives 800 million liters of water a day, more than any other Indian city. (Rajshekhar Rao, et al., 2009, Chandrashekar, et al., 2012, and Fathima and Rajesh Gopinath 2012).
Climate of Bangalore varies, Winter temperature is 12 °C and summer temperature exceed 34–35 °C. Bangalore receives rainfall from both the northeast and the southwest monsoons and the wettest months are August, September and October. The mean value of rainfall is about 973 mm (Ramesh and Krishnaiah, 2013).
ISSN 2348-1218 (print)
International Journal of Interdisciplinary Research and Innovations ISSN 2348-1226 (online) Vol. 8, Issue 3, pp: (6-14), Month: July - September 2020, Available at: www.researchpublish.com
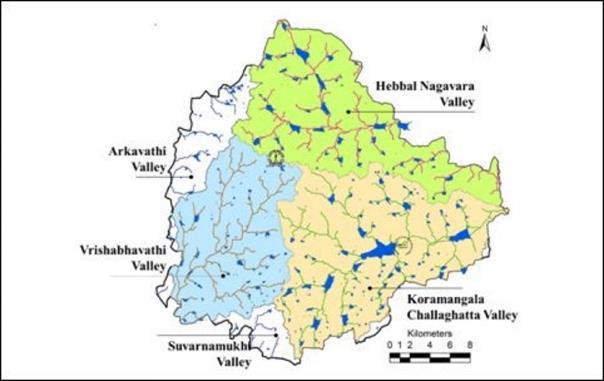
Lakes in Bangalore are numerous, and there are no rivers close by. Most of the lakes in the Bangalore were constructed in sixteenth century by building the natural dam valley systems by constructing bunds (Figure1). They met the drinking water, irrigation and fishing of the community and have a positive impact on the ecology and microclimate of the city. These water bodies help in replenishing the groundwater resources in the vicinity and prevented flooding, treated wastewater, arrested sediment loads and functioned as a productive ecosystem. (Ramachandra, et al., 2016). The wetlands in the city are now dying slowly by rapid growth and urbanization resulting in encroachment and discharge of sewage and industrial effluents. The effect of urbanization has taken some heavy toll on the lakes of Bangalore. The lakes in the city have been largely encroached for urban infrastructure and as result, in the heart of the city only 17 lakes remain as against of 51 healthy lakes in 1985 (Bhateria Rachna and Disha Jain., 2016) Urban development has caused 19 lakes getting converted to bus stands, Golf courses, playgrounds and residential colonies, and few tanks were breached under the malaria eradication programme.
As per recent study on lakes titled ' Wetlands: Treasures of Bangalore (Abused, Polluted, Encroached and Vanishing) ' by Ramachandra T V and others in 2016 a survey of 105 lakes in the Bangalore city. It found that only four seemed to be in a good condition while 25 lakes were in a very bad state fully covered with macrophytes or dumped with solid or liquid wastes and with little or no water. The physical and chemical characteristics of 80 lakes from different 3 valleys such as Vrushabahavthi, Koramanagala-Challaghatta and Hebbal were monitored during all seasons for a period of 2 years.
The study could find that:
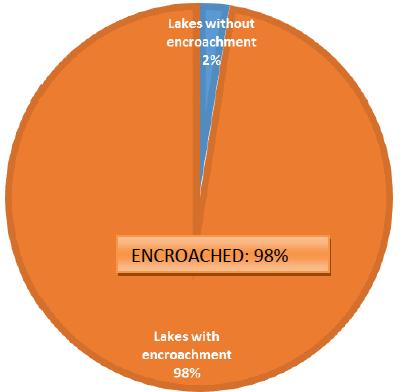
98% of the lakes were encroached.
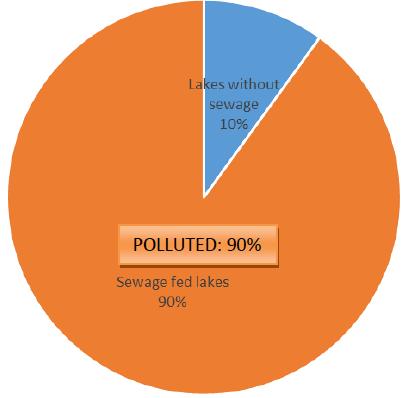
90% of the lakes converted as sewage due to flow of untreated sewage, industrial effluents, and dumping of solid wastes and building wastes.
Water quality analysis of 80 lakes, showed that about half of the lakes were highly polluted.
There was no lake water fit for drinking. according to the standards of Central Pollution Control Board (CPCB).
79% of lakes was under Class E category classified by CPCB; suitable for irrigation, industrial cooling or controlled waste disposal.
29% of lakes classified under Class E and D suitable for fish culture and wildlife propagation.
Only one lake Mylasandra 1 and 2, fell under Class A suitable for drinking purposes according to the CPCB classification.
Competitively The lakes in the Koramanagala-Challaghatta valleys were more polluted than those in the Hebbal and Vrushabahavthi valley.
Fish deaths were reported in Sankey, Lalbaugh, Jakkur and Munnekolala lakes.
ISSN 2348-1218 (print)
International Journal of Interdisciplinary Research and Innovations ISSN 2348-1226 (online) Vol. 8, Issue 3, pp: (6-14), Month: July - September 2020, Available at: www.researchpublish.com
Foam formation was seen in lakes in Rampura, Bellandur, Sarakki and Varthur.
Fire was reported in Bellandur lake.
The report depicts the main reasons for this situation in lakes are: sense of belonging among all the stakeholders, sincerity and poor decision making, Governance and poor implementation of regulatory norms, Coordination between the many para state agencies who were custodians of the lakes leading to their poor maintenance (Ramachandra T V et al., 2016).
Figure
Source: ENVIS Technical Report (2016)
The lakes of the Bangalore city are facing extinction due to pollution. One such highly polluted lake is ‘Bellandur Lake’. It is located at latitude of 12°58’ N and longitude of 77°35’ E at an elevation of 921 m above the sea level. About 20 km towards the south-east of Bangalore city. has a catchment area of 287.33 km2. One of the largest Lake in Bangalore city. being 3 km in length and 2.75 km in width (Pattusamy V et al., 2013).
The lake catchment has been subjected to extreme environmental stress mainly due to lush unplanned developmental activities in the catchment in recent years. The development plans of the region ignore the integrated planning approaches considering all the components of the ecosystem. This lake is scattered throughout the region (Parvathi K S et al.2018). The Bellandur lake spreads across six villages.
TABLE 1. Bellandur lake, break up and extent in each village
Taluk Hobli Villages
Survey number Area Acre Gunta
Bangalore East Varthur Ammanikere Bellandur Khane 1 284 2
Bangalore South Begur Ibbaluru 12 399 14
Bangalore South Begur Agara 43 (A) 166 15
Bangalore East Varthur Kempapura 6 13 15
Bangalore East Varthur Belur 2 40 15
Bangalore East Varthur Yamalur 62 3 4
Total Area 906 25
As per the RTC, WWW.bhoomi-karnataka.gov.in Spatial analysis using remote sensing data with geo-informatics (367.34 hectares) 907 28.4
Source: (Ramachandra T V et al. 2017, ENVIS technical report)
ISSN 2348-1218 (print)
International Journal of Interdisciplinary Research and Innovations ISSN 2348-1226 (online) Vol. 8, Issue 3, pp: (6-14), Month: July - September 2020, Available at: www.researchpublish.com
One of the major metropolitan city of India (Bangalore) selected for the study, An attempt has been made to study the present status of surface water resources mainly the Lakes in the city by using secondary data which are already exist in research papers, Journals, reports and other internet resources and open websites. The selected Lake was Bellandur Lake (one of the largest Lake in Bangalore city, Karnataka). A comparative study/work carried out between two years 2013 and 2017 analyzed data with reference to water quality status as per recent years’ research papers and analyzed data to generate sufficient comparison.
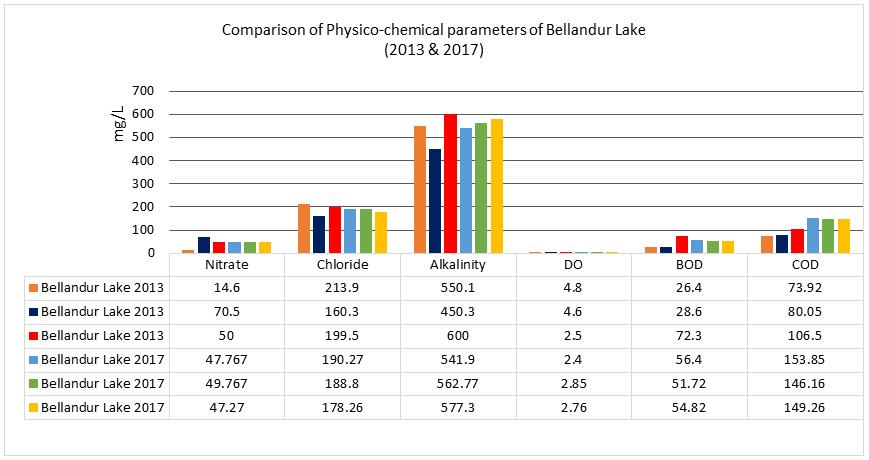
As per study of Ramesh. and Krishnaiah, 2014, the assessment of Physico-Chemical parameters of Bellandur Lake, Bangalore. The samples were collected during March, 2013 and the study carried out by the Parvathi et al., 2018, samples collected from different point of Bellandur Lake during February, March and April 2017. The samples were brought to the laboratory to analyzed for the parameters like: Temperature, Turbidity, Electrical Conductivity, Total Dissolved Solids, pH, Total Hardness, Calcium, Magnesium, Alkalinity, Sulphate, Nitrate, Chloride, Dissolved Oxygen (DO), Biological Oxygen Demand (BOD) and Chemical Oxygen Demand (COD). The analyzed data has shown in the Table 2 below.
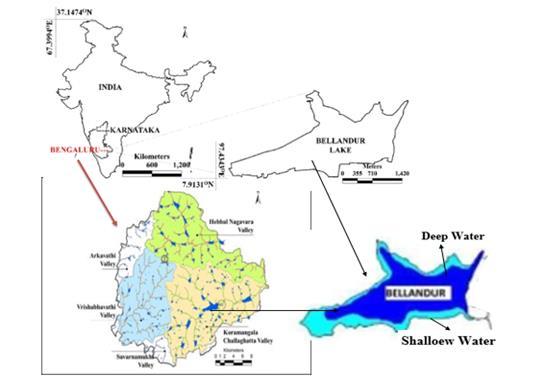
TABLE 2. Values of physico-chemical parameters of Bellandur Lake 2013 and 2017 along BIS Standards.
Bellandur Lake 2013 Bellandur Lake 2017 BIS limits (1998) S1 S2 S3 S 1 S2 S3 Desirable Permissible 1 Temperature C° 28 27.8 28.4 28.11 29.8 26.2 NA NA 2 Turbidity NTU 16.5 18.3 26.8 16 18.43 19.2 5 10 3 Electrical Conductivity μmohs/cm 1128 1150 1190 1196.6 1158 1062 2,000 3,000 4 TDS mg/L 617 746 594 776.62 751.94 689.61 1,000 2,000 5 pH 7.34 7.35 8.09 7.29 7.63 7.2 6.5-8.5 6.5-8.5 6 Total Hardness mg/L 280.2 240.1 320.4 269.68 288.4 336 300 600 7 Calcium mg/L 56.4 64.1 67.3 76 92 140 75 200 8 Magnesium mg/L 34.0 18.4 39.8 193.68 196.4 196 30 100 9 Sulphates mg/L 51.3 54.4 56.4 47.36 50.83 46.814 200 400
S. No Parameters
ISSN 2348-1218 (print)
International Journal of Interdisciplinary Research and Innovations ISSN 2348-1226 (online) Vol. 8, Issue 3, pp: (6-14), Month: July - September 2020, Available at: www.researchpublish.com
10 Nitrates mg/L 14.6 70.5 50.0 47.767 49.767 47.27 45 45 11 Chlorides mg/L 213.9 160.3 199.5 190.27 188.8 178.26 250 1,000 12 Alkalinity 550.1 450.3 600.0 541.9 562.77 577.30 200 600 13 DO mg/L 4.8 4.6 2.5 2.4 2.85 2.76 6.0 NA 14 BOD mg/L 26.4 28.6 72.3 56.4 51.72 54.82 3.0 6.0 15 COD mg/L 73.92 80.05 106.5 153.85 146.16 149.26 NA NA
Figure
ISSN 2348-1218 (print)
International Journal of Interdisciplinary Research and Innovations ISSN 2348-1226 (online) Vol. 8, Issue 3, pp: (6-14), Month: July - September 2020, Available at: www.researchpublish.com
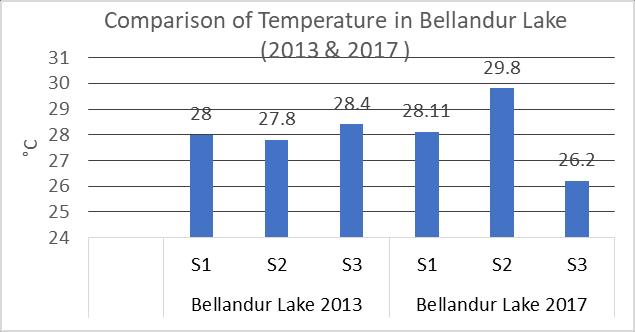
Figure 6: Graphical representation of Temperature in Bellandur Lake.
Figure
ISSN 2348-1218 (print)
International Journal of Interdisciplinary Research and Innovations ISSN 2348-1226 (online) Vol. 8, Issue 3, pp: (6-14), Month: July - September 2020, Available at: www.researchpublish.com
Bellandur Lake 2013
Result
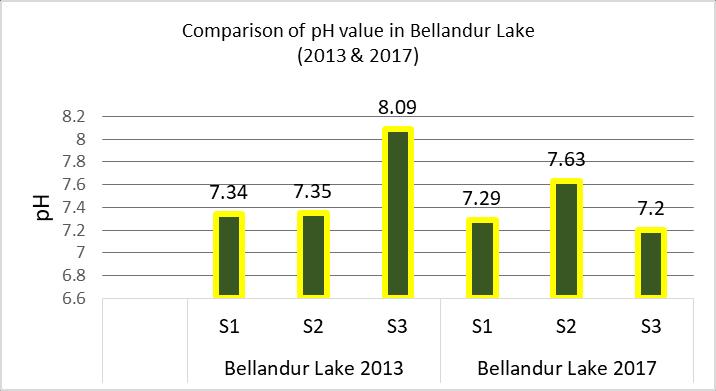
Figure 9: Graphical representation of pH in Bellandur Lake TABLE 3.
Bellandur Lake 2017
Result
The pH ranged from 7.34 – 8.09, of water samples which is exceeded to permissible limit. The three main processes affecting Lake pH are photosynthesis, respiration and nitrogen assimilation.
The pH ranged from 7.2 – 7.63, of water samples which is within the prescribed standard limit.
Electrical conductivity (EC) ranged between 10621196 μmohs/cm, which was within the desirable limit of BIS.
Electrical conductivity (EC) ranged between 11281190 μmohs/cm, which was within the desirable limit of BIS.
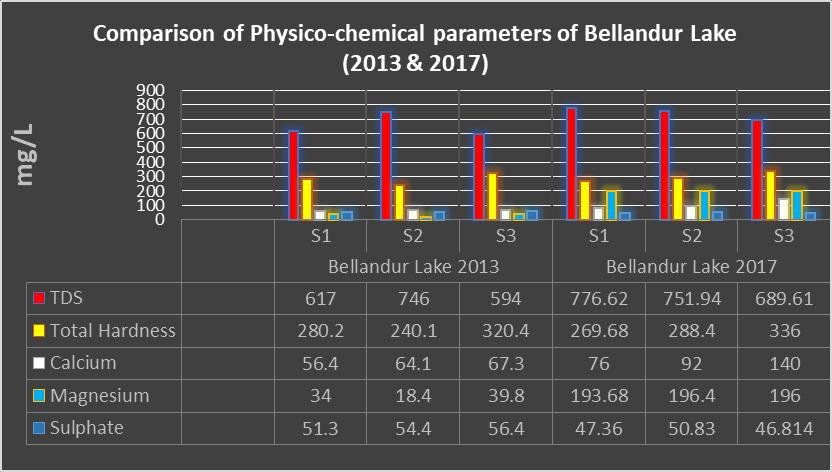
Total Dissolved Solids (TDS) ranged between 594746 mg/L, which was within the desirable limit of BIS.
Total Dissolved Solids (TDS) ranged between 689.61-776.62 mg/L, which was within the desirable limit of BIS.
Dissolved Oxygen (DO) was below the desirable limit of BIS. It was in the range of 2.4-2.85 mg/L. which shows more acidic condition.
Dissolved Oxygen (DO) was below the desirable limit of BIS. It was in the range of 2.5-4.8 mg/L.
Biological Oxygen Demand (BOD) ranged from 26.4 –72.3 mg/L. which is above the permissible limit of BIS.
Biological Oxygen Demand (BOD) ranged from 51.72-56.4 mg/L. which is above the permissible limit of BIS.
Chemical Oxygen Demand (COD) ranged from 73.92 – 106.5 mg/L which shows high value and cross the permissible limit of BIS.
Total hardness (TH) ranged from 280.2-320.4 mg/L which is slightly in the higher from desirable limit and it is within the permissible limit of BIS.
Chemical Oxygen Demand (COD) ranged from 146.16 – 153.85 mg/L which is alarmingly high and cross the permissible limit of BIS.
Total hardness (TH) ranged from 269.69-336 mg/L which is slightly higher from desirable limit and it is within the permissible limit of BIS.
Chlorides ranged between 160.3-213.9 mg/L which was within the desirable limit.
Total Alkalinity (TA) ranged between 450.3 –
Chlorides ranged between 178.26-190.27 mg/L which was within the desirable limit.
Total Alkalinity (TA) ranged between 542 – 580 mg/L. which was above the desirable limit and within the permissible limit of BIS.
ISSN 2348-1218 (print)
International Journal of Interdisciplinary Research and Innovations ISSN 2348-1226 (online) Vol. 8, Issue 3, pp: (6-14), Month: July - September 2020, Available at: www.researchpublish.com
600.0 mg/L. which was above the desirable limit and reached the permissible limit of BIS.
Nitrate (Nitrogen) ranged between 14.6-70.5mg/L. Nitrate (nitrogen) is above the desirable limit.
Sulphates ranged between 51.3 – 56.4 mg/L which is within the desirable limits.
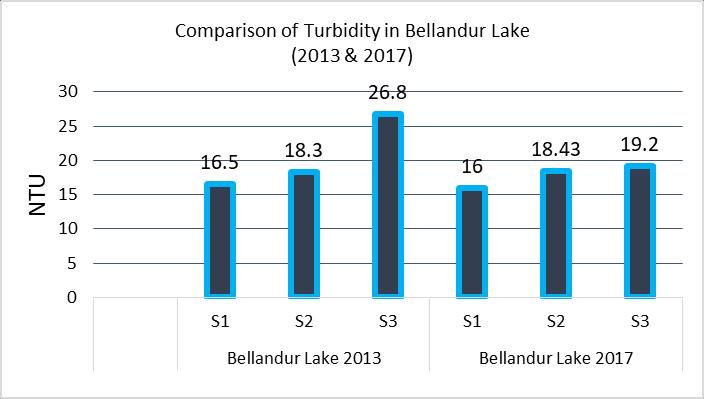
Turbidity is in the range of 16.5- 26.8 NTU which is very high when compared to permissible limits.
Magnesium ranges between 18.4-39.8mg/L which is within the permissible limit of BIS
Nitrate (Nitrogen) ranged between 47.767-49.767 mg/L. Nitrate (nitrogen) slightly exceeds standard limit.
Sulphates ranged between 46.814 – 50.83 mg/L which is within the desirable limits.
Turbidity is in the range of 16- 19.2 NTU which is very high when compared to permissible limits.
Magnesium ranges between 193.68-196.4 mg/L which is above the permissible limit of BIS
According to the present comparative study/work it is concluded that the some major Physico-chemical parameters such as COD, BOD, Total Dissolved solid (TDS), Electrical Conductivity (EC ), Total Hardness (TH), Calcium and Magnesium showed higher value also it considered that the water is more acidic in the year 2017 .The Lake water has Grey black color and highly turbidity, Sulphates and Magnesium level is at higher rate, and presence of sewage in the lake causing reduce Dissolved Oxygen (DO) and increase in Biological Oxygen Demand (BOD) and Chemical Oxygen Demand (COD. These situations in the lake indicated the pollution condition of Bellandur Lake. As the CPCB in the year 2013 categories this Lake (Bellandur Lake) in E class where the water comes for Irrigation, Industrial cooling and Controlled Waste disposal category. Solving the problem at end point is a temporary measure with more serious repercussions. The solution is to tackle this problem at source points with strict enforcement of environmental laws and regulations.
[1] Asmat Rashid, Mohammad Aneesul Mehmood, Humaira Qadri, Rouf Ahmad Bhat and Gowhar Hamid Dar.2018. Comparative water quality assessment of a tropical and a temperate lake of India. Journal of Pharmacognosy and Phytochemistry.7(4): 2246-2249.
[2] Bhateria Rachna and Disha Jain .2016. Water quality assessment of lake water: a review. Journal of Sustainable Water Resource Management, 2:161-173.
[3] Chandrashekar. H, Jyothiroopa, Lokesh K.V and Ranganna G.2012. Water Management – An Approach through Restoration and Management of Urban Lakes - A Case Study for Mallathahalli Lake in Bangalore; BALWOIS.
[4] Fathima and Rajesh Gopinath.2012. Tracing the Impact of Bangalore’s Urbanization on its Wetlands, International Journal of Environment, Ecology, Family and Urban Studies, 2(4): 23- 28.
[5] Gayathri S, Latha N and Ramachandra Mohan M.2015. Water quality status of Manchanabele Reservoir: Bangalore West Region, Karnataka, Indian.International Journal of Innovative Science, Engineering and Technology, 2 (12):364-372.
[6] KJA Task Group Karnataka State Water Policy 2019.
[7] Maqbool. F, Bhatti Z. A, Malik A.H, Pervez A and Mahmood Q.2010.Effect of Landfill Leachate on the Stream Water Quality.International Journal of Environmental Research, 5(2):491-500.
[8] Murugesha K. M. and Veerabhadrappa B. P.2013.An Overview of Karnataka’s Water Resources and Pollution.Global Journal of Bio - Science and Biotechnology,2(3):442-445.
[9] Parvathi K S, Shivani P Kumar and Vikash Kumar Gupta.2018. Evaluation of Water Quality in Bellandur Lake. International Journal of Engineering Technology Science and Research,5(1):1758-1762.
[10] Pattusamy V, Nandini N, M. Vijay Kumar and Bheemappa K.2013.Water Quality Studies of Bellandur Lake, Urban Bangalore, Karnataka, India.International Journal of Advanced Research, 1(4):77-82.
ISSN 2348-1218 (print) International Journal of Interdisciplinary Research and Innovations ISSN 2348-1226 (online) Vol. 8, Issue 3, pp: (6-14), Month: July - September 2020, Available at: www.researchpublish.com
[11] Pradeep Verma, Chandawat Deepika, Gupta Urvi and Solanki Hitesh.2010. Water Quality Analysis of an Organically Polluted Lake by Investigating Different Physical and Chemical Parameters. Journal of Research in Chemistry and Environment,2(1):105-111.
[12] Ramesh. N, Krishnaiah. S.2013. Scenario of Water Bodies (Lakes) In Urban Areas- A case study on Bellandur Lake of Bangalore Metropolitan city. Journal of Mechanical and Civil Engineering,7(3):6-14.
[13] Ramachandra T.V , Asulabha K.D, Sincy V, Sudarshan P Bhat and Bharath H. Aithal.2016. Wetland: Treasure of Bangalore [Abused , Polluted , Encroached , Vanishing ] , ENVIS Technical Report:101.
[14] Ramesh. N and Krishnaiah S.2014. Assessment of Physico-Chemical Parameters of Bellandur Lake, Bangalore, India. International Journal of Innovative Research in Science, Engineering and Technology,3(3):10402-10407.
[15] Ramesh N and Krishnaiah S. 2015. Determination of Water Quality Index of an Urban Waterbody of Bellandur Lake in Bangalore City, Karnataka, India.Journal of Information Knowledge and Research in Civil Engineering,3(2):175-182.
[16] Rashmi Verma and Pratima Dwivedi.2013. Heavy metal water pollution- A case study, Recent Research in Science and Technology, 5(5): 98-99.
[17] Ravikumar P, Mohammad Aneesul Mehmood and Somashekar R K.2013.Water quality index to determine the surface water quality of Sankey tank and Mallathahalli lake, Bangalore urban district, Karnataka, India.Application of Water Science, open access at springerlink.com,3:247-261.
[18] Susanna T. Y. Tony and Wenlichen.2002. Modeling the relationship between land use and surface water quality. Journal of Environmental Management, 66:877-393.