ISSN 2348-1218 (print)
International Journal of Interdisciplinary Research and Innovations ISSN 2348-1226 (online) Vol. 8, Issue 3, pp: (52-58), Month: July - September 2020, Available at: www.researchpublish.com

ISSN 2348-1218 (print)
International Journal of Interdisciplinary Research and Innovations ISSN 2348-1226 (online) Vol. 8, Issue 3, pp: (52-58), Month: July - September 2020, Available at: www.researchpublish.com
Vasai Primary Kumar School No.1,Vijapur,Mahesana,Gujarat,India
Abstract: While the India is caught in a lockdown and faces a grim battle with Coronavirus,The CPCB has assessed that this lockdown has led to near a dramatic in the AQI in India. The objective of this research paper is to review the effect of COVID 19 LOCKDOWN on Air Pollution in Delhi , India .In this paper analyze a data of AQI(Air Quality Index) in the days of lockdown. In this lockdown days NPR reported that the concentration of fine particulate matter in the air had dramatically dropped since India’s prime minister Shri Narendra Modi first imposed the countrywide lockdown in march.
Keywords: AQI, Air Pollution, COVID 19 Lockdown, Delhi, Central Pollution Control Board.
India is 17th Most polluted country in the world in this year 2020.This paper’s main purpose is that to show the effect of COVID 19 LOCKDOWN on Air pollution in Delhi.
COVID 19 LOCKDOWN :
On 12 January 2020,the WHO comfirmed that a Novel Corona virus was the cause of a respiratory illness in a cluster of people in Wuhan city, Hubei province ,china ,Which was reported to the WHO on 31 December 2019.
On 24 March, the Government of India under Prime Minister Narendra Modi ordered a nationwide lockdown for 21 days, limiting movement of the entire 1.3 billion population of India as a preventive measure against the 2020 corona virus pandemic in India.
Part
Closure of commercial and private establishments (only work-from-home allowed)
Suspension of all educational, training, research institutions
Closure of all places of worship
Suspension of all non-essential public and private transport
Prohibition of all social, political, sports, entertainment, academic, cultural, religious activities Resulted in Lockdown throughout the country
ISSN 2348-1218 (print)

International Journal of Interdisciplinary Research and Innovations ISSN 2348-1226 (online) Vol. 8, Issue 3, pp: (52-58), Month: July - September 2020, Available at: www.researchpublish.com


India having the population of about 132.42 crores according to the 2016 census is the second largest populated country in the world. High the population, high is the pollution across the country. Almost three fourth of the country’s population owns vehicle and there are lot of industries. The smoke from the industries and the vehicle are being the major reason for the air to be polluted. Air pollution occurs when there are harmful gases and smoke mix up with the atmosphere and the air gets contaminated and the quality of air becomes low. The level of contamination in air is measured by the common principle called air quality index.
1. Air Quality Index is a tool for effective communication of air quality status to people in terms, which are easy to understand. It transforms complex air quality data of various pollutants into a single number (index value), nomenclature and colour.
2. There are six AQI categories, namely Good + Satisfactory, Moderately polluted, Poor, Very Poor, and Severe. Each of these categories is decided based on ambient concentration values of air pollutants and their likely health impacts (known as health breakpoints). AQ sub-index and health breakpoints are evolved for eight pollutants (PM10, PM2.5, NO2, SO2, CO, O3, NH3, and Pb) for which short-term (upto 24-hours) National Ambient Air Quality Standards are prescribed
The real time data of continuous ambient air quality, monitoring by Central Pollution Control Board
The area of the reaserch is Delhi Cities’ 21 different areas which located for AQI. The sampling of the above pollutants was recorded continuously for 24-hours on 2 days in each week using a High Volume Sampler and Respirable Dust Sampler. The sampling was done at four different locations.The sampling and analysis of the samples was done as per NAAQM Standard methods of sampling and analysis (CPCB, Guidelines for measurement of ambient air pollutants, volume-1). The particulate matter (PM10 and PM2.5) were determined by gravimetric method i.e air is drawn through a pre weighed glass fibre filter paper on 10 hourly basis for 24 hours. Gaseous pollutants (SO2 and NO2) were collected using an absorbing solution on 6 hourly basis for 24 hours by drawing air at a flow rate of 1 LPM. These gaseous pollutants were analysed by West and Geake method (for SO2) & Jacob and Hochheiser method (for NO2). The concentrations of these methods were expressed in μg/m3.
ISSN 2348-1218 (print)
International Journal of Interdisciplinary Research and Innovations ISSN 2348-1226 (online) Vol. 8, Issue 3, pp: (52-58), Month: July - September 2020, Available at: www.researchpublish.com
An example of AQI calculation and description for Delhi (online air quality monitoring network) given pollutant concentration (Cp), as based on ‘linear segmented principle’ is calculated as:
Ip= [{(IHI - ILO)/ (BHI -BLO)} * (Cp-BLO)] + ILO
BHI= Breakpoint concentration greater or equal to given conc.
BLO= Breakpoint concentration smaller or equal to given conc.
IHI = AQI value corresponding to BHI
ILO = AQI value corresponding to BLO
Finally;
AQI = Max (Ip) (where; p= 1,2,...,n; denotes n pollutants)
India’s decision to put the country under a 21-day lockdown period in a bid to slow the corona virus pandemic has a bright spot to it as far as the air quality index (AQI) of major industrial cities goes along with with Delhi, which recorded a massive drop in pollution levels.
According to Central Pollution Control Board’s National Air Quality Index data analyzed by ET Energy world, AQI reading at Delhi’s ITO area was ‘satisfactory’ at 53 on 31 March, 2020, a reduction of about 70 per cent from previous year’s figure of 176 recorded on the same day.
A below 50 reading indicates good air quality, 51-100 is satisfactory, 101-200 is moderate, 201-300 is poor, 301-400 is very poor, and a reading above 401 is severe. However, in Delhi’s case this reduction is largely due to a fall in vehicular emissions as a result of the lockdown. Public transport such as metro trains, buses, flights have been shut, and cab aggregators such as Ola and Uber have also suspended their operations in many cities since the announcement on 25 March.
Now AQI Data of Delhi cities different areas : Figure : 1.1 (Before Lockdown AQI data)
DELHI CITY AREAS NAME 11-Mar-20 12-Mar-20 13-Mar-20 14-Mar-20 15-Mar-20 16-Mar-20 17-Mar-20 18-Mar-20 19-Mar-20 20-Mar-20 21-Mar-20 22-Mar-20 23-Mar-20 Average
1 Ashok Vihar, Delhi - DPCC 141.00 128.00 160.00 108.00 190.00 158.00 182.00 210.00 179.00 198.00 225.00 129.00 124.00 164.00
2 Aya Nagar, Delhi - IMD 107.00 107.00 136.00 100.00 103.00 109.00 109.00 128.00 122.00 115.00 148.00 76.00 97.00 112.08
3 Bawana, Delhi - DPCC 130.00 127.00 221.00 224.00 150.00 200.00 204.00 232.00 214.00 256.00 275.00 133.00 148.00 193.38
4 CRRI Mathura Road, Delhi - IMD 104.00 122.00 151.00 77.00 112.00 129.00 158.00 186.00 182.00 149.00 185.00 87.00 122.00 135.69
5 DTU, Delhi - CPCB 110.00 128.00 184.00 172.00 134.00 160.00 199.00 250.00 219.00 243.00 256.00 126.00 98.00 175.31
6 Dwarka-Sector 8, Delhi - DPCC 150.00 150.00 232.00 150.00 168.00 199.00 222.00 240.00 201.00 227.00 234.00 105.00 143.00 186.23
7 IHBAS, Dilshad Garden, DelhiCPCB 91.00 132.00 154.00 60.00 143.00 108.00 135.00 168.00 252.00 174.00 198.00 83.00 95.00 137.92
8 Jawaharlal Nehru Stadium, DelhiDPCC 122.00 123.00 157.00 107.00 96.00 117.00 129.00 147.00 194.00 187.00 171.00 84.00 101.00 133.46
9 Lodhi Road, Delhi - IMD 105.00 114.00 127.00 97.00 91.00 98.00 104.00 119.00 136.00 138.00 153.00 76.00 85.00 111.00
10 Major Dhyan Chand National Stadium, Delhi - DPCC 110.00 114.00 140.00 114.00 104.00 107.00 119.00 140.00 161.00 151.00 167.00 81.00 111.00 124.54
11 Mundka, Delhi - DPCC 130.00 130.00 207.00 194.00 170.00 218.00 216.00 257.00 188.00 240.00 240.00 122.00 98.00 185.38
12 NSIT Dwarka, Delhi - CPCB 90.00 132.00 199.00 165.00 127.00 117.00 223.00 208.00 272.00 229.00 216.00 96.00 106.00 167.69
13 Narela, Delhi - DPCC 107.00 121.00 190.00 141.00 145.00 140.00 170.00 212.00 218.00 264.00 262.00 128.00 143.00 172.38
14 Nehru Nagar, Delhi - DPCC 114.00 120.00 156.00 97.00 117.00 145.00 156.00 189.00 248.00 212.00 196.00 215.00 159.00 163.38
15 North Campus, DU, Delhi - IMD 97.00 107.00 137.00 94.00 90.00 105.00 129.00 119.00 141.00 139.00 157.00 84.00 83.00 114.00
16 Okhla Phase-2, Delhi - DPCC 115.00 136.00 178.00 94.00 116.00 128.00 150.00 157.00 174.00 155.00 175.00 85.00 108.00 136.23
17 Patparganj, Delhi - DPCC 108.00 115.00 141.00 84.00 98.00 105.00 123.00 144.00 178.00 145.00 158.00 79.00 97.00 121.15
Delhi - CPCB 69.00 73.00
ISSN 2348-1218 (print)
International Journal of Interdisciplinary Research and Innovations ISSN 2348-1226 (online) Vol. 8, Issue 3, pp: (52-58), Month: July - September 2020, Available at: www.researchpublish.com
DELHICITYAREASNAME 25-Mar-20 26-Mar-20 27-Mar-20 28-Mar-20 29-Mar-20 30-Mar-20 31-Mar-20 01-Apr-20 02-Apr-20 03-Apr-20 04-Apr-20 05-Apr-20 06-Apr-20 07-Apr-20 08-Apr-20 09-Apr-20 10-Apr-20 11-Apr-20 12-Apr-20 13-Apr-20 14-Apr-20 15-Apr-20 16-Apr-20 AVERAGE
1 AshokVihar,Delhi-DPCC 100.00 103.00 74.00 51.00 55.00 64.00 76.00 67.00 74.00 62.00 90.00 117.00 186.00 85.00 94.00 81.00 136.00 90.00 85.00 131.00 101.00 130.00 237.00 99.52
2 AyaNagar,Delhi-IMD 56.00 70.00 88.00 28.00 38.00 48.00 52.00 49.00 58.00 47.00 62.00 70.00 91.00 66.00 73.00 61.00 86.00 80.00 74.00 102.00 83.00 141.00 129.00 71.83
3 Bawana,Delhi-DPCC 97.00 135.00 103.00 39.00 71.00 99.00 143.00 93.00 96.00 104.00 115.00 121.00 136.00 1170.00 119.00 112.00 166.00 132.00 120.00 170.00 213.00 230.00 246.00 175.22
4 CRRIMathuraRoad,Delhi-IMD 81.00 68.00 56.00 34.00 62.00 57.00 65.00 63.00 56.00 55.00 72.00 125.00 147.00 80.00 82.00 83.00 101.00 143.00 84.00 107.00 114.00 162.00 180.00 90.30
5 DTU,Delhi-CPCB 72.00 110.00 85.00 35.00 65.00 75.00 88.00 77.00 80.00 78.00 114.00 118.00 155.00 99.00 110.00 100.00 159.00 102.00 110.00 151.00 158.00 163.00 202.00 108.96
6 Dwarka-Sector8,Delhi-DPCC 77.00 90.00 71.00 34.00 62.00 86.00 68.00 69.00 66.00 85.00 102.00 116.00 154.00 104.00 99.00 101.00 155.00 116.00 96.00 148.00 154.00 179.00 191.00 105.35
7 IGIAirport(T3),Delhi-IMD 65.00 58.00 46.00 31.00 40.00 51.00 51.00 52.00 57.00 57.00 64.00 88.00 139.00 75.00 76.00 63.00 113.00 85.00 76.00 123.00 111.00 141.00 152.00 78.87
8 IHBAS,DilshadGarden,Delhi-CPCB 66.00 60.00 39.00 30.00 40.00 21.00 22.00 22.00 25.00 19.00 51.00 47.00 56.00 33.00 26.00 27.00 51.00 52.00 45.00 65.00 57.00 54.00 61.00 42.13
9 JawaharlalNehruStadium,DelhiDPCC 68.00 71.00 59.00 29.00 42.00 60.00 59.00 55.00 54.00 59.00 83.00 68.00 141.00 75.00 92.00 75.00 106.00 160.00 89.00 116.00 104.00 156.00 167.00 86.43
10 LodhiRoad,Delhi-IMD 61.00 71.00 65.00 24.00 36.00 55.00 52.00 54.00 51.00 50.00 61.00 64.00 108.00 71.00 83.00 66.00 80.00 84.00 93.00 107.00 141.00 152.00 175.00 78.43
11 MajorDhyanChandNationalStadium, Delhi-DPCC 62.00 64.00 53.00 27.00 34.00 54.00 50.00 52.00 52.00 52.00 55.00 59.00 128.00 69.00 82.00 67.00 92.00 112.00 79.00 103.00 88.00 138.00 150.00 74.87
12 Mundka,Delhi-DPCC 79.00 137.00 92.00 47.00 92.00 117.00 145.00 74.00 99.00 110.00 171.00 165.00 185.00 118.00 98.00 125.00 184.00 180.00 130.00 175.00 191.00 171.00 224.00 135.17
13 NSITDwarka,Delhi-CPCB 86.00 101.00 82.00 55.00 65.00 75.00 78.00 72.00 74.00 65.00 80.00 79.00 119.00 81.00 71.00 85.00 122.00 80.00 85.00 111.00 120.00 107.00 161.00 89.30
14 NehruNagar,Delhi-DPCC 74.00 76.00 71.00 54.00 50.00 68.00 69.00 64.00 59.00 64.00 76.00 88.00 165.00 67.00 48.00 150.00 179.00 218.00 153.00 169.00 100.00 184.00 210.00 106.78
15 NorthCampus,DU,Delhi-IMD 71.00 63.00 57.00 59.00 59.00 80.00 64.00 70.00 63.00 61.00 63.00 64.00 107.00 77.00 78.00 69.00 81.00 85.00 79.00 96.00 95.00 145.00 144.00 79.57
16 OkhlaPhase-2,Delhi-DPCC 78.00 70.00 60.00 51.00 52.00 62.00 58.00 60.00 57.00 60.00 70.00 71.00 143.00 74.00 92.00 72.00 106.00 110.00 86.00 149.00 104.00 161.00 160.00 87.22
17 Patparganj,Delhi-DPCC 76.00 68.00 56.00 23.00 52.00 62.00 58.00 60.00 59.00 53.00 55.00 65.00 125.00 58.00 62.00 59.00 74.00 74.00 75.00 105.00 83.00 125.00 178.00 74.13
18 Shadipur,Delhi-CPCB 61.00 92.00 49.00 62.00 39.00 57.00 59.00 45.00 53.00 63.00 86.00 60.00 54.00 57.00 62.00 69.00 57.00 59.00 73.00 56.00 56.00 66.00 75.00 61.30 19 Sirifort,Delhi-CPCB 198.00 170.00 156.00 30.00 43.00 50.00 62.00 55.00 59.00 163.00 75.00 67.00 113.00 78.00 88.00 72.00 104.00 93.00 89.00 131.00 103.00 152.00 157.00 100.35
Figure : 1.1 ( Lockdown Days AQI data)

Figure : 1.2 ( PM10 AQI graph ) Figure : 1.3 ( PM2.5 AQI graph )

ISSN 2348-1218 (print)
International Journal of Interdisciplinary Research and Innovations ISSN 2348-1226 (online) Vol. 8, Issue 3, pp: (52-58), Month: July - September 2020, Available at: www.researchpublish.com
Figure : 1.4 ( Ozone AQI graph )

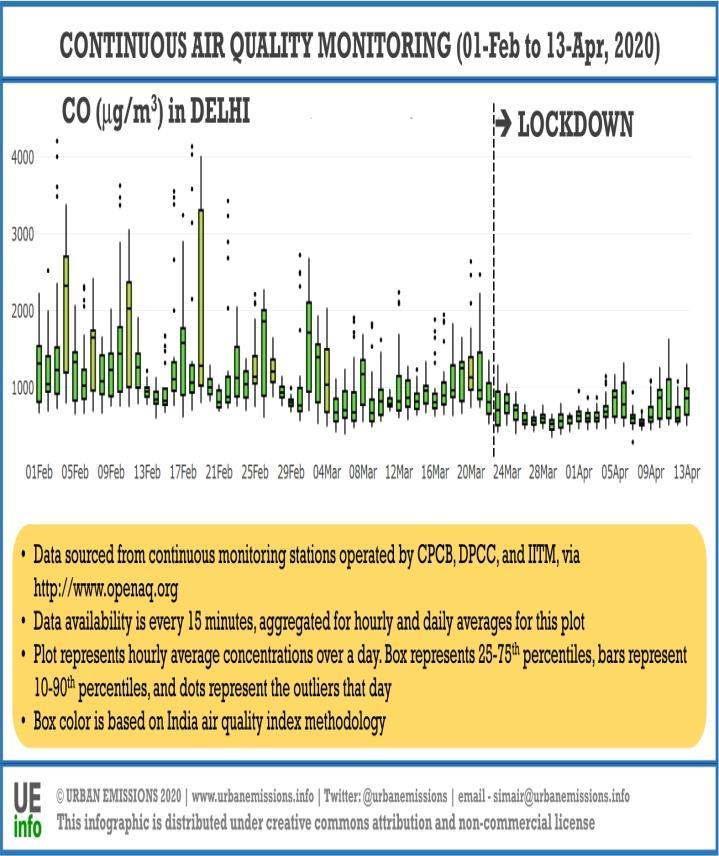

Figure : 1.5 ( SO2 AQI graph )
Figure : 1.6 ( CO AQI graph )
Figure : 1.7 ( NO2 AQI graph )
Figure :- 1.8 ( Lockdown Graphical effect of AQI in Delhi )


ISSN 2348-1218 (print)
International Journal of Interdisciplinary Research and Innovations ISSN 2348-1226 (online) Vol. 8, Issue 3, pp: (52-58), Month: July - September 2020, Available at: www.researchpublish.com
Values in 2020 have better air quality than the worst performers in 2019. First, the peak AQI value has dropped significantly, from an AQI of 298 in Sirifort, Delhi to 207 in Guwahati. Second, the cities with the worst AQI levels now are mostly different than those in 2019.
Shifting the focus to Delhi, currently only one station in Delhi (Mundaka: 101) shows ‘Moderate’ air quality amongst the top ten locations with the worst air quality during the past week. This is a big departure from the AQI trend from last year when at least three, including the worst performer (Sirifort), stations located in Delhi had ‘Poor’ air quality. So, one can be assured of Delhi’s residents breathing cleaner air in this period. But let us not forget that cities in other states had ‘Moderate’ to ‘Poor’ air quality during the first week of lockdown in India. In fact, Guwahati in Assam, is the only city which shows AQI of 207, with air quality in the ‘Poor’ category. In 2019, all the top ten places with soaring AQI were from two states, Uttar Pradesh and Delhi.
Figure:- 1.9 ( Compare of AQI year 2019 and 2020 before Lockdown)
Top ten locations with the worst AQI in 2020 and 2019. (The seven day average is calculated for the March 25-31 period, accounting for stations that operated for more than six days in this period. Data analysis by the author.)
The fact that new cities are emerging in the worst AQI readings, despite the uniformity of the lockdown orders across the nation, introduces new questions for policymakers and scientists alike.
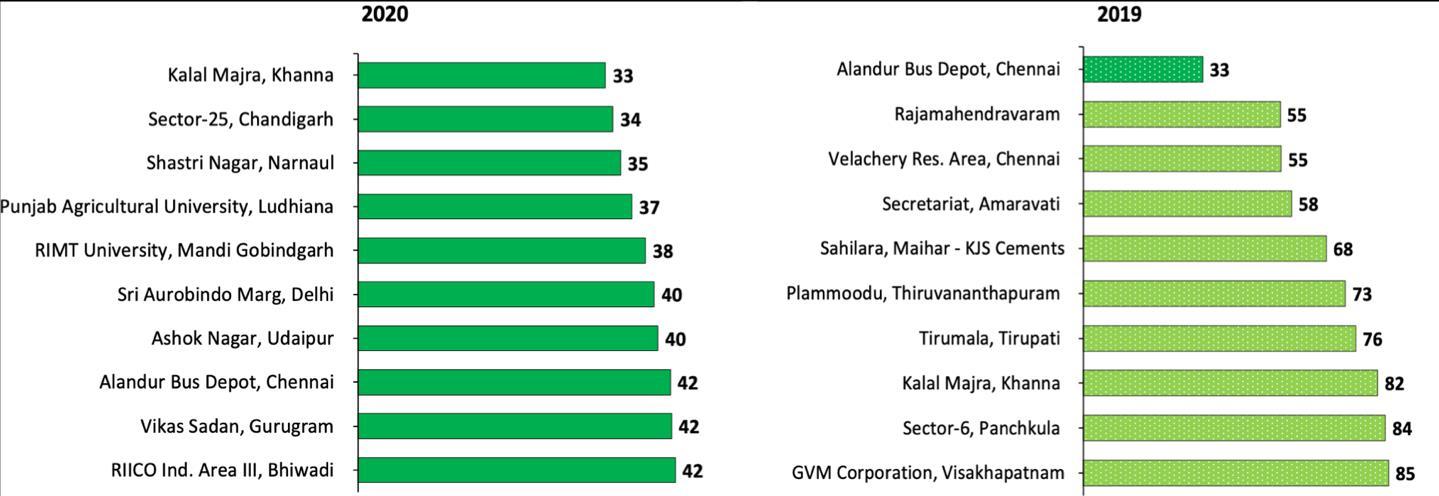
Figure :- 1.10 ( Compare of AQI year 2019 and 2020 after Lockdown)
Top ten locations with the best AQI in 2020 and 2019. (The seven day average is calculated for the March 25-31 period, accounting for stations that operated for more than six days in this period )
The best performing cities show a similar trend with more cities now breathing ‘Good’ air as compared to 2019, when nine out of the top ten cities had AQI in the ‘Satisfactory’ category.
In fact, the air quality seems to have tremendously improved in the north, with all the top locations, except Chennai (Alandur), reported in Punjab, Haryana, Rajasthan and Delhi.

ISSN 2348-1218 (print)
International Journal of Interdisciplinary Research and Innovations ISSN 2348-1226 (online) Vol. 8, Issue 3, pp: (52-58), Month: July - September 2020, Available at: www.researchpublish.com
In This research paper we can see an information data of AQI data Which related to LOCKDOWN days and without LOCKDOWN days there are many different between it.In AQI average is without Lockdown days is 148.93 and in Lockdown days it is only 91.48.AQI is dropped 57.45.In Delhi’s atmosphere Air is clean now in Lockdown days.All data , graphs and information are conclude that Lockdown is very positive effect for Delhi’s Air pollution and benefit for Air Quality Index.
[1] https://en.wikipedia.org/wiki/2020_coronavirus_lockdown_in_India
[2] https://app.cpcbccr.com/AQI_India/
[3] Natinal Air Quality Index CPCB book published PR Division on behalf of Dr. A.B. Akolkar, Member Secretary, CPCB, Delhi-110032 October 2014
[4] Science the wire website https://science.thewire.in/environment/covid-19-lockdown-india-air-pollution/