ISSN 2348-313X (Print)
International Journal of Life Sciences Research ISSN 2348-3148 (online)
Vol. 8, Issue 3, pp: (27-35), Month: July - September 2020, Available at: www.researchpublish.com

ISSN 2348-313X (Print)
International Journal of Life Sciences Research ISSN 2348-3148 (online)
Vol. 8, Issue 3, pp: (27-35), Month: July - September 2020, Available at: www.researchpublish.com
Corresponding Author: wala.hemendra23@gmail.com
Abstract: Present study deals with the analysis of the current status of Physico-Chemical parameters of water samples collected monthly from four different monitoring stations of Dilawara reservoir of Dhar district, Madhya Pradesh during January 2017 to December 2018 by using different standard methods, procedures, and instruments.The water temperature, transparency and pH were measured in-situ by using 0.1scale Mercury thermometer, Sacchi disc and pocket type digital pH meter respectively. The remaining parameters were determined ex-situ in the laboratory as per the standards. The results indicated that most parameters were within the permissible limit except for the pH, DO and COD which indicated the pollution in reservoir built for storing water to be used for irrigation, human consumption and pesiculture.The water quality index (WQI) calculated for the year 2017 and 2018 by computing mean values of 13 important parameters with the help of weighted Arithmetic method reveals that water quality is in medium to bad range (WQI= 49 - 69).HenceDilawara reservoir, an important drinking water source of Dhar tehsil is not suitable for useunless treated prior to consumption. Therefore urgent and immediate actions are required for its propermanagement to restore the quality of the water andfor its long time surveillance.
Keywords: Dilawara reservoir, water quality, physicochemical parameters,water quality index.
Availability of safe and reliable water is an essential prerequisite for sustained development (Adakole et al., 2012).It is important to constantly protect and control the quality of water (WHO, 2011).Over-growing population has resulted to the impoundment of many dams and reservoirs. It is therefore necessary to maintain our reservoirs by addressing the consequences of present and future threats of contamination and degradation of our water bodies. The monitoring of quality of surface waters by estimating hydrobiological parameters is among the major environmental priorities as it permits direct assessment of the status of ecosystems that are exposed to deleterious anthropogenic factors (Vandysh, 2004).Essentially, the surface water quality is characterized by various physico-chemical characteristics, and these parameters are prone to change owing to different kinds of pollution, seasonal fluctuation, and water extraction, etc. (Vasanthy and Velmurugan, 2009). The alteration in physico-chemical parameters leading to eutrophication has become a widely recognized problem of water quality deterioration (Jayakumaret al., 2009).The literature reveals that there is no scientific study carried out with respect to ecological characteristics of Dilawara reservoir, Hence this study was designed to monitor its water quality parameters, so as analyse its status and suitable through the potability and agriculture, pisciculture and drinking water quality point of view.
Sampling Sites: The proposed investigation was carried out in the fourselected sampling stations of Dilawara reservoir located in Dhartehsil of Dhar district, Madhya Pradesh,India.
ISSN 2348-313X (Print)
International Journal of Life Sciences Research ISSN 2348-3148 (online) Vol. 8, Issue 3, pp: (27-35), Month: July - September 2020, Available at: www.researchpublish.com
Water analysis: Thewater samples were collected from four selected sampling stations namely, S1, S2, S3 and S4 fromJanuary 2017 to December 2018. The water samples were collected in cleaned and rinsed plastic containers of twoliter capacity from all the four stations. A total of 13 parameters (temperature, transparency, pH, Total Hardness, Dissolved Oxygen, Biological Oxygen Demand, Chemical Oxygen Demand, Total dissolved solids, Total suspended solids,chloride, Nitrate Phosphate and sulphate) were studied among which few parameters such as temperature, transparency and PH were determined on the siteat the time of sample collection by using 0.1scale thermometer, Sacchi disc and pocket type digital PH meter (calibrated by PH 7 and PH 4 buffer tablets) respectively. The remaining parameters were determined in the laboratory as per the standards (APHA, 2002; NEERI, 1986; Welch, 1998 andGolterman, 1978).
Calculation of National sanitation foundation Water Quality Index (NSF-WQI):-
The water quality index is a modern method that reflects the quality of any water body under study by means of a single number, calculated by considering combined effect of important physico-chemical parameters. In the present study, weighted Arithmetic method developed by (Brown et al., 1972)has been used preferable to calculate the water quality index of the Dilawara reservoir by using the formula
NSFWQI = ∑
The overall water quality of any water body is assessed by using following gradation table1. Water Quality level Water Quality status 91-100 Excellent 70-89 Good 50-69 Medium 25-49 Bad 0-24 Unfit for Drinking Purpose
Source: Brown et al (1972), Chatterji and Raziuddin (2002)
Water Quality Index (WQI):
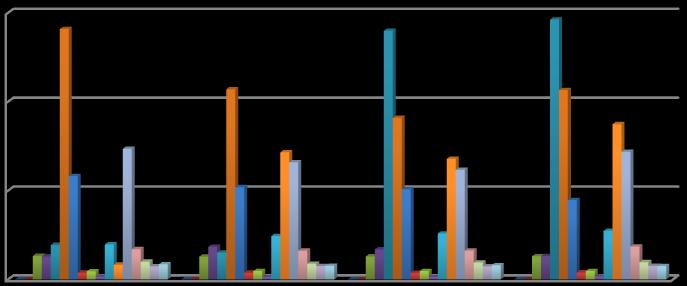
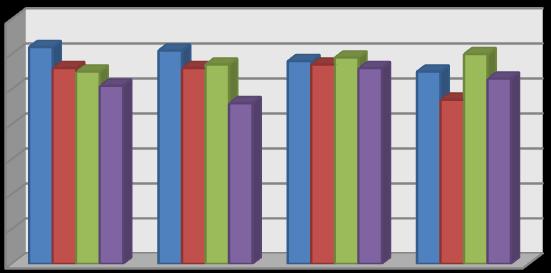
National Sanitation Foundation Water Quality Index (NSF- WQI) of the water reservoir under investigation calculated independently for the year 2017 and 2018 by taking mean value of thirteen important parameters has been reflected in the table 2 and figure 1.The WQI values for the year 2017 are 62,61,58,55,56,56,57 and 47 and for the year 2018 are 55,57,59,60,51,46,56 and 53in the monitoring stations S1, S2, S3 and S4 respectively.It is interpreted after study and analysis of data that the WQI indicates that the quality of water is in medium to bad range (WQI= 49 - 69). Further it is concluded after careful examination and interpretation of two years of result that water quality of reservoiris under constant deterioration and usually diverges from normal levels and the water is hardly able to protect or support plenty aquatic life.
Physico chemical parameters:
Table 3-6 and Fig. 2-3 shows the mean, standard error and range of physic- chemical parameters measured fromJanuary 2017 to December 2018.
The temperature plays an important role for controlling the physico-chemical and biological parameters of water and considered as one among the most important factors in the aquatic environment particularly for freshwater (Singh and Mathur, 2005) Temperature values ranged from17.5°C to 33°C at station IV. Minimum temperature of 17.5 was recorded during the year 2017 in the month of May and maximum 33 ºC was recorded during the year 2018 in the month of January.The main reason for highest temperature is climatic condition of the site, as the site lies in the Malwa region which is considered hottest region of the Madhya Pradesh,Similar result were also recorded by (Kale and Kutemate, 2011) and (Sawantet al., 2012) .
ISSN 2348-313X (Print)
International Journal of Life Sciences Research ISSN 2348-3148 (online) Vol. 8, Issue 3, pp: (27-35), Month: July - September 2020, Available at: www.researchpublish.com
Transparency:
Transparency of water is a measurement of the depth of light penetration into the water. It depends on the amount of particles present in the water. The transparency value fluctuated between 13 to 53mg/l. The minimum transparency13 mg/l was recorded at station IV in December 2017and the maximum value 53mg/l at station III in May 2018. The main reason for different values was high turbid water during monsoon and large biological productivity in the pre monsoon season that is high density of planktons. The present study is in confirmation with(Khan and Chowdhury, 1994) who reported that higher transparence occurred, during winter and summer due to absence of rain, runoff and flood water as well as gradual settling of suspended particles (Kadam et al., 2007) also reported similar observation.
The observed values of pH of both the years suggested that the water of the river is alkaline in nature with the values ranged from 7.3 to 10.2 i.e. it is a bit above the permissible value as per WHO and BIS. Highest value was observed in the summer season can be due to the high photosynthetic rate, biological activities, and temperature changes (Gangwaret al., 2012).The lower value of PH in themonth of February is due to high turbidity; the high temperature enhances microbial activity causing excess production of CO2 and reduces pH(Moundiotiyaet al., 2004).Any alteration in water pH is accompanied by the change in other physico-chemical parameters.
Dilwara reservoir showed higher values of total dissolved solidsbut well in the permissible ranges (500-100).It elevates the density of water and reduces solubility of oxygen that may prove lethal to aquatic life.The maximum value 490 of total dissolved solids was recorded in November during the year 2018 at station I while the lowest value 145 was observed at station III in December 2018.The concentration was high during post monsoon season, which may be due todecaying of vegetation and higher rate of evaporation andaddition of solids from runoff water to the reservoir (Usman, 2016).Similar observations were made by(Gadzama, and Mondo, 1898).Total Dissolved solids reduce the water clarity decreases photosynthesis and increases water temperature (Krishna Ram et al., 2009).
The maximum value 210 of total suspended solids was recorded in July during the year 2017 at station I while the lowest value 50 was observed at station IV in April2018.The concentration was high during monsoon season, which may be due to addition of solids from runoff water to the reservoir (Bhadja and Vaghela, 2013).
In the current study the average values of total hardness lies in the same zone as the other normal reservoirs of India possess it was in the permissible range (200 -0600 mg/l) WHO & BIS standards. The total hardness has shown variation from 63 to 212 mg/l. The highest amount of total hardness in the water was recorded during post monsoon as 212mg/l at station II in the month of October due to the presence of high content of calcium and magnesium ions in addition to sulphate and nitrate in the sewage waste added during monsoon(Angadi , et al., 2005) The lowest amount of total hardness was recorded during summer season as 63mg/l was recorded at station IV in April because of low volume of water and high rate of vegetation in the reservoir (Solanki and Pandit, 2006).
The highest amount of dissolved oxygen recorded during the winter season was 9.12 mg/l at station II, III and IV because of the increased solubility of oxygen at lower temperature whereas, the lowest dissolved oxygen was recorded as 5.5 mg/l during the summer season and moonsoon season at station-I which can be related to the high temperature and the addition of sewage and other wastes and drastically reduced the dissolved oxygen content. The present study is in accordance with the observations made by (Umerfaruq and Solanki, 2015)
The current study of the reservoir showed the BOD in the permissible value i.e. <3 as per WHO and BIS. The value of biochemical oxygen demand was varied between 1.7mg/l to 8.4mg/l. Minimum value of BOD 1.7mg/l was observed at stations II and III in December and April 2017 which is due to low intervention of people and sparse inhibition of people
ISSN 2348-313X (Print)
International Journal of Life Sciences Research ISSN 2348-3148 (online) Vol. 8, Issue 3, pp: (27-35), Month: July - September 2020, Available at: www.researchpublish.com
in the catchment areas and maximum value was observed at station I (8.4mg/l) in January 2018 which is mainly due the direct entry of urban drainage as the site is near the highly populated town.(Devarajuet al., 2005) has made similar observations in Maddur Lake and (Garg et al., 2010) has also made similar observations in Ramsagar reservoir.
The chemical oxygen demand varied between 25mg/l to 75 mg/l. The minimum chemical oxygen demand of 25mg/l was recorded at station I in March 2017 and the maximum of 75mg/l at station IV in April and June 2018. The increase in the value with the time is mainly resistance to degradation and receiving more pollutants while flowing through the seasons. The values suggest that the reservoir is heavily loaded by pollutants. (Harney et al., 2013and AbirShib, 2014) reported that the higher values mightbe due to higher decomposition activities and low level of water. However minimum COD are due to low temperature, low decomposition activities and dilution effect.
The nitrate value was fluctuated between 10.5 to 29.5 mg/l. The minimum value of 10.5mg/l was recorded at station III in March 2017 and the maximum of 29.5mg/l at station IV in June 2018. During summer season (April) lesser nitrates are due to algal assimilation and other biochemical mechanisms and nitrate higher values during the monsoon season are due to surface runoff and domestic sewage and especially anthropogenic activities (Shindeet al., 2011) and (Pathak andMankodi, 2013).
Phosphate values obtained in this study ranged between 12.2 to 30.2 mg/l. The minimum value of 12.2 mg/l was recorded at station III in June 2017 and the maximum of 30.2 mg/l was recorded at station IV in February 2018.The high values of phosphate are mainly due to rain, surface water runoff, agriculture runoff, washer man activity, leaching of phosphate fertilizer (BalajiPrasathet al., 2013) and (Pathak and. Mankodi, 2013).
In the present study the correlation coefficient (r) between every parameter pairs in computed by taking the average values as shown in table-7. Correlation coefficient (r) between any two parameters, x & y is calculated for parameter such as water temperature, pH, transparency, total dissolved solids, total hardness, phosphate, nitrate, dissolved oxygen and biological oxygen demand of the Pus Dam water. The degree of line association between any two of the water quality parameters as measured by the simple correlation coefficient (r) is presented in table-7The water temperature has been found to show positive correlations withTotal Solids,Total Dissolved Solids,Total Suspended Solids,pH, BOD,COD,Total Hardness,Chloride,Sulphate,Nitrate and Phosphate.The transparency showed negative correlation with all the parameters except dissolved oxygen, biological oxygen demandand Alkalinity. Furthermore, pH was found negatively correlated with DO and Alkalinity.There was strong positive correlation (r=0.8545) between Hardness and temperature. While chloride showed significant positive correlation with chemical oxygen demand (r=0.808) and total solids (r= 0.8916). Total solids and COD showed highly significant positive correlation (r=0.8643) and Alkalinity and COD showed a highly significant negative correlation(r=-0.653)
ISSN 2348-313X (Print)
International Journal of Life Sciences Research ISSN 2348-3148 (online) Vol. 8, Issue 3, pp: (27-35), Month: July - September 2020, Available at: www.researchpublish.com
Table 3: Mean and Standard error of different physico-chemical parameters at monitoring stationsI andIIof Dilawara Reservoir during 2017
STATION I STATION I I
Parameters Min Max Mean±S.E Min Max Mean±S.E
Temperature(°C) 19 30.5 26.45±1.17 19.5 29 25.66±1.02
Transparency(cm) 14.5 42.5 25.95±2.79 21 52 36.68±3.12
Total Solids(mg/l) 312 460 38.83±15.01 260 360 30.33±8.95 T. D. S(mg/l) 210 342 281.66±12.50 180 262 214±8.59 T. S. S(mg/l) 68 210 116.33±13.16 80 126 103.83±4.47 pH 7.6 8 13 7.6575±0.10 7.6 8.5 7.60±0.14
D O(mg/l) 7.8 8.12 9.23±0.22 8.6 10.5 9.39±0.19 B O D(mg/l) 2.5 4.13 2.98±0.21 1.7 3.4 2.74±0.14 COD(mg/l) 25 55 39.41±2.66 36 66 48.91±2.60
Total Alkalinity 114 222 16.66±10.74 97 198 143±10.16 Total Hardness(mg/l) 120 172 146.91±4.36 110 155 131.83±4.48 Chloride 23.99 42 34.06±2.10 24.99 40.99 32.34±1.80 Sulphate 16.2 28.6 19.99±1.48 14.2 26 17.54±1.18 Nitrate(mg/l) 10.175 25 375 14.84±1.52 10.75 25.425 15.17±1.56 Phosphate(mg/l) 10.275 25.575 17.06±1.38 10.65 25.275 15.33±1.45
Table 4: Mean and standard error of different physico-chemical parameters at monitoring stationsIII and IVofDilawara Reservoir during 2017
STATIONIII
STATIONIV Parameters Min Max Mean±S.E Min Max Mean±S.E
Temperature°C 19 29.5 25.95±1.06 17.5 32.5 26.12±1.30 Transparency(cm) 21 52.5 33.75±2.73 13 44 26.33±2.65
Total Solids(mg/l) 230 368 279.66±12.49 240 332 292.33±8.99 T. D. S(mg/l) 120 222 181.83±9.57 180 260 213.16±8.08 T. S. S(mg/l) 82 122 101.5±4.31 50 122 89.33±7.16 pH 7.8 8.7 7.42±0.17 7.6 8.9 7.89±0.18 D O(mg/l) 8.9 10.5 9.48±0.18 8.11 10.5 9.46±0.21 B O D(mg/l) 1.7 3.5 2.61±0.13 2.5 3.9 3.27±0.13 COD(mg/l) 30 68 51.66±3.38 32 70 54.66±3.64
Total Alkalinity 100 208 135.66±9.81 130 234 174.66±9.60 Total Hardness 105 150 123.41±4.90 63 182 143.66±10.12 Chloride 22.99 40.99 32.50±1.59 23.97 45 37.11±1.77 Sulphate 12.2 26.6 19.07±1.43 14 28.2 19.45±1.43 Nitrate 10.5 25.325 14.72±1.46 10.175 25.075 15.33±1.43 Phosphate 10.125 25.76 15.96±1.51 10.275 22.125 15.05±1.23
Table 5: Mean and Standard error of different physico-chemical parameters at monitoring stationsI andIIof Dilawara Reservoir during 2018
STATIONI
Parameters
Min Max Mean±S.E
STATIONII
Min Max Mean±S.E
Temperature°C 21 31 27.25±1.01 19 33 26.75±1.13
Transparency(cm) 15 41 26.70±2.40 12.5 39 25.29±2.76
Total Solids(mg/l) 360 612 469.58±26.23 332 460 406.16±9.97 T. D. S(mg/l) 231 490 343.91±25.24 230 312 288.25±7.10
ISSN 2348-313X (Print) International Journal of Life Sciences Research ISSN 2348-3148 (online) Vol. 8, Issue 3, pp: (27-35), Month: July - September 2020, Available at: www.researchpublish.com
T. S. S(mg/l) 112 170 136.66±5.001 100 160 128.66±6.27 pH 8 10.2 9.091±0.20 7.8 8.9 8.145±0.21
D O(mg/l) 7.2 9.1 8.11±0.18 7.8 9.9 8.65±0.18 B O D(mg/l) 3.6 8.4 5.69±0.41 3.2 7.6 4.783±0.47 COD(mg/l) 28 60 45.25±2.97 38 65 50.166±2.32
Total Alkalinity 160 270 192.08±28.07 132 190 171.41±5.87
Total Hardness(mg/l) 145 207 175.91±5.79 156 212 175.91±5.47 Chloride 60.58 125 94.41±6.60 54.99 129.98 91.32±7.97 Sulphate 12.3 19.8 15.04±0.89 15.8 28 20.358±1.36 Nitrate 10.47 25.325 16.56±1.50 10.125 20.325 13.831±0.93 Phosphate 11.5 25.575 17.68±1.42 10.57 25.575 15.509±1.37
Table 6: Mean and standard error of different physico-chemical parameters at monitoring stationsIII and IVofDilawara Reservoir during 2018
STATIONIII
STATION IV
Parameters Min Max Mean±S.E Min Max Mean±S.E
Temperature (°C) 20 28.9 26.166±087 18.5 30.9 26.44±1.24 Transparency(cm) 24 53 34.87±2.60 12 48 26.85±2.91 Total Solids(mg/l) 240 375 292.5±12.26 250 355 314.16±9.89
T. D. S(mg/l) 145 245 195.91±9.15 160 280 218.5±11.76 T. S. S(mg/l) 82 122 101.5±4.31 50 122 89.33±7.16 pH 7.3 8.8 7.791±0.14 7.6 8.9 8.32±0.13 D O(mg/l) 8.3 9.5 8.966±0.11 7.8 8.9 8.491±0.10 B O D(mg/l) 2.2 3.8 2.833±0.12 2.9 3.9 3.425±0.09 COD(mg/l) 40 69 56.16±2.55 30 75 57.416±4.02
Total Alkalinity 105 218 143.91±10.15 142 248 186.25±9.66
TotalHardness(mg/l) 120 180 149±6.07 110 195 163.41±7.71 Chloride 24.5 42.5 34.24±1.67 25.7 46.2 39.21±1.76
Sulphate 14.5 29.2 20.76±1.49 15.8 30.2 21.98±1.53 Nitrate 12.5 27.5 17.06±1.41 16.5 29.5 22.22±1.33 Phosphate 11.5 28.4 18.65±1.70 16.5 34.5 24.26±1.82
Table 7: Correlation Coefficient (r) among physic-chemical parameters of Dilawara Reservoir.

ISSN 2348-313X (Print)
International Journal of Life Sciences Research ISSN 2348-3148 (online) Vol. 8, Issue 3, pp: (27-35), Month: July - September 2020, Available at: www.researchpublish.com
2017 JAN -JUNE
JULY-DEC
JAN -JUNE
Figure 1: Water quality index of four monitoring stations during the 2017 and 2018
Temperature(°C) Transparency(cm)
Total Solids(mg/l) T. D. S(mg/l) T. S. S(mg/l) pH D O(mg/l) B O D(mg/l) COD(mg/l) Total Alkalinity Total Hardness(mg/l) Chloride Sulphate Nitrate(mg/l) Phosphate(mg/l)
Figure 2: Graph showing the mean values of physic chemical parameters of four different monitoring stations of the year 2017
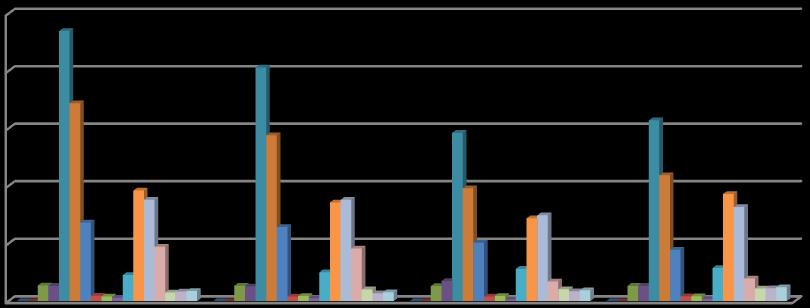
Temperature(°C) Transparency(cm)
Total Solids(mg/l) T. D. S(mg/l) T. S. S(mg/l) pH D O(mg/l) B O D(mg/l) COD(mg/l) Total Alkalinity Total Hardness(mg/l) Chloride Sulphate Nitrate(mg/l) Phosphate(mg/l)
ISSN 2348-313X (Print)
International Journal of Life Sciences Research ISSN 2348-3148 (online) Vol. 8, Issue 3, pp: (27-35), Month: July - September 2020, Available at: www.researchpublish.com
From the above investigations, findings and assessments, it is concluded that water quality of Dilawara Reservoiris influenced by its exploitation and disorders of anthropogenic activities The reservoir water is not suitable for direct consumption but for irrigational and other domestic purposes in terms of most of the physico-chemical parameters analyzed. However, considering that the reservoir is a source of drinking water, the potential impact of the anthropogenic inputs should be minimized. From WQI values, it is suggested that further improvement is required so that full potential of reservoir can be utilized.
[1] AbirShib, (2014).Seasonal variation in Physico-Chemical characteristics of Rudrasagar wetland- A Ramsagar site, Tripura, North East, India.Research Journal of Chemical Sciences. 4(1):31-40.
[2] Adakole, J.A., Abolude, D. S., and Balarabe, M. L.(2012). Proceedings of Taal, p.1373 1382.
[3] Angadi., S. B, Shiddamallayya., N. Patil., P. C. (2005).Limnological studies of Papnash pond, Bidar (Karnataka). J Environ Biol, 26: 213-216. 20.
[4] BalajiPrasath, B., Nandakumar, R., Dineshkurar, S., Ananth, S., Shenbaga Devi, A., Jayalakshmi, T., Raju, P., Thiyagarajan, M. andSanthanam, P. (2013).Seasonal variations in Physico-chemical charactgeristics of Pond and ground water of Thiruchunapalli, India.Journal of Environmental Biology. 34:529-537,
[5] Bhadja, P. and Vaghela, A. (2013).Status of river water quality of Saurashtra, Gujarat, India.Int J AdvBiol Res 3(2): 276-280.
[6] Chigor, V. N., Umoh, V. J., Okuofu, C.A., Ameh, J.B., Igbinosa, E.O., and Okoh, A.I.(2012).Environment Monitoring Assessment,184: p. 3389-3400.
[7] Devaraju, T. M., Venkatesha, M. G. and Singh, S. (2005). Studies on physic-chemical parameters of Muddurlake with reference to suitability for aquaculture. Nat. Environment and pollution technology, 4, pp 287-290. 8.
[8] Gadzama, I. M. K. and Mondo, N. J. (2011).International Journal of Biology and Chemical Science, 5: p. 18981906.
[9] Gangwar, R. K., Khare, P., Singh, J. and Singh, A. P. (2012). Assessment of physicochemical properties of water: River Ramganga at Bareilly, Journal of Chemical and Pharmaceutical Research, 4(9): 4231-4234.
[10] Garg, R. K, Saksena, D. N. and Rao, R. J. (2006). Assessment of physic-chemical water quality of Harsi Reservoir, district Gwalior, Madhya Pradesh, Journal of Ecophysiology and Occupational Health, 6, pp 33-40.
[11] Harney, N. V., Dhamani, A. A. and Andrew, R. J. (2013).Seasonal variations in the Physico-Chemical parameters of Pindavani Ponds of Central India.Science weekly. 1(6):1-8.
[12] Jayakumar, P. N., Jothivel, A., Thimmappaand, and Paul, V. I. (2009).“Physico-chemical characterization of a lentic water body from Tamil Nadu with special reference to its pollution status,” The Ecoscan, vol. 3, no. 1-2, pp. 59–64.
[13] Kale, G. B. and Kutemate, N. B. (2011). Study of physicochemical Parameters of Janunalake near Khamgaon in Buldana district of Maharashtra, J. Curr. Sci., 16 (1): 197-206.
[14] Krishna, R., Ramachandra H.,andShivabasavaiah, M.(2009).Water quality status of fresh water lake (Thallilake), Krishnagiri, Tamilnadu.Indian J. Environ and Ecoplan., 16(1): 103-112.
[15] Mishra, S., Singh, A. L. and D. Tiwary (2014).Studies of Physico-chemical Status of the Ponds at Varanasi Holy City under Anthropogenic Influences.Int. J. Environ. Rese.Devel. 4: 261-268.
[16] Moundiotiya, C., Sisodial, R., Kulshreshtha and Bhatia, A. L. (2004). A Case study of the JamwaRamgarh wetland with special reference to Physico-Chemical properties of Water and its environs.Journal of Environmental Hydrology. 12(24):1- 7.
ISSN 2348-313X (Print) International Journal of Life Sciences Research ISSN 2348-3148 (online) Vol. 8, Issue 3, pp: (27-35), Month: July - September 2020, Available at: www.researchpublish.com
[17] Neelam, P. B. andMankodi, P. C. (2013).Hydrological status of Danteswar pond, Vadodara, Gujarath, India.International Research Journal of Environmental Sciences. 2(1):43-48.
[18] Sawant, P.P., Mali, R. P., Mestry, U. D. and Giri, S.S. ( 2012).Study of Some Physico–Chemical Parameters of Dhamapur Lake Malwan, Sindhudurga District, Maharashtra.Proceeding of International Conference SWRDM.
[19] Shinde, S. E., Pathan, T. S., Raut, K. S. andSonawane, D. L. (2011). Studies on Physico-Chemical parameters and correlation coefficient of Harsool-Savangi dam, District Aurangabad, India. Middle-East Journal of Scientific Research. 8(3):544- 554,
[20] Singh, R. P. and Mathur, P. (2005).Investigation of variations in physicochemical characteristics of a fresh water reservoir of Ajmer city, Rajesthan.Indian Journal Environmental Sciences, 9: 57-61.
[21] Solanki and Pandit, B. R. (2006). Trophic status of lentic waters of ponds water of Vadodara, Gujarat state, India. Inernational Journal of Bioscience Reporter 4: 191-198.
[22] Umerfaruq., M. Q and Solanki., H. A. (2015). Physico-chemical Parameters of Water in Bibi Lake, Ahmedabad, Gujarat, India. J Pollut Eff Cont3: 134.
[23] Usman., L. U.(2016). Effects of Anthropogenic Activities on the Seasonal Variation of Some Physico- Chemical Parameters in Ajiwa Reservoir, Katsina State, Nigeria, Ann. Exp. Biol., 2016, 4 (4): 11-16.
[24] Vandysh, O. I.(2004).“Zooplankton as an indicator of the state of lake ecosystems polluted with mining wastewater in the Kola Peninsula,” Russian Journal of Ecology, vol. 35, no. 2, pp. 110–116.
[25] Vasanthy, M. and Velmurugan, R. (2009). Groundwater quality assessment in and around port Blair Andaman and Nicobar Islands, TheEcoscan, 3(3&4): 247-250.
[26] WHO (2004).guidelines for drinking water quality, 3rd Edition, World Health Organization, Geneva,
[27] WHO (2011).Guidelines for Drinking–Water Quality, 4th ed. p. 532-538.