ISSN 2348-1218 (print)
International Journal of Interdisciplinary Research and Innovations ISSN 2348-1226 (online) Vol. 8, Issue 4, pp: (1-9), Month: October - December 2020, Available at: www.researchpublish.com

ISSN 2348-1218 (print)
International Journal of Interdisciplinary Research and Innovations ISSN 2348-1226 (online) Vol. 8, Issue 4, pp: (1-9), Month: October - December 2020, Available at: www.researchpublish.com
1Department of Biological Sciences
2Department of Physical Sciences
Chuka University, Chuka, Kenya
Abstract: In an effort to attain food security, Kenya has embraced aquaculture as one of its strategies. From 2009, the Government established thousands of fish ponds through the Economic Stimulus Programme (ESP). TharakaNithi County was one of the places covered by the ESP and has 95% of its total ponds under the programme, stocked with the Nile tilapia (Oreochromis niloticus). Physicochemical properties of water influence overall pond productivity and fish yields. The ponds in Tharaka-Nithi County have suffered low production, the average production remaining at <30% of potential, with reports of stunting and frequent fish mortalities. This study aimed to investigate the physicochemical properties of the pond water in the county. Using the randomized complete block design (RCBD), the study area was divided into three zones whereby 27 fish ponds were studied. Chemical analysis was done according to the APHA Standard Methods and data analyzed using the one-way ANOVA. The Statistical Package for the Social Sciences (SPSS) Version 22.0 was used for correlations and regression analyses. Significant differences (p ˂ 0.05) were found in water temperature, dissolved oxygen, transparency, pH and conductivity among ponds in the three zones. Water temperatures, ammonia and PO4-P concentrations were outside the recommended range for optimum O. niloticus growth. Occasionally, DO and pH were outside those suitable for optimum tilapia growth, which could explain the frequent fish deaths and low aquaculture production. Regular monitoring of physicochemical parameters is recommended. These findings will be used by relevant government agencies and fish farmers to enhance fish production.
Keywords: Physicochemical properties; Aquaculture; Fish ponds; ESP.
It is the goal of every country to attain food security in order to realize socioeconomic development. Food security is defined as the state where there is enough food for all people [1]. Kenya is a developing country that is still striving to overcome food insecurity [2] where 24% of its people are undernourished while 26% of the children below the age of 5 years experience stunted growth [3]. Technically, food security should not be considered only in terms of the quantity of the food eaten but of its quality as well, supplying adequate nutrients such as proteins and a variety of micronutrients [5], [6].
In 2009 the Government of Kenya launched countrywide campaigns to promote fish farming. These campaigns saw the total fish pond area increase by more than a hundred percent, with the Nile tilapia (Oreochromis niloticus) as the main species constituting 75% of the total fish cultured [2]. By 2013, the government had established more than 3,000 fish ponds throughout the country under the Economic Stimulus Programme (ESP). The campaign was driven by the need to step up food security by increasing production of fish, which has been recognized as an important source of affordable
ISSN 2348-1218 (print)
International Journal of Interdisciplinary Research and Innovations ISSN 2348-1226 (online) Vol. 8, Issue 4, pp: (1-9), Month: October - December 2020, Available at: www.researchpublish.com
and high-quality animal protein [7]. In the initial phase of the project, 200 ponds were introduced in each of the 140 administrative constituencies and in a second phase, an additional 100 ponds were established in each constituency [8] Tharaka-Nithi County, at the time comprising three constituencies, benefited with a total of 900 ponds.
A preliminary survey of the ponds showed that over 95% of the fish farming existing in the Tharaka-Nithi County were those initiated through the ESP.For optimal production of fish in ponds, the physicochemical and biological conditions of the pond water must be well understood as production depends entirely on them [9]. The water itself offers the natural support in which all the processes such as swimming, breeding, feeding and excretion by the fish take place [7]. Besides, every living organism has a range of water quality ranges in which it thrives and any sharp deviation from that range causes undesirable functions by the body [10]. Thus, good water quality of the ponds is a vital aspect in fish production and survival. With the need to increase fish production, it is imperative that pond management be based on the understanding of pond water physicochemical and biological properties. Some of the most important physicochemical factors influencing fish production include water temperature, dissolved oxygen (DO), light penetration, turbidity, alkalinity, conductivity, pH and ammonia [11]. These parameters cannot be ignored where a healthful aquatic environment is expected in order to produce adequate fish in ponds [9] This study, therefore, sought to understand the physicochemical conditions of the pond water of the fish ponds in Tharaka-NithiCountyin order to contribute toward better pond management for increased aquaculture production.
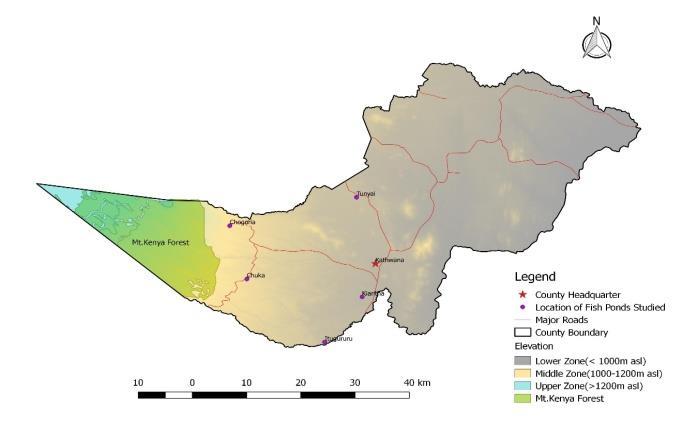
The study was carried out in Tharaka-Nithi County, which is about 175 km north-east of Nairobi. It lies between the latitudes000 07'and 000 26'South and between longitudes 37019' and 37046' East. It borders the Meru County in the North and North-East, Embu County in the South and South-West and Kitui County in the East and South-East [12]. Its western boundary is marked by the Mount Kenya Forest, where a number of large rivers that traverse the county have their source. These rivers empty into River Tana in the lower part of the county. The County has a bi-modal rainfall pattern with the short rains falling during the March to May and the long rains in October to December. The annual average rainfall received ranges between 1000-1200 mm in the western part and 500-750 in the south-eastern and eastern parts [13]. The lower areas of the county are classified as semi-arid. The map of the county is shown in Fig. 1.
The randomized complete block design (RCBD) was used in this study. Blocking of ponds was based on zones whereby the study area was divided into three zones that were designated as the Upper Zone, Middle Zone and Lower Zone (Fig. 2).
Fig. 1. Map of Tharaka-Nithi County (Source: Galaxy Geo-Consulting Inc., 2020. Map scale 1: 500000; Created using Q GIS. Version 2.14)
Fig.2: Thematic map of the location and spatial distribution of fish ponds studied in Tharaka-Nithi County. A1=Chuka; A2=Chogoria; B=Itungururu; C1=Tunyai North; C2=Tunyai South; C3=Kiaritha (Source: Galaxy Geo-Consulting Inc., 2020.Map scale 1: 500000 (Created using Q GIS. version 2.14)

ISSN 2348-1218 (print)
International Journal of Interdisciplinary Research and Innovations ISSN 2348-1226 (online)
Vol. 8, Issue 4, pp: (1-9), Month: October - December 2020, Available at: www.researchpublish.com
The Upper Zone comprised the area around of Chuka Town in the south and Chogoria area in the north. The Chuka Town area was designated A1 while the Chogoria area was designated A2. The Middle Zone was the Itugururu area, designated B, with its location in the south of the county. The Lower Zone comprised the Tunyai and the Kiaritha areas in the north and south of the country, respectively. The Tunyai area was divided into Tunyai North (C1) and Tunyai South (C2). From the Upper Zone, 6 fish ponds were studied in the Chuka Town area and 6 in the Chogoria area. In the Middle Zone (B), 3 were studied. From the Lower Zone, 3 ponds were studied in Tunyai North, 3 in Tunyai South and 6 in Kiaritha. Thus, a total of 27 fish ponds were studied.
Water samples were collected on a monthly basis from February 2016 to January 2017, covering a period of 12 months. After they were collected, samples were labelled clearly with the sampling site (pond), date and time of sampling. In each case, duplicate samples were obtained from three different points of the fish pond i.e. close to either edge and in the middle of the pond. Water samples were collected using a horizontal, opaque, plastic 2-litre Van Dorn sampler at 25 cm depth according to APHA [14].Temperature, pH, conductivity, turbidity and dissolved oxygen were determined in the field at 0.2 m intervals from the water surface towards the bottom. Measurements were made using an electronic multimeter readable to 0.02 units. Water transparency or light penetration was measured using a Secchi disc with a 20-cm in diameter and bearing alternate black and white quadrants. The mean values were then calculated and recorded for each of the parameters
Determination of NO3-N was done by the sodium salicylate method, PO4-P by the stannous chloride method, ammonia by the method involving the use of EDTA reagent according to APHA [14]. Determination of TDS and alkalinity, too, was according to APHA [14]. Chlorophyll a was determined according to the method by Nush [15] Data were analysed using the one-way analysis of variance (ANOVA). The correlation coefficients and regression between various parameters were determined using the Statistical Package for the Social Sciences (SPSS) Version 22.0 computer software.
Pond water temperatures ranged from 22.83oC in July 2016 in the Chogoria area within the Upper Zone to 31.59oC in September 2016 among the ponds in the Lower Zone at Kiaritha, a range of 8.76oC. They exhibited two peaks, one in February and another in September, both dry months. They tended to be higher during the dry season and lower during the wet season. In all three zones, the February peak was followed by a gradual decline through subsequent months, reaching their lowest in July. After this low, water temperatures rose again gradually, reaching their maxima in September, a hot month. Another decline followed during the wet season in October in the wet season. They rose again to reach another peak in January 2017. Variations in water temperature among ponds in the three zones of the study area are shown in Fig.2.
(A1) CHOGORIA (A2) 26 28 30 32 34 Water Temp. ( o C) PERIOD
TUNYAI NORTH (C1) TUNYAI SOUTH (C2) KIARITHA (C3)
Fig. 2. Variation in water temperatures among fish ponds in the Upper Zone (Chuka and Chogoria) and the Lower Zone (Tunyai North, Tunyai South and Kiaritha). Vertical bars represent standard error.
Temperatures varied between ponds in the different locations of the zones (p = 0.004, F = 6.406). Throughout the study period, within the Upper Zone, water temperatures of ponds within the Chuka area were generally higher than those of ponds within the Chogoria area Within the Lower Zone, temperatures of ponds within Tunyai North differed from those of Tunyai South and Kiaritha areas. Higher temperatures within the Lower Zone were observed in ponds within the Kiaritha area, predominantly from May to June. During the month of July, they declined in these three locations with very slight differences among them. From August to September, temperatures rose considerably with ponds in the Kiaritha area recording higher values than those in Tunyai North and Tunyai South. After a slight decline in October, there was a steady rise during subsequent months through to January 2017.
ISSN 2348-1218 (print)
International Journal of Interdisciplinary Research and Innovations ISSN 2348-1226 (online) Vol. 8, Issue 4, pp: (1-9), Month: October - December 2020, Available at: www.researchpublish.com
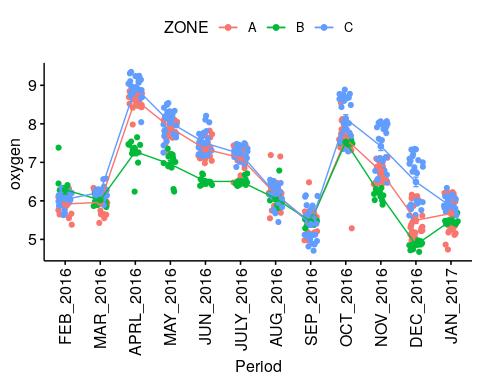
Dissolved oxygen (DO) varied from 4.68 mg l-1 in December at Itugururu (B) to 9.35 mg l-1 at Kiaritha (C3) in April, representing a range of 4.76 mg l-1. Mean monthly concentrations for ponds in all three zones are shown in Fig. 3. Water transparency varied between 16.2 cm and 34.4 cm, a range of 18 cm throughout the study period. The mean transparency for the entire study area was 24.37±5.16 cm. The lowest (16.2 cm) was recorded in ponds at Itugururu (Middle Zone) in April 2016 while the highest (34.4 cm) was recorded at Tunyai South (C2) within the Lower Zone in January 2017. The mean Secchi depths for fish ponds in the three zones are shown in Fig. 4.
ZONE A ZONE B ZONE C
15 20 25 30 35 Secchi Depth (cm ) PERIOD
Fig.3. Basic line plots of means for dissolved oxygen among the fish ponds by zones
Fig.4. Mean Transparency (Secchi depths) of the pond water in the three zones
The curves in Fig. 4 show that water transparency tended to decline during the wet season and increase during the dry season. In all three zones, three peaks were observed. Generally, transparency was high (above 27 cm) in February 2016 but declined to levels below 18 cm in April. It rose again in September during the dry season and declined in October during the wet season. The highest water transparency was recorded in ponds within the Lower Zone (C) while the lowest was in the Upper Zone (A). The ANOVA analysis of transparency data yielded a p value of 0.026 and an F value of 1.374.
Water pH among the study ponds ranged from 5.21 to 7.96. The lowest value was recorded in March 2016 among fish ponds in the Tunyai South area (Lower Zone) while the highest was among fish ponds in the Chogoria area in October. Values rose during the wet season and declined during the dry season. Within the Upper Zone for instance, pH values were lowest in February among fish ponds in Chogoria. They rose markedly in both Chuka and Chogoria areas through April to July. Among ponds in the Lower Zone (C), pH ranged from 5.21 to 6.63. The former value was recorded for the ponds in Tunyai North in March 2016 while the latter was recorded for ponds in Kiaritha in November. Overall, within the period of study, there were observed significant differences in water pH among ponds in the Upper, Middle and Lower Zones
(p ˂ 0.001, F = 6.406).
Mean electrical conductivity among the fish ponds varied between 135.77 ± 1.59 and 164.52± 1.42 µS cm-1. The lowest mean value was recorded for fish ponds within the Upper Zone in the Chuka area (A1) in May 2016 while the highest was in ponds within the Lower Zone at Kiaritha (C3) in May the same year. In the Upper and Lower Zones, there were peaks in February, September 2026 and in January 2017, all dry months. Low conductivity values in these two zones occurred in April and October during the rainy season. The highest mean conductivity of pond water in the Middle Zone (B) was 143.77± 1.62 µS cm-1 although there was a slight rise in May. The ANOVA analysis showed significant differences
(p˂ 0.001, F = 170.426) in electrical conductivity of among pond of pond water among the three zones.
Nitrate-nitrogen (NO3-N) concentration in pond water varied from 0.085 mg l-1 to 2.62 mg l-1. The lowest mean concentration was recorded for ponds in the Upper Zone in the Chuka Town area (A1) during the dry season in September 2016 while the highest was for the ponds in the Lower Zone within Kiaritha (C3) in October during the rainy season. Two peaks were observed, one during April-June and another during October-December. There were clearly reduced concentration levels in all three zones during February-March and August-September, which were dry periods. In the Upper Zone, higher concentrations were observed in ponds within the Chuka area (A1) than in those within the Chogoria area (A2). An exception to this was observed in three instances (July and August 2016 and January 2017) during which time ponds in the Chogoria area recorded higher mean values. In the Lower Zone, NO3-N concentration was higher in fish ponds within the Kiaritha area (C3) than in those within the Tunyai North (C1) and Tunyai South (C2). In all three
ISSN 2348-1218 (print)
International Journal of Interdisciplinary Research and Innovations ISSN 2348-1226 (online)
Vol. 8, Issue 4, pp: (1-9), Month: October - December 2020, Available at: www.researchpublish.com
locations of the Lower Zone, concentrations showed a marked increase during the periods April-May and OctoberNovember, during rainy seasons. The analysis of data on nitrate concentration showed no significant differences among the zones (p= 0.97, F = 0.029). The variation in nitrate concentration in the pond water among the zones is shown in Fig. 5.
Phosphate-phosphorus (PO4-P) concentration among fish ponds varied from 0.06 mg l-1 to 1.98 mg l-1. The lower value was recorded in ponds around the Kiaritha area (C3) in January 2017 while the higher was recorded in those in the Chuka area (A1) in August 2016. Variation in mean PO4-P concentration in ponds within the zones is shown in Fig. 6.
1 1.4 1.8 2.2 2.6 NitrateN (mg l1 )
ZONE A ZONE B ZONE C 0 0.4 0.8 1.2 PhosphateP (mg l1)
PERIOD
PERIOD
Fig. 5. Variation in nitrate-nitrogen concentrations of fish pond water Fig. 6. Variation in phosphate-phosphorus concentrations of f fish pond water
In the Upper Zone, PO4-P exhibited three peaks during the study period. It rose from a low of 0.04 ± 0.28 mgl-1 in February 2016, reaching the first peak (0.65 ± 0.28 mg l-1) in April. A drop was observed in July, followed by a sharp rise to the second peak (1.12 mg l-1) in August. A drop occurred in September and October but in November, concentration reached another peak (0.79 ± 0.28 mg l-1) This general pattern was observed among ponds in the Middle Zone at Itugururu (B). In the Lower Zone, PO4-P concentration showed two peaks, one in April and a second one in November 2016. Within the Upper Zone, concentration was mostly higher in ponds within the Chuka area (A1) than those in the Chogoria area (A2) except in May 2016. A rather sharp rise was observed in ponds within the Chuka area between July and August 2016 when values rose from 0.15 ± 0.17 mgl-1 to 1.98 ± 0.17 mgl-1. This change was much higher (0.15 ± 0.17 mgl-1 to 0.25 ± 0.17 mg l-1) than that recorded for ponds within the Chuka area during the same month. Analysis of variance gave values of p = 0.43, F = 0.859.
Ammonia concentration ranged between 0.02 and 0.26 mg l-1. There were fluctuations in in all three zones but the magnitude of variation was highest among ponds in the Lower Zone (C). For instance, here concentration rose sharply from 0.065 ± 0.05 mg l-1 in March 2016 to 0.257 ± 0.05 mg l-1 the following month, a difference of 0.192 mg l-1. Another sharp variation occurred between June and July 2016, where it dropped from 0.193 to 0.02 mg l-1, a decrease by 0.173 mg l-1. The variation of concentration among fish ponds in the three zones is shown in Fig.7.
The lowest alkalinity measured was 35 mg CaCO3 l-1, recorded in a pond in Tunyai North (C1, Lower Zone) in September 2016. The highest value of (118 mg CaCO3 l-1) was recorded in April 2016 in a pond within Chuka (A1, Upper Zone). The variation in pond water alkalinity during the study period is shown in Fig. 8.
ZONE A ZONE B ZONE C 0 0.1 0.2 0.3 Ammonia (mg l1 )
A B C 20 60 100 140 ALK ( mg C a CO 3 l1 )
PERIOD
Fig.7. Variation in ammonia concentration of water in the fish ponds .Vertical bars represent standard error
ZONE A ZONE B ZONE C
PERIOD
Fig.8. Variation in alkalinity of water in the fish ponds Vertical bars represent standard error
ISSN 2348-1218 (print)
International Journal of Interdisciplinary Research and Innovations ISSN 2348-1226 (online) Vol. 8, Issue 4, pp: (1-9), Month: October - December 2020, Available at: www.researchpublish.com
There was less variation in ammonia concentration among the ponds in Zones A and B as seen from the curves. Analysis of variance gave the values p = 0.083, F = 2.680. Alkalinity was mainly higher in the Upper Zone than in the Middle and Lower Zones. It was higher during the rainy season and declined during the dry season. Two peaks were observed, the first in April and the other in October, both wet months. Alkalinity was insignificantly different among fish ponds in the three zones (p = 0.065, F = 2.965).
Chlorophyll a concentration varied between 4.39 mg l-1in Tunyai South (C2) during the dry season (September) and 11.64 mgl-1 in Tunyai North (C1) during the rainy season (April), with a mean of 6-7±1.29 mg l-1. Changes in the chlorophyll a levels through the study period are shown in Fig. 9.
ZONE A ZONE B ZONE C0 2 4 6 8 10
PERIOD
There were two peaks, one observed in April 2016 and another in November the same year, both of which were during the rainy seasons. Levels rose from 6.52 mg l-1in February 2016, reaching their maximum (8.68 mg l-1) in April before dropping again during the dry months (May to September). The second peak began in October through December, values falling again in January 2017, a dry month.
Mean TDS in pond water varied from 101.76 mg l-1 in January 2017 among fish ponds in the Upper Zones (Chogoria, A2) to 178.67 mg l-1 in November 2016 among ponds in the Lower Zone (Kiaritha, C3). Higher TDS values were observed in all three zones during April and November 2016, during the rainy season while the lowest were recorded in February and January among ponds in Zones A and C. Ponds within Zone B recorded the lowest TDS in January 2016. The analysis of variance gave a p value of 0.651 and an F value of 0.435.
Analyses of the correlation between different physicochemical parameters showed that several of them had significant correlation. For instance, electrical conductivity and pH showed a Pearson correlation coefficient value of -0.71. That between water temperature and DO was -0.83. Other parameters that showed strong significant correlation included water pH and alkalinity (r = 0.553), TDS and water transparency (r = -0.650), chlorophyll a and transparency (-0.83) and TDS and alkalinity (r =-0.99). The results are summarized in Table 2.
TABLE 2. Summary of Pearson correlation coefficient (r) between different physicochemical variables of pond water
Parameter/r DO Secchi pH Conductivity TDS Alkalinity DO 0.258* 0.200 0.458** 0.752** pH - 0.711** 0.553 Temperature -0.83 Conductivity 0.994 -0.129 TDS 0.204 0.516 Alkalinity 0.553 Secchi -0.744 - 0.407** -0.650 ** -0.683 ** NO3-N 0.555 0.312** -0.036 0.492** 0.546 PO4-P 0.168 0.267* -0.223 0.248* 0.255* Ammonia Chl. a 0.301** -0.83** 0.003 -0.049 0.188 0.556 0.212 *Correlation is significant at the 0.05 level (2-tailed). **Correlation is significant at the 0.01 level (2-tailed).
ISSN 2348-1218 (print)
International Journal of Interdisciplinary Research and Innovations ISSN 2348-1226 (online) Vol. 8, Issue 4, pp: (1-9), Month: October - December 2020, Available at: www.researchpublish.com
Significant variation in water temperature occurred among fish ponds in the three zones of the study area. Various authors have suggested the suitable water temperature range for optimum growth of Oreochromis niloticus. For instance, DeWalle et al [16] suggested a range of 25-27oC, El-Sayed et al. [17] suggested 24-30oC while Azaza et al. [18] recommended a range of 27-30oC for optimum growth of O. niloticus All these recommended ranges are clearly different from that found (22.83-31.59oC) in the study ponds. This, therefore,shows that O.niloticus growing in the fish ponds in Tharaka-Nithi County were growing in temperature conditions outside those considered the normal range for optimum growth. Such suboptimal temperature conditions may be a contributing factor to the general stunting of the fish reported in the study area. This view is supported by the study by Mengitsu et al. [19] who noted that the optimal growth performance for O. niloticus was at 27-32oC, which was the temperature range supporting optimal feed conversion ratio.The authors concluded that rearing O. niloticus outside the optimal temperature range results in a negative impact on production.
In the ponds under study, dissolved oxygen levels were occasionally lower than the optimum for the culture of O. niloticus. The lowest DO concentration measured (4.68 mg l-) fell below that given by various researchers as the most favourable for optimum growth. Mengistu et al. [19] for instance, recommended a DO level of not less than 5.0 mg l-1 as necessary for optimum O. niloticus growth. Abdel-Tawwab and Monier[20] reported optimum DO level to be in the magnitude of 6.0 to 6.5 mg l-1. Tran et al. [21] reported that DO levels as low as 3.5 mg l-1 were adequate to cause hypoxic conditions for O. niloticus, which consequently resulted in a significant reduction in the nutrient digestibility. Culture fish growing in such an environment would not be expected to exhibit normal growth as they would be stunted, which seems to be the case in the study ponds.
The considerably low Secchi disc visibility (transparency) during the rainy season was due to increased turbidity caused by silt, plant material and an increase in phytoplankton. An increase in turbidity, regardless of its origin, invariably causes a decline in water transparency. The high transparency observed during the dry season was associated with and influenced by, other physicochemical factors within the ponds. Examples were TDS and chlorophyll a that recorded low values during the dry season. The occurrence of the lowest Chlorophyll a value in September and the lowest TDS values in January influenced water transparency as shown by the correlations (r = -0.83 and -0.650, respectively) between them and transparency.
The pH values of the fish ponds in the Tharaka-Nithi County can be considered as being within the safe range for fish survival although not within the optimum range. The fish continue to live in these suboptimal conditions without exhibiting any obvious problems like daily mortality. Makori et al. [22] reported that O. niloticus can continue growing in suboptimal conditions of pH and conductivity and observed that under such circumstances, growth was negatively affected. The inevitable consequence of hampered fish growth is reduced overall aquaculture production.
Electrical conductivity of pond water (135.77 ± 1.59 to 164.52 ± 1.42µS cm -1) was a range considered safe for aquaculture production. Various previous workers have recorded varying levels of electrical conductivity in fish ponds and concluded that they were within safe ranges. For instance, Makori et al. [22] reported a high growth rate of O. niloticus in pond water with a lower conductivity (77 µS cm-1) than that reported in the present study. Danesh et al. [23] reported conductivity of up to 450 µS cm-1 as being within the safe and suitable range for optimum O. niloticus growth. Thus, given the very wide range of safe electrical conductivity, it can be stated that this parameter may not be considered a source of threat to fish production in the fish ponds within Tharaka-Nithi County.
Alkalinity values recorded (35- 118 mg l-1 CaCO3) among the ponds were within the normal range for optimum growth of O. niloticus. The work by Wurts and Durborow [24] showed that alkalinity levels of 20 mg l-1 CaCO3 or more were essential for pond productivity. TDS values encountered in this study (101.76-178.67 mg l-1) were favourable for aquaculture in general as they were much lower than those that should not be exceeded. Scannell and Jacobs [25] recommended a maximum of 1000 mg l-1 while James [26] recommended 400 mg l-1. Low TDS is usually an indication of good water quality with regard to dissolved solids. Results from this study, therefore,showed that TDS was in no way negatively impacting fish production in Tharaka-Nithi County during the period of study. There were no significant differences (p 0.05) in NO3-N and PO4-P concentrations among the ponds within the three zones. Previous research has examined the effect of NO3-N in freshwater culture fish. The early work by Boyd[27] established that the suitable concentrations for aquaculture in general were of 0.2-10 mg l-1. Focusing specifically on O.
ISSN 2348-1218 (print)
International Journal of Interdisciplinary Research and Innovations ISSN 2348-1226 (online)
Vol. 8, Issue 4, pp: (1-9), Month: October - December 2020, Available at: www.researchpublish.com
niloticus, however, in a later study, the findings by Monsees [28] were that this species exhibited optimum growth under NO3-N concentrations of 0-500 mg l-1. The NO3-N concentrations of 0.185-2.295 mg l-1 measured among ponds in our study were thus within the safe range for optimum growth of O. niloticus. This was not the case with PO4-P concentration, however. The range of 0.04-1.98 mg l-1measured in this study exceeded the normal range for healthy O. niloticus production. Bhatnagar et al. [9] recommended a PO4-P concentration range of 0.01-0.03 mg l-1 and pointed out that concentrations higher than this would lead to stress upon the fish. Santos et al.[29] gave the acceptable maximum concentration of PO4-P for O. niloticus culture as 0.025 mg l-1. Therefore, concentrations of PO4-P in the study ponds were not within the range suitable for O. niloticus growth and thus contribute to reduced fish production in Tharaka-Nithi County.
A Number of physicochemical properties of pond water studied were found to differ statistically significantly among the ponds in the Upper, Middle and Lower Zones of the study area. They included temperature, DO, pH and conductivity. The water temperature range was outside that suitable for optimum O. niloticus growth.Concentrations of DO were found to occasionally fall below the level that would allow optimum growth of the culture species.Concentrations of ammonia and PO4-P in the pond water were found to be higher than those suitable for the optimum growth of this fish species Thus, the combination of low oxygenand high ammonia may be responsible for the fish mortalities frequently reported in the study ponds. High PO4-P, on the other hand, could explain the stunting of the fish resulting from stress that would lead to a reduction in feeding and consequently, to a reduction in growth.All other physicochemical parameters in the TharakaNithi fish ponds were within the range that supports optimum growth forO. niloticus, the culture species.
Financial support for this research was from Chuka University through the university’s Internal Research Fund. We therefore express our heartfelt gratitude to the University Management through its CEO, Prof E. Njoka. We are also thankful to F. Ogola, J. Makau, E. Livaha and A. Mwangi for assistance in the field and the laboratory.
[1] Food and Agriculture Organization FAO (2000). The state of world fisheries and aquaculture. Rome, (Italy): Fisheries Department, Rome, Italy.
[2] Republic of Kenya (2017). Ministry of Health national guidelines for healthy diets and physical activity. Nairobi. 86 pp.
[3] Food and Agriculture Organization FAO (2018). The state of food security and nutrition in the world 2018. Building climate resilience for food security and nutrition. Rome, Italy.
[4] Kennedy G, Ballard T and Dop M (2011). Guidelines for measuring household and individual dietary diversity FAO, Rome. 53 pp.
[5] Smith LC and Subandoro A (2007). Measuring food security in practice. IFPRI, Washington DC. 147 pp.
[6] Republic of Kenya (2011). National aquaculture policy. Ministry of Fisheries and Livestock Development, Nairobi.
[7] Bronmark C and Hansson LA (2005). The biology of lakes and ponds Oxford University Press, Oxford, pp 285.
[8] Food and Agriculture Organization FAO (2016). Fishery and aquaculture country profiles: the Republic of Kenya. Rome, Italy, 25 pp.
[9] Bhatnagar A and Devi P (2013). Water quality guidelines for the management of pond fish culture. Int. J. Env. Sc. 3 (6): 1980-2009
[10] Kiran BR (2010). Physico-chemical characteristics of fish ponds of Bhadra Project atKarnataka, RJCABP, Vol.3, 671-676.
[11] Imsland AK and Jonassen TM (2003). Growth and age at first maturity in turbot and halibut reared under different photoperiods. Aquac Int.; 11:463–475
[12] Republic of Kenya (2013). County Integrated Development Plan 2013-2017 Tharaka-Nithi County. Government of Kenya, Nairobi. 291 pp.
ISSN 2348-1218 (print) International Journal of Interdisciplinary Research and Innovations ISSN 2348-1226 (online) Vol. 8, Issue 4, pp: (1-9), Month: October - December 2020, Available at: www.researchpublish.com
[13] Ministry of Agriculture, Livestock and Fisheries MoALF (2017). Climate risk profile for Tharaka-Nithi County. Kenya county climate risk profile series, Nairobi, Kenya.
[14] APHA (2005). Standard methods for the examination of water and wastewater.21stedition, American Public Health Association/American Water Works Association/Water Environment Federation, Washington DC.
[15]Nusch EA (1980). Comparison of different methods for chlorophyll and phaeopigment determination Archiv fur Hydrobiologie, 14, 14-36.
[16] DeWalle DR, Swistock BR and Sharpe WE (2011). Episodic flow–duration analysis: a method of assessing toxic exposure of brook trout (Salvelinus fontinalis) to episodic increases in aluminium. Canadian Journal of Fisheries and Aquatic Sciences, 1995, 52(4): 816-827.
[17] El-Sayed AM and Kawanna M (2008).Optimum water temperature boosts the growth performance of Nile tilapia (Oreochromis niloticus) fry reared in a recycling system. Aquaculture Research, 39, 670-672.
[18] Azaza MS, Dhraief MN and Kraiem MM (2018). Effects of water temperature on growth and sex ratio of juvenile Nile tilapia Oreochromis niloticus (Linnaeus) reared in geothermal waters in Southern Tunisia. J Therm Biol.,33(2):98–105.
[19] El- Sayed AM, EI-Ghobashy A and Al-Amoudi M (1996). Effects of pond depth and water temperature on the growth, mortality and body composition of Nile tilapia,Oreochromis niloticus (L.). Aquaculture Research, 27:681687.
[20] Mengistu SB, Mulder HA, Benzie JAH and Komen H (2019). A systematic literature review of the major factors causing yield gap by affecting growth, feed conversion ratio and survival in Nile tilapia (Oreochromis niloticus). Rev. Aquac. Willey, 524–541
[21] Abdel-Tawwab M, Hagras AE, Elbaghdady HAM and Monier MN (2015). Effects of dissolved oxygen and fish size on Nile tilapia, Oreochromis niloticus (L.): Growth performance, whole-body composition, and innate immunity. Aquaculture International. Springer, 23:1261–1274.
[22] Tran K, Dinn TN, Thinh NH and Roem A (2016). Interaction between dissolved oxygen concentration and diet composition on growth, digestibility and intestinal health of Nile tilapia (Oreochromis niloticus). Aquaculture. Elsevier, 462: 101-108
[23] Makori AJ, Abuom PO, Kapiyo R, Anyona DN and Dida GO (2017). Effects of water physico-chemical parameters on tilapia (Oreochromis niloticus) growth in earthen ponds in Teso North Sub-county, Busia County. Fisheries and aquatic sciences. Springer, Vol. 20, 30.https://doi.org/10.1186/s41240-017-0075-7.
[24] Danesh KG, KarthikM and Rajakumar R (2017). Study of seasonal water quality assessment and fish pond conservation in Thanjavur, Tamil Nadu, India. Journal of Entomology and Zoology Studies. Vol. 5(4): 1232-1238
[25] WurtsWAand Durborow RM(1992). Interactions of pH, carbon dioxide, alkalinity and hardness in fish ponds. SIRAC Publ. No.464: 1-3.
[26] Scannell PW and Jacobs LL (2001). Effects of total dissolved solids on aquatic organisms. Alaska department of fish and game division of habitat and restoration, No. 01-06, 62 pp
[27] James ME (2000). Water quality and recalculating aquaculture systems. Aquaculture systems technologies, LLC. New Orleans, LA. 16- 17
[28] Boyd CE. (1988). Water quality for pond aquaculture. Res. Dev. No.43. Int. Cent. Aquac. & Aquat. Env. Alabama Agric. Exper. Sta., Auburn University, Alabama., USA. 37 pp
[29] Monsees H, Klatt L,Kloas W and Wuertz S (2016). Chronic exposure to nitrate significantly reduces growth and affects the health status of juvenile Nile tilapia (Oreochromis niloticus L.) in recirculating aquaculture systems Aquaculture Research. Vol. 48(7):3482-3492
[30] Santos DMS, Cruz CF, Pereira DP, Alves LMC and Moraes FR (2012). Microbiological water quality and gill histopathology of fish from fish farming in Itapecuru-Mirim County, Maranhao State. Acta Scientarium. Biological Sciences. 2012; 34(2):199-205.