ISSN 2348-313X (Print)
International Journal of Life Sciences Research ISSN 2348-3148 (online)
Vol. 9, Issue 1, pp: (47-66), Month: January - March 2021, Available at: www.researchpublish.com

ISSN 2348-313X (Print)
International Journal of Life Sciences Research ISSN 2348-3148 (online)
Vol. 9, Issue 1, pp: (47-66), Month: January - March 2021, Available at: www.researchpublish.com
Department of Biotechnology, School of Life Sciences, Pondicherry University, Pondicherry 605014, India.
*Corresponding author: varul18@gmail.com (V. Arul)
Abstract: Biosurfactant-producing bacteria were isolated from transformer oil-contaminated soil. The strain was identified as Pseudomonas aeruginosa PU1 based on its molecular characterization by 16S rRNA gene sequencing. The extraction of biosurfactant was done by acid precipitation method using 2 N hydrochloric acid and further purified by silica-gel column chromatography. The highest rhamnolipid biosurfactant production (8.92 ± 0.08 g/L) was obtained using molasses (6%, w/v) and ammonium nitrate (5%, w/v). The purified biosurfactant showed a reduction in surface tension of water from 70.23 mN/m to 29.77 mN/m at a concentration of 30 mg/L. The degradation of various oils by P. aeruginosa PU1 through gravimetric method showed maximum degradation of used transformer oil (95.55 ± 2.70%) followed by diesel oil (94.36 ± 1.86%), kerosene (76.17 ± 1.62%) and petroleum oil (66.03 ± 2.91%) in 10 days of the incubation period. The functional groups were characterized by Fourier transform infrared spectroscopy (FT-IR) and proton nuclear magnetic resonance (1H NMR). The liquid chromatography-mass spectrometry (LC-MS) analysis showed six different rhamnolipid congeners with pseudomolecular ions (m/z) of 305, 361, 451, 505, 532, and 621. X-ray diffraction (XRD) analysis and the thermal analysis showed crystalline nature and thermal stability of the biosurfactant. The stability study of the biosurfactant reveals that the emulsifying activity was much stable at various ranges of temperature (4–120 ○C), pH (2–12), and NaCl concentration (2–10%, w/v) even on the 7th day. The purified biosurfactant PU1 was found to be effective in oil recovery and showed 68.53 ± 3.07% of oil recovery in the sand pack column under saline condition, which was higher than anionic surfactant sodium dodecyl sulfate (SDS). The physico-chemical properties and the stability studies of the biosurfactant suggested that it has enormous potential in oil recovery in the soil contaminated with the oils.
Keywords: Pseudomonas aeruginosa PU1, biosurfactant, rhamnolipid, emulsifying activity, oil recovery.
Biosurfactants derived from the microbes are heterogeneous in nature, surface-active agents, and can reduce surface as well as interfacial tension. Biosurfactants are composed of polar and non-polar moieties that include glycolipids, lipopeptides, and phospholipids, etc (Banat et al., 2000). Currently, numerous types of biosurfactants have been characterized. Among which the most extensively studied biosurfactant is rhamnolipid because it offers a wide range of environmental and industrial applications. Rhamnolipids are glycolipid in nature with lower molecular weight compounds, composed of hydrophilic rhamnose group and hydrophobic β-hydroxy fatty acids which are linked by glycosidic bonds (Rudden et al., 2005). Pseudomonas sp. is one of the most abundant isolated bacteria having the potential of degrading polycyclic aromatic hydrocarbons (PAHs) which are known to be organic pollutants, mutagens, and carcinogens (Bezza et al., 2006; Varjani and Upasani, 2016a; Varjani and Upasani, 2016b).
ISSN 2348-313X (Print)
International Journal of Life Sciences Research ISSN 2348-3148 (online)
Vol. 9, Issue 1, pp: (47-66), Month: January - March 2021, Available at: www.researchpublish.com
Biosurfactants are commonly known as biologically originates surfactants, considered more advantageous over their chemical counterparts (chemical surfactants) due to their spectacular properties like higher biodegradability and lower toxicity as well as stability towards extreme pH, temperature, and salinity (Chandankere et al., 2014). Due to these vibrant properties, biosurfactants are applied in a variety of applications like bioremediation of soils polluted with PAHs, microbial-enhanced oil recovery (MEOR), the fundamental constituent of cleansers, food products, cosmetics, pharmaceuticals as well as microbial fuel cell preparation. The surfactant properties of rhamnolipid depend upon media composition, nature of the microbial strain, and fermentation conditions (Banat et al., 2000; Varjani and Upasani, 2016b; Chandankere et al., 2014; Jain et al., 2012; Zheng et al., 2015).
Surfactants are widely used in the degradation of crude oil sludge, as it possesses the ability to increase solubility, reducing surface tension, wettability, and foaming capacity (He et al., 2020). There is an incrementing interest in the possible use of biosurfactants in oil recovery and various other processes such as managing oil spills, crude oil reservoirs, cleaning of pipelines used in the transportation of petroleum oil as it has advantages over chemical surfactants which are not environmental friendly (Bordoloi and Konwar, 2008). Microbial enhanced oil recovery (MEOR) is one such method that requires less cost and chemical/energy as compared to the conventional method used for enhanced oil recovery (EOR). Basically, three main strategies have been applied for EOR using biosurfactant are as follows: (i) the oil reservoir is injected with biosurfactant producing bacteria and allowed for subsequent multiplication; (ii) the oil reservoir is injected with defined nutrients which stimulates the growth of indigenous biosurfactant producing microbes; (iii) ex-situ production of biosurfactant and further injection to the oil reservoir (Varjani and Upasani, 2016a). The mechanism in MEOR includes a reduction in surface tension and viscosity of oil by the biosurfactant released by microbes. Apart from these, the production of polymers, gas formation, acid production, and degradation of limestone cores in the oil reservoir by the microbes also enhances the recovery of oil (Pathak and Keharia, 2014).
From an economic point of view, rhamnolipid production from microbes is much expensive than synthetic surfactants. Therefore, there is a need to find a suitable carbon source that should be economic and easily utilized by the microbe to produce rhamnolipid with greater yield. The most economical substrate to cut down the cost of rhamnolipid generation could be effective use of agro-industrial by-products or their derivatives as carbon sources (Gudiña et al., 2015). Currently, a number of reports revealed the production of rhamnolipid using different agro-industrial by-products or their derivatives as substrate, which include palm oil industrial waste (Radzuan et al., 2017), orange fruit peel (George and Jayachandran, 2009), paneer whey waste (Patowary et al., 2016), corn steep liquor (Silva et al., 2014), mango kernel oil (Sathi Reddy et al., 2016) and waste frying coconut oil (George and Jayachandran 2013).
The goal of the current study is to examine the physico-chemical properties and environmental value of rhamnolipid biosurfactant extracted from P. aeruginosa PU1 isolated from transformer oil-contaminated area in Puducherry (India). The study also deals with the optimization of rhamnolipid production from a low-cost substrate (molasses) produced as an agro-industrial by-product, along with various nitrogen sources. We further evaluated the MEOR by rhamnolipid biosurfactant using sand pack column.
Transformer oil-contaminated soil deposits were collected from the Electricity Department, NSC Bose Road, Puducherry (11.9452° N, 79.7960° E), India. The area from where the soil samples were collected was chronically contaminated with used transformer oil. The soil was randomly collected at a depth of 0–30 cm from the ground, stored in sterile plastic bags, and labeled. The samples were brought to the laboratory in aseptic condition and stored at 4 ○C for further examination. The entire chemicals were used are of analytical grade.
Enriched media was prepared by taking 1 g of transformer oil-contaminated soil added to Bushnell Haas broth (BHB) (Himedia, Mumbai), which is a mineral salt medium (MSM). Further, 2% crude oil (w/v) was served as the only source of carbon and these culture flasks were kept for 7 days at 35 ○C in an incubator shaker (Orbitek, India) with 150 rpm. The step was repeated 5 times with 7 days of incubation by inoculating 1 mL of 7th day culture to the freshly prepared MSM broth having 2% crude oil (w/v). After enrichment, the cultures were plated on surfaces of MSM agar containing crude oil as the only carbon source. After 3 days of incubation, the isolated cultures were further plated on nutrient agar plates to
ISSN 2348-313X (Print)
International Journal of Life Sciences Research ISSN 2348-3148 (online) Vol. 9, Issue 1, pp: (47-66), Month: January - March 2021, Available at: www.researchpublish.com
get pure culture. The pure colonies isolated were used to prepare 50% (v/v) glycerol stocks and stored in 20 ○C for future use.
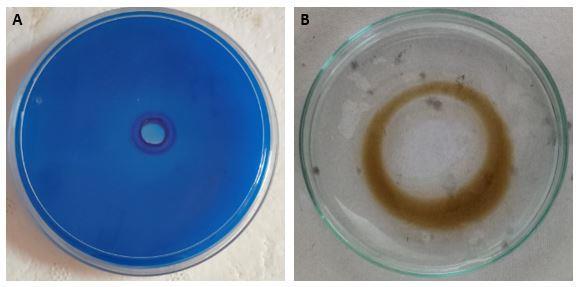
The strain was checked by hemolytic assay for their ability to produce biosurfactant as earlier reported by Mulligan et al. (1984) with some modifications. About 5 mL of sheep blood was added to the 95 mL of blood agar medium (Himedia, Mumbai) and the pure culture was inoculated and kept for incubation at 37 ○C for 48 h. Blood agar plates were observed to check the nature of hemolysis (α, β, or γ-hemolysis). The strain that displayed positive results for the hemolytic assay was further checked for biosurfactant production via the blue agar plate (BAP) method with some modifications (Siegmund and Wagner 1991). The production of extracellular glycolipid was detected by methylene blue agar plate contains MSM supplemented with 2% dextrose, 0.5 mg/mL cetyl trimethyl ammonium bromide (CTAB), and methylene blue (5 µg/mL). The appearance of a dark blue colour around the well loaded with microbial culture indicates the production of rhamnolipid biosurfactant.
The screening of biosurfactant production was further confirmed by the oil-displacement test (Rodrigues et al., 2006). For this assay, a petri dish was filled with 50 mL of distilled water and 500 µL of used engine oil was dropped on top of the water and further 10 µL of cell-free supernatant was loaded. The appearance of a clear zone is a positive indication of biosurfactant production and the clear zone diameter on the oil surface was measured. Sterile distilled water was used as a negative control. The experiment was performed in triplicates.
After screening for the biosurfactant production, the identification of selected strain PU1 was performed by 16S rRNA gene sequencing. For this, the genomic DNA was isolated from the strain PU1 and amplification was done by using the universal primers for the 16S rRNA gene. The amplified product was purified and sequencing was performed by Scigenomics (Cochin, India). The neighbor-joining phylogenetic tree for strain PU1 was constructed based on homologies of 16S rRNA gene sequences by Mega software (version 7.0.26).
The isolated strain PU1 was checked for its optimal biosurfactant production in presence of molasses at various concentrations (2-10% w/v) in the BHB medium. Similarly, several nitrogen sources like peptone, tryptone, yeast extract, beef extract, and ammonium nitrate were used for enhancing the biosurfactant production at a concentration of 5% (w/v). The medium covering molasses and various nitrogen sources was inoculated with 0.5% freshly grown culture in nutrient broth for 24 h. The culture broths were kept for incubation at 37 ˚C at 150 rpm for 48 h. The samples were collected at the end of 48 h in an aseptic condition and used for determining the biomass, emulsification index, oil spread test, and rhamnolipid biosurfactant production. The production of rhamnolipid was measured by quantifying the rhamnose using the phenol sulfuric acid method (Dubois et al., 1956).
The surfactant emulsification activity (E24) was performed according to the method of Pornsunthorntawee et al. (2008) with minor changes. A mixture of 3 mL cell-free supernatant was added with 3 mL of used engine oil and then vigorously shaken for 2 min and further kept at room temperature for 24 h of incubation without disturbance. For measurement of emulsification index after 24 h, the emulsion height was divided by the total height of the solution mixture and multiplied by a hundred.
P. aeruginosa PU1 was used for the production of biosurfactant by using Bushnell Haas broth supplemented with 6% molasses and 5% ammonium nitrate. Concisely, the overnight grown strain PU1 was used and 0.5% of the pre-culture bacteria were inoculated to one liter of the production media. The broth was incubated at 37 ○C for 48 h. Further, bacterial culture was removed by centrifugation (10,000 x g, 4 ○C for 20 min). The acidification of cell-free supernatant was done by using 2 N HCl until it reaches pH 2.0. After acidification, it was incubated for 12 h at 4 ○C to enhance the biosurfactant precipitation. Further, the bottom settled insoluble precipitates were collected by centrifugation (10,000 x g, 4 ˚C for 20 min). This precipitate was considered as a crude biosurfactant and then dissolved in a minimal amount of deionized water and the pH of precipitate was further adjusted to 7 with 1 M NaOH. This crude biosurfactant solution was freeze-dried
ISSN 2348-313X (Print)
International Journal of Life Sciences Research ISSN 2348-3148 (online) Vol. 9, Issue 1, pp: (47-66), Month: January - March 2021, Available at: www.researchpublish.com
and was further stored at –20 ○C. To refine the extracted biosurfactant, it was passed through a silica gel (60–120 mesh) glass column. The biosurfactant was obtained with stepwise elution using chloroform and methanol as solvent. The proportion of chloroform was increased from 10 to 50% and the active fraction was collected and checked for purity by using TLC with a mobile phase of chloroform: methanol: water (65:25:4). Further TLC plate was developed by using anisaldehyde, H2SO4, and glacial acetic acid (5:1:50) by heating the plate at 100 ˚C for 5 min. The appearance of a greenish-purple spot confirms the presence of rhamnolipid.
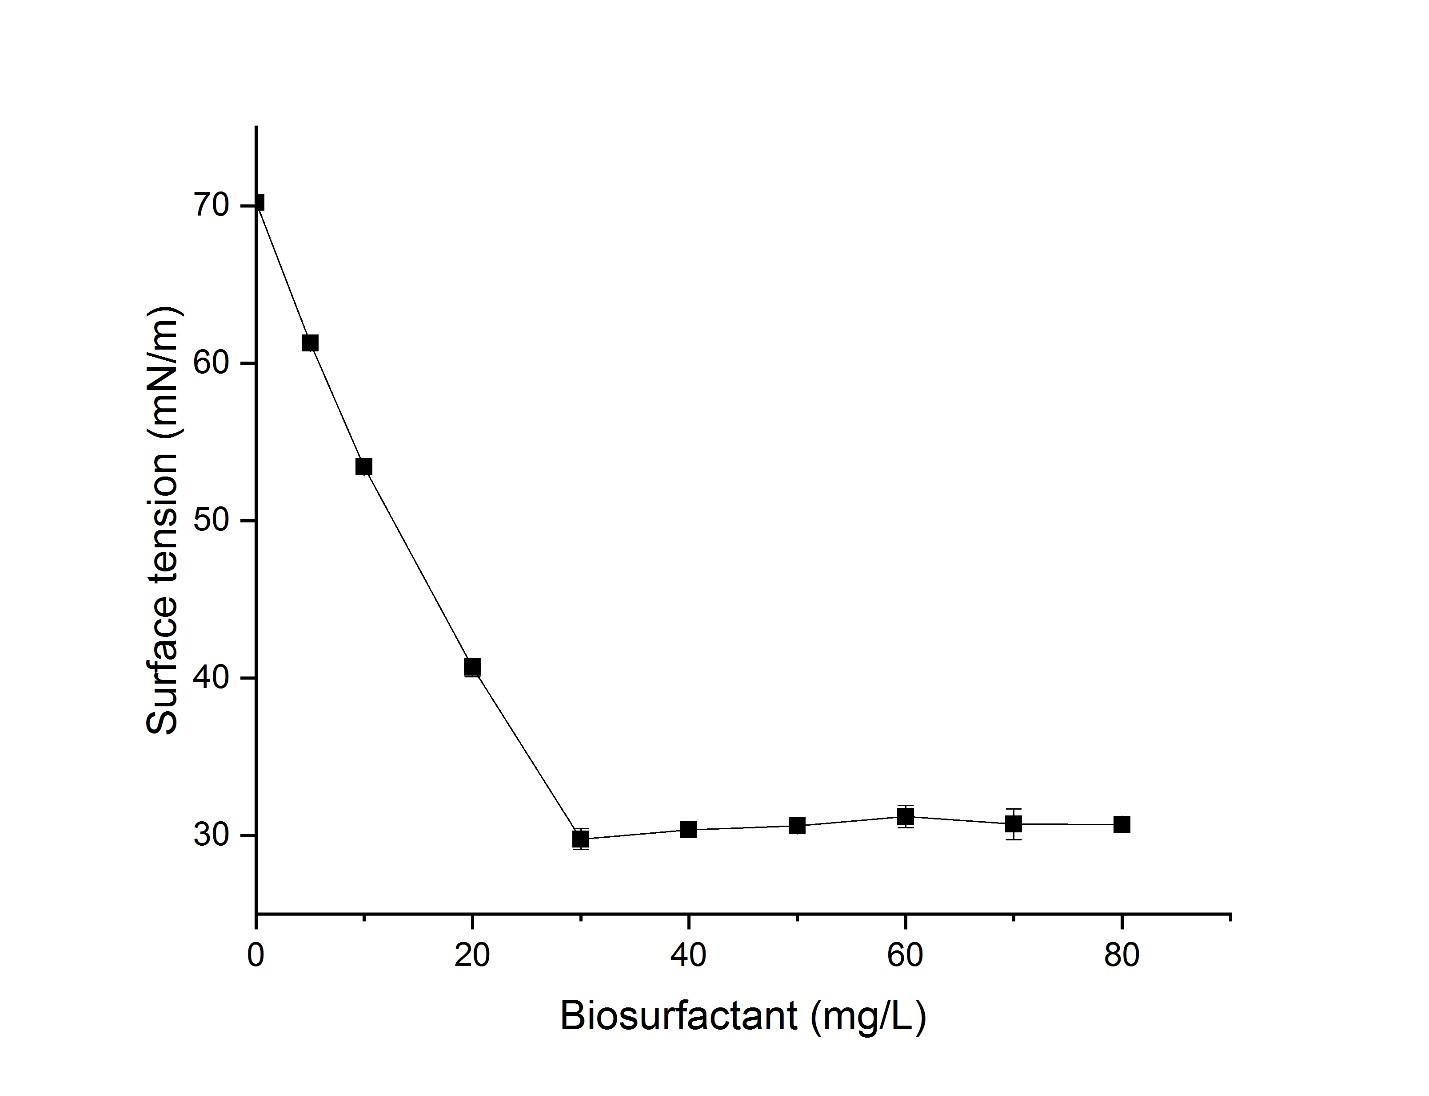
The cell-free supernatant was obtained by centrifuging cultures at 10,000 × g at 4 ˚C for 20 min. The surface tension was measured by the ring method using Tensiometer (Kruss Easy Dyne-V-1847) at room temperature. The instrument was standardized against deionized water before use. The CMC of biosurfactant was carried out by plotting the surface tension to its biosurfactant concentration (10 to 80 mg/mL). It is important to know the CMC of a particular biosurfactant because beyond CMC concentration there is no further effect is experienced in the surface tension.
2.9.1.
Laboratory biodegradation studies of various oils such as diesel oil, kerosene, used transformer oil and petroleum oil were conducted as reported previously with minor modification (Mittal and Singh 2009). Biodegradation of these oils by P. aeruginosa PU1 was conducted in 100 mL BH broth for 10 days of the incubation period in a shaker at 150 rpm and 35 ˚C. The conical flasks were supplemented with various oil (2%, v/v) in BH broth. The oil used in the experiment was filter-sterilized using syringe-filters (0.22 μm). The 1 mL (109 CFU/mL) of freshly grown P. aeruginosa PU1 was inoculated to the medium containing oil. The other uninoculated flasks were monitored and maintained in the same environmental conditions. A total of 10 flasks were used for each type of oil among which 5 flasks were inoculated and the rest of the flasks were kept as abiotic control. After incubation, the samples were harvested at regular intervals of two days for the extraction and to determine the amount of the residual oil.
2.9.2.
After the incubation, P. aeruginosa PU1 treated flasks were centrifuged (10,000 x g, 4 ˚C for 20 min) to obtain cell-free supernatant. To this, double the volume of n-hexane was added and shaken vigorously which resulted in the formation of two layers. The upper layer represents the n-hexane layer with solubilized oil and the lower aqueous layer contains water and biosurfactant. The lower layer was discarded, while the upper layer was used to extract the residual oil. Further, the solvents were removed by rota-evaporator under the reduced condition and then passed through anhydrous sodium sulfate to eliminate moisture (Mishra and Singh 2012).
2.9.3
The amount of residual oil was estimated gravimetrically by measuring the weight of the extracted hydrocarbon in a tared vial. The residual oil in the control and treated groups were calculated using the formula as mentioned below:
The percentage of oil dеgradation (%) = (WAC – WTS)/ WORI x 100. Where WAC is the weight of the residual oil in abiotic control, WTS is the weight of the residual oil in test samples and WORI is the original weight of the oil added to the flask (Patowary et al., 2017).
2.10.1.
The purified biosurfactant was analyzed for its ionic nature by the agar double diffusion method (Meylheuc et al., 2001). The two wells were made on a solidified soft agar by using 1% agarose on glass slides with proper space between wells. To the slide, one side of the well was loaded with purified biosurfactant (50 µL) dissolved in deionized water and another well was loaded with pure composites of known ionic charge. Slides were kept for 24 h incubation at room temperature. The cationic and anionic substances were chosen as barium chloride (50 mmol L-1) and sodium-dodecyl sulfate (20 mmol L-1), respectively. Depending upon the ionic charges of biosurfactants, it diffuses towards the oppositely charged compounds and results in the formation of a thin precipitation line at the junction. The white opaque line formed between biosurfactant and an anionic surfactant, confirms that the biosurfactant is cationic in nature and vice versa for anionic.
ISSN 2348-313X (Print)
International Journal of Life Sciences Research ISSN 2348-3148 (online) Vol. 9, Issue 1, pp: (47-66), Month: January - March 2021, Available at: www.researchpublish.com
2.10.2.
For the detection of functional groups in biosurfactants, FT-IR analysis was carried out. For this purpose, 2 mg of biosurfactant was mixed with 200 mg potassium bromide (KBr) to make a pellet and then analyzed by using an FT-IR spectrometer (Thermo Nicolet Model: 6700) over the wave number of 4000-400 cm-1 .
2.10.3.
The purified biosurfactant was dissolved in 0.5 mL deuteroxide (D2O) to record 1H NMR spectra at 25 ○C using a Bruker Advance-II FT-NMR-400 MHz spectrometer.
After purification by silica column chromatography, the purified biosurfactant fractions were analyzed by using LCMS2010 EV (liquid chromatography mass spectrometry, SHIMADZU, Japan) (Lotfabad et al., 2010). For this, 20 µL of the sample was injected into the HPLC having a Phenomenex C18 (250 mm × 4.60 mm, 5 µm) reverse phase column. The mobile phase consists of acetonitrile-water having 2 mM ammonium acetate. The gradient starts with 40% acetonitrile for 4 min, followed by 90% acetonitrile for 21 min, and further runs for 2 min. The flow rate condition was fixed to 0.25 mL/min. The sample passes through the HPLC and subjected to mass spectrometry. The mass range spectrum was recorded from 50 to 900 Da.
2.10.5.
In brief, 10 mg of the lyophilized biosurfactant powder was kept on the platinum crucible and heated with a linear heating rate (10 ○C/min) in the range of 0–400 ○C by using a thermal system (TG-DTA/DSC Model: Q600 SDT).
XRD was performed to study the physical characterization of biosurfactant (PANalytical X’Pert PRO). The scanning was carried out at varied ranges of 2θ angles (10–75˚) with a scan rate of 2˚ min-1 using CuKα radiation at 40 kV and 30 mA, monochromatized with graphite crystals.
The stability of biosurfactant was evaluated in different pH, temperature, and salt concentration. The experiment was performed with the purified biosurfactant with a concentration of 30 mg/mL for each test using used engine oil. To study the effect of temperature, the biosurfactant was heated at 100 ○C for 1 h and incubated at various temperatures (4–120 ○C). Similarly, to check the effect of salt concentration, the biosurfactant was mixed with different concentrations of NaCl (2–10 %) for 1 h. To evaluate the effect of pH (pH 2–12), the biosurfactant was mixed with 0.1 M sodium acetate buffer, 0.1 M sodium phosphate buffer, and 0.1 M tris buffer to maintain the acidic and basic pH. The stability of the biosurfactant was determined by calculating the emulsifying activity after 24 h and also on the 7th day.
2.12.1.
Oil recovery activity of the biosurfactant from the sand matrix was performed as previously described (Suthar et al., 2008). The glass column 40 x 2.5 cm was packed with 100 g of sand pretreated by washing with 1 N HCL and completely dried in a hot air oven at 100 °C for 12 h. Further, NaCl (5%, w/v) solution (brine solution) was passed through the column, and pore volume was determined by measuring the volume required to make the sand matrix wet in a brine solution. To ensure the saturation of the column three pore volumes of brine solution were passed to the column. As crude oil was subjected to the column, brine was displaced and discharged from the column. The volume of brine displaced was used to measure initial oil saturation, while the crude oil entered the column. The sand pack column was flooded with brine until there was no further oil in the effluent to attain a condition called residual oil saturation. The amount of crude oil retained in the column and the oil discharged in the effluent was measured volumetrically. The activity was estimated by pouring 50 mL of crude biosurfactant PU1 (30 mg/L), purified biosurfactant PU1 (30 mg/L), SDS (30 mg/L), and Triton X-100 (0.03%) into the column and incubated for 24 h at room temperature and the amount of oil recovered after 24 h was calculated.
ISSN 2348-313X (Print)
International Journal of Life Sciences Research ISSN 2348-3148 (online) Vol. 9, Issue 1, pp: (47-66), Month: January - March 2021, Available at: www.researchpublish.com
The statistical analysis was performed by using SPSS 20.0 for Windows software (SPSS Inc., Chicago, IL). Mean and standard deviation values were determined after the value obtained from triplicate results. The variations between the mean of the test were calculated by Duncan’s test and p < 0.05 was considered significantly different by one-way ANOVA.
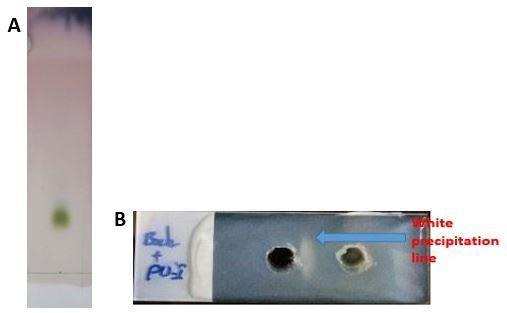
The enrichment method was done for isolating the potent hydrocarbon-degrading bacteria from the transformer oilcontaminated area. In the current study, the preliminary screening method for the detection of biosurfactant has been carried out by hemolysis, CTAB methylene blue agar method, and oil displacement method. One of the strains (Strain PU1) showed a positive test for hemolysis assay (data not shown) and a distinct dark blue colour halo formation in CTAB methylene blue agar (Fig. 1. A) method, confirming the presence of biosurfactant production. The strain PU1 also showed significantly clear zone in oil-displacement activity (Fig. 1. B) indicating the qualitative screening of biosurfactant production. The strain PU1 showed better oil-displacement activity as compared with the other isolates (data not shown). Therefore, the strain PU1 was selected for further studies. With all the above-mentioned screening methods, it was confirmed that the strain PU1 is a potent biosurfactant producer.
The sequence of the 16S rRNA gene of strain PU1 has been submitted in the NCBI GenBank database and obtained the accession number (KU375544). The identification of strain PU1 was done by homology search using the BLAST tool. The strain PU1 was found to be similarly correlated to Pseudomonas aeruginosa strain DSM 50071 with the percentage similarity of 100%. The neighbor-joining phylogenetic tree of Pseudomonas aeruginosa PU1 was created by Mega software (Fig. 2).
By using various carbon sources, microorganisms can produce rhamnolipid congeners with distinct structures with varied proportions having different surface activities (Zhao et al., 2015). In the current study, we have optimized the production of rhamnolipid by using low-cost carbon source like sugarcane molasses. The strain PU1 has shown maximum production of rhamnolipid (7.24 ± 0.15 g/L) in 6% molasses (Table 1) at 37 ˚C after 48 h of the incubation period. There was increase in biomass (4.39 ± 0.23 g/L), emulsification index (73.93 ± 3.34%) and oil displacement (1.0 ± 0.10 cm) in 6% molasses. In direction to increase the production of rhamnolipid, molasses (6%, w/v) were also supplemented with various nitrogen sources (5%, w/v). It was observed that maximum rhamnolipid (8.92 ± 0.08 g/L) production was obtained when molasses was augmented with 5% ammonium nitrate (Table 1). Also, there was a significant increase in the biomass (5.30 ± 0.10 g/L), emulsification index (82.72 ± 2.14%), and oil displacement (1.37 ± 0.06 cm) as compared with the other nitrogen sources. There was higher production of rhamnolipid in presence of ammonium nitrate as compared to other nitrogen sources because P. aeruginosa PU1 was more efficiently able to incorporate NH4 + and NO3into the cells for the assimilatory process (Zhou et al., 2007). The most auspicious thing for biosurfactant production should be a low-cost substrate and optimizing the substrate for an optimal yield of the biosurfactant. P. aeruginosa GS3 showed 0.24 g/L rhamnolipid production after 96 h of incubation which was much less as compared to our present study (Patel and Desai, 1997). In another study, Pseudomonas sp. 2B was able to produce 4.97 g/L rhamnolipid after 96 h of incubation which was also less as compared to the rhamnolipid production (7.24 ± 0.15 g/L) by P. aeruginosa PU1 (Aparna et al., 2012). In the current work, a great amount of rhamnolipid production was attained by the use of low-cost agro-industrial by-products.
The CMC is a key characteristic feature of a biosurfactant and is defined as the concentration at which the addition of more surfactant causes the formation of micelle. When the CMC is attained, the surface tension rests constant due to interface saturation with surfactant (Macdonald et al., 1981). The biosurfactant extracted from P. aeruginosa PU1 showed a reduction in surface tension of water from 70.23 to 29.77 mN/m with an increase in concentration up to 30 mg/L (Fig. 3). A recent study has shown that P. aeruginosa ATCC 10145 was able to reduce the surface tension of water up to 28.4
ISSN 2348-313X (Print)
International Journal of Life Sciences Research ISSN 2348-3148 (online) Vol. 9, Issue 1, pp: (47-66), Month: January - March 2021, Available at: www.researchpublish.com
mN/m at a CMC concentration of 50 mg/L which was comparatively higher than P. aeruginosa PU1 (Du et al., 2019) This surface-active property is directly related to the type of rhamnolipid congeners produced by different types of strains indicating the effectiveness of the rhamnolipid.
The lab-scale biodegradation study of various oils was monitored up to 10 days of the incubation period. The results unveil a progressive increase in biodegradation with an increase in time. The amount of residual oil was estimated gravimetrically and it was found that P. aeruginosa PU1 showed maximum degradation of 95.55 ± 2.70% and 94.36 ± 1.86% towards used transformer oil and diesel after 10 days of the incubation period, respectively (Fig. 4). Apart from these, P. aeruginosa PU1 showed a maximum degradation of 76.17 ± 1.62% and 66.03 ± 2.91% towards kerosene and petroleum oil, respectively. In one of the studies, Acinetobacter haemolyticus Zn01 showed 92% of diesel oil degradation in 14 days of the incubation period, however, the present study showed 94% of diesel oil degradation (Onur, Yilmaz and Icgen, 2015). The results from the biodegradation of these oils suggested that P. aeruginosa PU1 has good potential in hydrocarbon degradation which could have been facilitated by the production of biosurfactants.
The rhamnolipid mixture was extracted and purified by silica gel (60-120 mesh) glass column for characterization purposes. The rhamnolipid was analyzed by TLC which showed a light green colour spot (Fig. 5. A). The ionic character of extracellular biosurfactant is one of the features that contribute strongly to the functional properties. Agar double diffusion assay was carried out to know the ionic charge of biosurfactant which depends upon the charges of both compounds for diffusion in a soft solidified agarose gel. This test showed the presence of a white insoluble precipitation line between the biosurfactant and barium chloride used as a cationic compound (Fig. 5. B). Whereas no precipitation lines were found between biosurfactant and the SDS which is an anionic compound. Thus it confirms the anionic nature of the biosurfactant by forming a turbid, white precipitation line between the sample and cationic compound barium chloride well. The anionic nature of biosurfactant was also confirmed by the semi-qualitative CTAB-methylene blue agar method as mentioned in the screening part. Similar ionic nature of biosurfactant has been reported previously which supports our findings (Rocha e Silva et al., 2014; Silva et al., 2010).
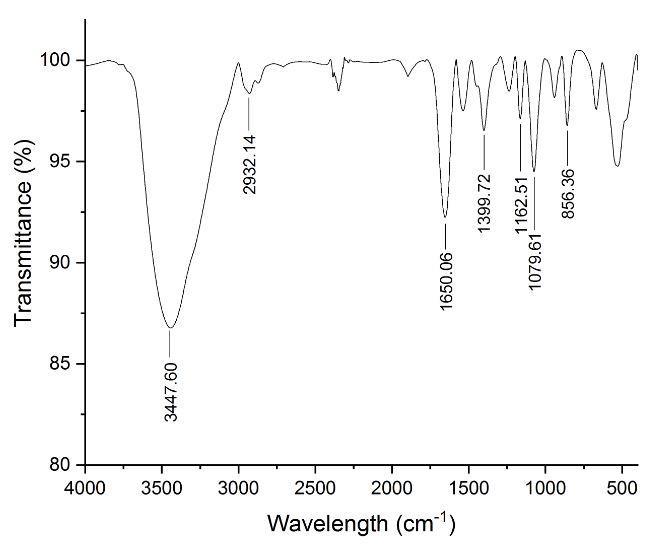
The FTIR spectrum (Fig. 6) of purified biosurfactant showed a broad stretch intense peak around 3447 cm-1 confirms the presence of a hydroxyl group (Lan et al., 2015). The peak around 2932 cm-1 corresponds to asymmetrical C―H stretching vibration of CH2 and CH3 groups in aliphatic chains (Lan et al., 2015). The peak around 1650 cm-1 suggests the presence of the C═O group in the carboxylate (Pornsunthorntawee et al., 2008) and 1399 cm-1 confirms the presence of C―C stretch in-ring aromatic structures. The absorption peak around 1162 cm-1 and 1079 cm-1 confirms the C―O―C group of the rhamnose ring (Lan et al., 2015). Compared with previous literature (Chandankere et al., 2014; Lan et al., 2015) these functional groups support the characteristic feature of rhamnolipid.
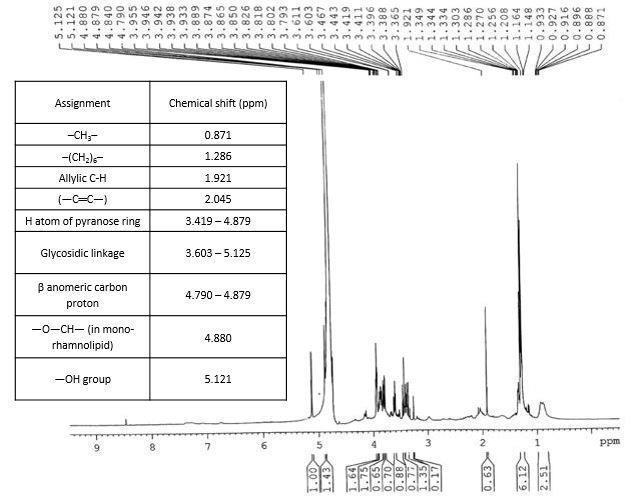
1H NMR spectra of purified biosurfactant have been presented in Fig. 7. The protons of two major components in the rhamnolipid that is rhamnose sugar and aliphatic moiety were detected. The chemical shift (δ) values at 0.871 and 1.286 ppm are ―CH3 and ―(CH2)6― groups of aliphatic chains respectively (Lan et al., 2015). The presence of CH–proton of De-oxy sugar at C5/C6 carbon was confirmed by δ value at 1.921 ppm. The (δ) value from 3.603 to 5.125 ppm probably indicates the presence of glycosidic linkage of pentose/hexose sugar and the δ value at 4.790 – 4.879 ppm confirms the presence of β-anomeric carbon protons of sugar moieties (Lan et al., 2015). Further δ value at 2.045 ppm showed the presence of unsaturated bond (―C═C―) of aliphatic chains and the δ value from 3.419 to 4.879 ppm was the hydrogen atom of the pyranose ring. The presence of the ―OH group was confirmed by δ value at 5.121 ppm. The CH3 groups in the sugar rings of mono-rhamnolipid and di-rhamnolipid were confirmed by the δ value at 1.270 ppm and 1.256 ppm, respectively (Aparna et al., 2012). The chemical shift at 4.880 ppm confirmed the presence of ―O―CH― group in the mono-rhamnolipid (Lotfabad et al., 2010). A similar type of spectral peaks was also found formerly in biosurfactants extracted from various Pseudomonas sp. (Bhardwaj et al., 2015; Wei et al., 2005).
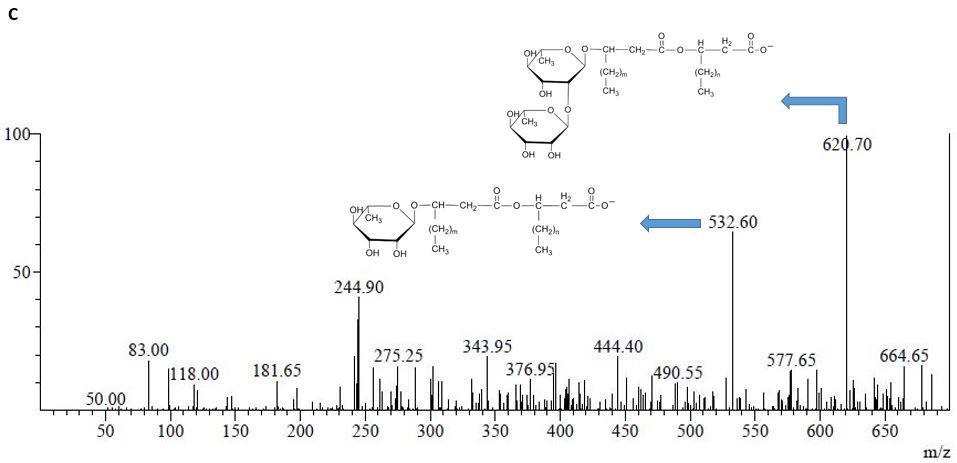
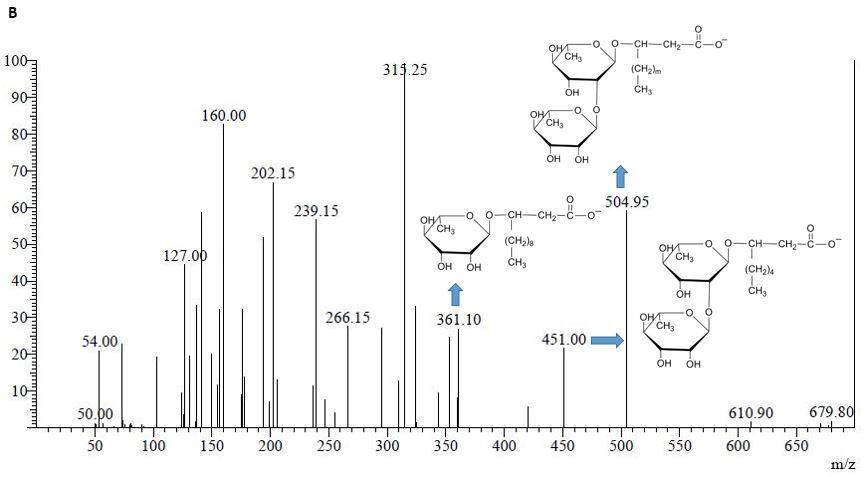
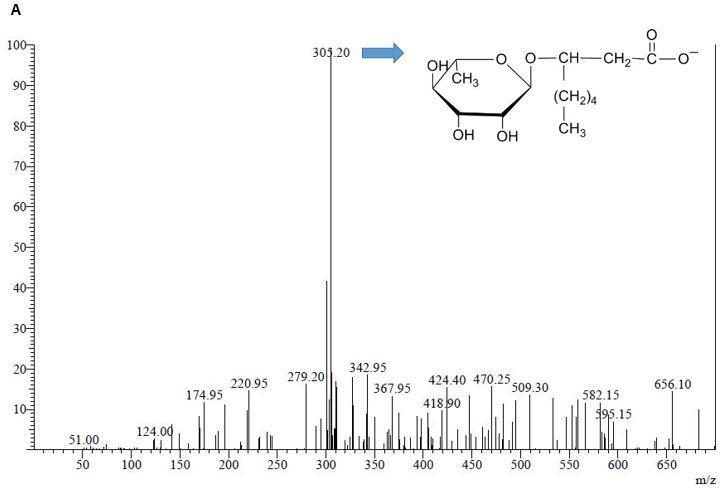
The extracted rhamnolipids from P. aeruginosa PU1 were identified by mass spectrometry. The different congeners formed by P. aeruginosa PU1 in the rhamnolipid production were analyzed after purification with silica column by LCMS and are summarized in Table 2. Rhamnolipid biosurfactant mixture shows the presence of six main constituents which were detected as the pseudomolecular ions of m/z 305, 361, 451, 505, 532, and 621 which corresponds to
ISSN 2348-313X (Print)
International Journal of Life Sciences Research ISSN 2348-3148 (online) Vol. 9, Issue 1, pp: (47-66), Month: January - March 2021, Available at: www.researchpublish.com
deprotonated molecules of Rha-C8, Rha-C12, Rha-Rha-C8, Rha-Rha-C12:1, Rha-Rha-C10-C12/Rha-Rha-C12-C10, and RhaRha-C8-C10/Rha-Rha-C10-C8, respectively. The chemical structure can be predicted based on the ion fragments in the mass spectrum for each component. The mass spectrum for the components such as Rha-C8, Rha-C12, Rha-Rha-C8, Rha-RhaC12:1, Rha-Rha-C10-C12/Rha-Rha-C12-C10, and Rha-Rha-C8-C10/Rha-Rha-C10-C8 is presented in Fig. 8 The composition of rhamnolipid and prevalence of a specific type of congener is mainly influenced by several factors like nature of carbon substrate, culture condition, age of the culture, and the type of culture (Singh and Cameotra, 2013). Few authors have suggested that more di-rhamnolipid production is because of more expression of rhlC gene encoding for rhamnosyl transferase involved in di-rhamnolipid production in P. aeruginosa (Rahim et al., 2001). Few reports have also suggested that rhamnolipid containing single hydroxyl fatty acid might also be produced due to hydrolysis of congeners containing two fatty acids (Singh and Cameotra, 2013).
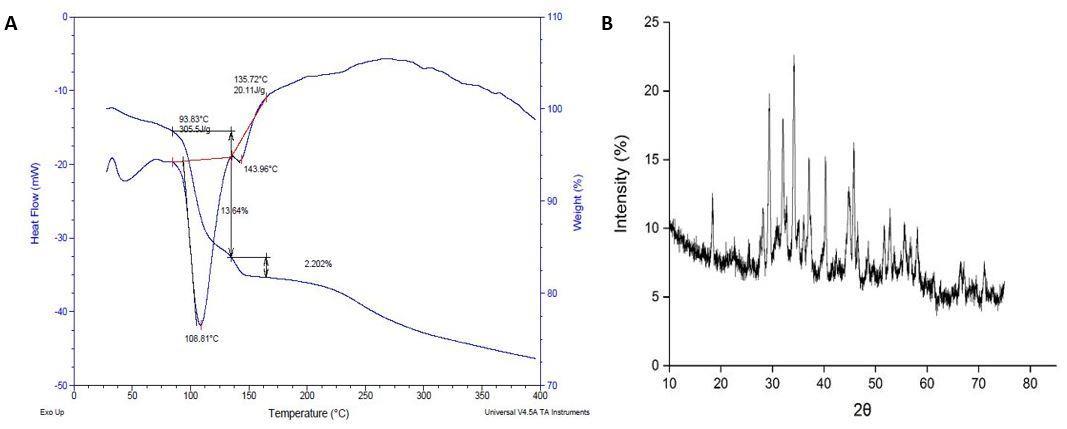
The thermal behavior of biosurfactants can be very well analyzed for their industrial application using thermogravimetric analysis. The TGA was carried out dynamically between weight loss versus the temperature in the range of 25 ○C to 400 ○C (Fig. 9. A). Rhamnolipid showed a minimum weight loss of 11% from 25 ○C to 110 ○C was due to the presence of moisture content. Carboxyl groups present in the rhamnolipid tend to bound with more water molecules results in the first phase of degradation. There was a minor degradation between 135 ○C and 165 ○C with a minimum weight loss of 2.202%. There was a minimum weight loss of only 27% up to 400 ○C without major degradation of the compound and therefore the rhamnolipid was found to be thermally stable. Rhamnolipid from P. aeruginosa MA01 showed a degradation temperature of 250 ○C and the overall weight loss was more than 70% around 300 ○C (Abbasi et al., 2012). This shows that rhamnolipid from P. aeruginosa PU1 is much more thermally stable with a minimum weight loss of 27% up to 400 ○C. This striking feature of rhamnolipid can be utilized in industries that require highly thermo-stable surfactants. Differential scanning calorimetric (DSC) analysis of rhamnolipid from P. aeruginosa PU1 showed only a single significant change in enthalpy at 108.81 ○C (Fig. 9. A). This endothermic peak corresponding to the melting point was due to loss of moisture. The endothermic enthalpy change at this particular point was found to be 305.5 J/g. Apart from this, the DSC thermogram showed no significant degradation at any point up to 400 ○C and therefore no other endothermic peaks were observed which confirms that the rhamnolipid was thermally stable.
XRD analysis for rhamnolipid was done to know the degree of crystallinity. Crystalline structure is denoted by strong and narrow peaks whereas small and broad peaks reflect amorphous nature. The powdered XRD spectra of rhamnolipid revealed characteristic diffraction peak at 18.32, 29.38, 32.75, 34.22, 37.01, 40.22, 45.77, 46.47 and 52.85 in 2θ area attributed to interplanar spacing (d-spacing) of 4.83, 3.03, 2.73, 2.61, 2.42, 2.24, 1.98, 1.95 and 1.73 Å, respectively (Fig. 9. B). The presence of sharp peaks at the chromatogram of XRD confirms the crystalline nature of rhamnolipid. To the best of our knowledge, there are no reports on the study of XRD pattern in rhamnolipid from P. aeruginosa. Therefore, this is the first study to report a crystalline nature of rhamnolipid through XRD analysis. However, there are reports which showed the crystalline nature of biosurfactant from Bacillus methylotrophicus USTBa through XRD, which is a lipopeptide biosurfactant (Chandankere et al., 2013).
The formation of emulsion occurs when one liquid is dispersed in another liquid phase as microscopic droplets. The emulsification of hydrocarbon by a microbial surfactant is substrate-specific and it emulsifies different hydrocarbon at different rates (Luna et al., 2013). During the emulsification of hydrocarbon by biosurfactant if the microscopic droplets are retained for a longer duration of time then the biosurfactant is considered to be more stable. Several factors also affect the stability of the biosurfactant like pH, temperature, and salinity. To find a suitable application for the biosurfactant there is a need to study the impact of these factors over the stability of biosurfactant at different pH, temperature, and salinity. Apart from this, stability studies have to be evaluated for a longer duration of time to check the extent of the stability of emulsions.
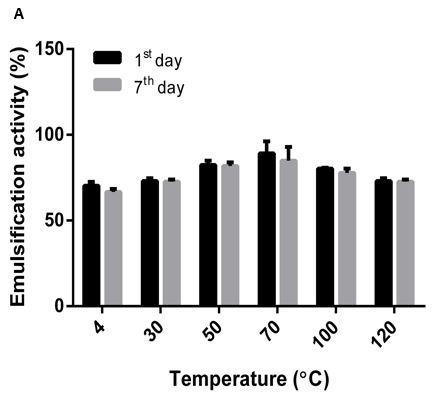
The stability of the biosurfactant was also looked for a wide range of temperatures (4 ˚C to 120 ˚C). The Fig. 10. A shows the stability of biosurfactant at a different temperature on 1st day and after 7th day. The results of the stability studies revealed that emulsification activity was not lost even by heating up to 120 ˚C. The highest emulsification activity was
ISSN 2348-313X (Print)
International Journal of Life Sciences Research ISSN 2348-3148 (online) Vol. 9, Issue 1, pp: (47-66), Month: January - March 2021, Available at: www.researchpublish.com
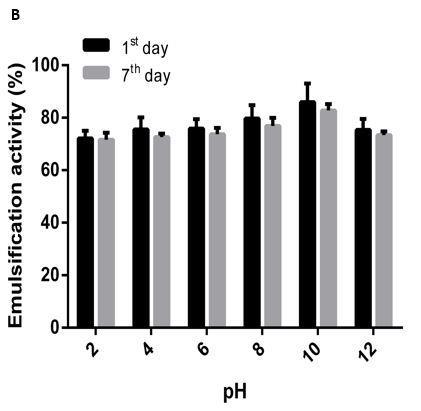
found to be 86.55 ± 3.30% and 83.24 ± 4.89% at 70 ˚C on the 1st and after 7th day, respectively. Moreover, there was a decrease in the emulsification activity when the biosurfactant was incubated at 4 ˚C for 30 min. The biosurfactant from P. aeruginosa DR1 cultivated in mango kernel oil showed high thermal stability towards different temperature treatments up to 120 ˚C for 30 min and exhibited the highest emulsification activity (73%) at 30 ˚C (Sathi Reddy et al., 2016). However, in the present study, biosurfactant PU1 showed 86.55 ± 3.30% and 80.32 ± 0.45% of emulsifying activity at 70 ˚C and 100 ˚C which is comparably much higher to P. aeruginosa DR1. The results from the emulsifying activity of our study also showed better stability of rhamnolipid as compared to the rhamnolipid produced from Lysinibacillus sphaericus strain IITR51 (Gaur et al., 2019). Biosurfactant PU1 also showed better thermal stability as compared to the biosurfactant produced by Pseudomonas sp. 2B, Pseudomonas azotoformans AJ15, (Aparna et al., 2012; Das and Kumar, 2018). The results from the thermal analysis also suggested high thermal stability of the biosurfactant and therefore it can be implemented in the microbial enhanced oil recovery process where such high temperature is involved. The results of the present study showed a wide range of stability of biosurfactant PU1 at different pH (pH 2–12) with minor differences in the emulsifying activity on 1st and after 7th day (Fig. 10. B). At lower pH (around pH 2), there was a decrease in the emulsification activity because of the anionic nature of the biosurfactant (Gaur et al., 2019). The increase in emulsification activity was observed from pH 4 to pH 10 and further, the activity was reduced at pH 12. The maximum emulsifying activity was found to be 88.95 ± 4.77% and 85.77 ± 2.70% at pH 10 on the 1st and after 7th day, respectively. This reduction in the emulsification activity at pH 12 could be due to the change in structural confirmation of the biosurfactant at such extreme pH (Aparna et al., 2012). The emulsifying activity was found to be stable even on day 7 with very slight changes. A different pattern of effect of pH on the emulsification activity of rhamnolipid biosurfactant was observed in Pseudomonas sp. 2B, where it showed maximum emulsification activity of 84% at pH 7 (Aparna et al., 2012). In one of the studies, P. aeruginosa UCP0992 showed maximum emulsification activity (90 ± 5.1%) after 24 h of incubation at pH 10 using motor oil (Silva et al., 2019). However, our study showed the stability of biosurfactant up to the 7th day.
The effect of salinity on emulsifying activity was studied at different concentrations of NaCl (2 to 10%). The biosurfactant PU1 showed a stable range of emulsifying activity at all the tested salt concentrations (Fig. 10. C). Previous reports also suggested that upon increasing the concentration of NaCl, the emulsifying activity reduces as the electrolytes present in the NaCl affect the carboxylate group of rhamnolipid (Das and Kumar, 2018). However, in our study, there was no reduction in the emulsification activity up to 10% NaCl concentration. Our results showed similar kinds of emulsification activity, as observed by the biosurfcatant produced by Pseudomonas sp. 2B (Aparna et al., 2012). Thus, the results of our stability studies show that the biosurfactant produced by P. aeruginosa PU1 can be utilized in extreme environmental conditions.
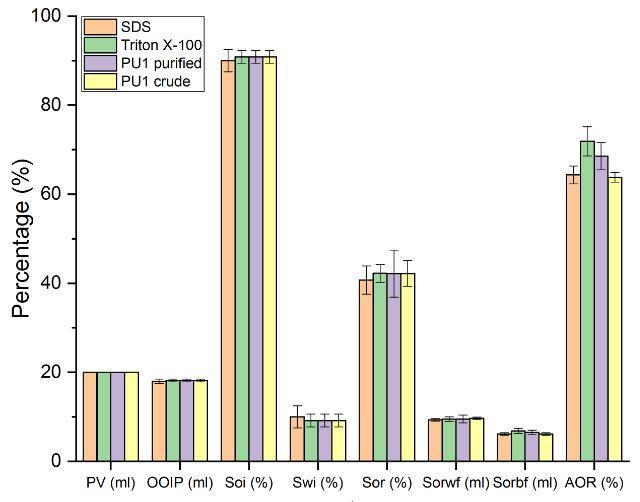
In order to recover the oil from the sand pack column, we have used biosurfactant along with two different chemical surfactants for comparison. The values of PV, OOIP, Soi, Swi, Sor, Sorwf, Sorbf, and AOR for biosurfactant, SDS, and Triton X-100 are shown in Fig. 11. The additional oil recovered from the sand pack column was 63.77 ± 1.06% and 68.53 ± 3.07% for crude and purified biosurfactant PU1, respectively, whereas for SDS and Triton X-100 it was found to be 64.33 ± 2.03% and 71.88 ± 3.30%, respectively. Pseudomonas aeruginosa SP4 showed enhanced oil recovery of 57.01 ± 0.58% which was comparatively lower as compared to biosurfactant from P. aeruginosa PU1 (Pornsunthorntawee et al., 2008). In another study, rhamnolipid (120 mg/L) from P. aeruginosa MM1011 showed an oil recovery of 27%, which was also much lower as compared to the present study (Amani et al., 2013). Therefore, the biosurfactant from P. aeruginosa PU1 can be considered as a better candidate for MEOR. Previous studies have also shown that reduction in the surface tension and alteration in wettability by the biosurfactant improves the recovery of oil (Varjani and Upasani, 2016a). Our biosurfactant PU1 also showed a much greater reduction in the surface tension of water from 70.23 to 29.77 mN/m at a much lower concentration of 30 mg/L, which could also be the reason for its superior oil recovery. The results from the stability studies also showed higher emulsifying activity at various ranges of NaCl concentration (2–10%), which suggested that biosurfactant PU1 has remarkable potential in oil recovery even at alkaline conditions. The results from the MEOR study also suggested that crude biosurfactant has a very slight difference in oil recovery as compared to the purified biosurfactant. Hence, crude biosurfactants can be implemented for oil recovery applications to compensate for the cost. Oil recovery from core flooded experiments are conducted to evaluate microbial enhanced oil recovery (MEOR) by use of biosurfactant to enhance mobilization of the residual oil from the sand pack column. The trapped oil in the sand
ISSN 2348-313X (Print)
International Journal of Life Sciences Research ISSN 2348-3148 (online) Vol. 9, Issue 1, pp: (47-66), Month: January - March 2021, Available at: www.researchpublish.com
pack column resembles that of an oil well, where oil gets trapped in the pores of rock. Usually, oil recovery is carried out in three phases: primary, secondary, and tertiary, which is also known as enhanced oil recovery (EOR). Primary oil recovery (POR) includes collecting oils that naturally rise to the surface, and also uses artificial lift devices, like pump jacks. Secondary oil recovery (SOR) employs water flooding and gas injection, displacing the oil and driving it to the surface. Tertiary oil recovery (TOR) includes chemical and solvent flooding, and thermal recovery. According to the US Department of Energy, utilizing these two methods (POR and SOR) can leave up to 75% of the oil in the well. Secondary oil recovery is most commonly used but, it may pollute the environment if chemical surfactants are applied (Youssef, et al., 2009; Cui 2017). Therefore, in ecological terms, MEOR could be a much better method for oil recovery in the open or closed field.
The present study clearly shows that P. aeruginosa PU1 was able to utilize agro-industrial by-products like molasses and ammonium nitrate for the optimum production of biosurfactants. Moreover, the encouraging results of this biosurfactant were observed in oil dispersion alongside great surface tension reduction. The biosurfactant PU1 was characterized and exhibited excellent emulsifying activity at various ranges of pH, temperature, and salinity. Further, the thermal stability of biosurfactant PU1 and its suitable surface-active properties suggested that it can be utilized in the removal of crude oil or its derived compounds from hydrocarbon polluted surface area. Our findings from the MEOR experiment suggest that biosurfactant PU1 has great potential for the recovery of oils in oil fields or sand contaminated with oils.
Latha Domdi is very thankful to CSIR and UGC, India to provide JRF and SRF fellowship. We gratefully acknowledge Central Instrumentation Facility, Pondicherry University for providing facility to perform FTIR and NMR studies. We would also like to thanks the vector control research center (VCRC), Puducherry for allowing us to use Tensiometer. We also gratefully acknowledge DBT and DST-FIST for providing funds to the Department of Biotechnology.
All the authors declared that there are no personal or financial conflicts of interest. All the authors are consent to publish this manuscript.
[1] Abbasi, H., Hamedi, MM., Lotfabad, TB., Zahiri, HS., Sharafi, H., Masoomi, F., Moosavi-Movahedi, AA., Ortiz, A., Amanlou, M., Noghabi, KA., 2012. Biosurfactant-producing bacterium, Pseudomonas aeruginosa MA01 isolated from spoiled apples: Physicochemical and structural characteristics of isolated biosurfactant. J. Biosci. Bioeng. 113, 211–219.
[2] Amani, H., Müller, MM., Syldatk, C., Hausmann, R., 2013. Production of Microbial Rhamnolipid by Pseudomonas Aeruginosa MM1011 for Ex Situ Enhanced Oil Recovery. Appl. Biochem. Biotechnol. 170, 1080–1093
[3] Aparna, A., Srinikethan, G., Smitha, H., 2012. Production and characterization of biosurfactant produced by a novel Pseudomonas sp. 2B. Colloids. Surf. B. 95, 23–29.
[4] Banat, IM., Makkar, RS., Cameotra, SS., 2000. Potential commercial applications of microbial surfactants. Appl. Microbiol. Biotechnol 53, 495–508.
[5] Bezza, FA., Chirwa, EMN., 2016. Biosurfactant-enhanced bioremediation of aged polycyclic aromatic hydrocarbons ( PAHs ) in creosote contaminated soil. Chemosphere. 144, 635–644.
[6] Bhardwaj, G., Cameotra, SS., Chopra, HK., 2015. Utilization of Oil Industry Residues for the Production of Rhamnolipids by Pseudomonas indica. J. Surfactants Deterg. 18, 887–893.
[7] Bordoloi, NK., Konwar, BK., 2008. Microbial surfactant-enhanced mineral oil recovery under laboratory conditions. Colloids. Surf. B. 63, 73–82.
[8] Chandankere, R., Yao, J., Cai, M., Masakorala, K., Jain, AK., Choi, MMF., 2014. Properties and characterization of biosurfactant in crude oil biodegradation by bacterium Bacillus methylotrophicus USTBa. Fuel. 122, 140–148.
ISSN 2348-313X (Print)
International Journal of Life Sciences Research ISSN 2348-3148 (online) Vol. 9, Issue 1, pp: (47-66), Month: January - March 2021, Available at: www.researchpublish.com
[9] Chandankere, R., Yao, J., Choi, MMF., Masakorala, K., Chan, Y., 2013. An efficient biosurfactant-producing and crude-oil emulsifying bacterium Bacillus methylotrophicus USTBa isolated from petroleum reservoir. Biochem. Eng. J. 74, 46–53.
[10] Cui, QF., Sun, SS., Luo, YJ., Yu, L., Zhang, ZZ., 2017 Comparison of in-situ and ex-situ microbial enhanced oil recovery by strain Pseudomonas aeruginosa WJ-1 in laboratory sand-pack columns. Pet. Sci. Technol. 35, 2044–2050.
[11] Das, AJ., & Kumar, R., 2018. Utilization of agro-industrial waste for biosurfactant production under submerged fermentation and its application in oil recovery from sand matrix. Bioresour. Technol. 260, 233–240
[12] Du, J., Zhang, A., Zhang, X., Si, X., Cao, J., 2019. Comparative analysis of rhamnolipid congener synthesis in neotype Pseudomonas aeruginosa ATCC 10145 and two marine isolates. Bioresour. Technol. 286, 121380.
[13] Dubois, M., Gilles, KA., Hamilton, JK., Rebers, PA., Smith, F., 1956. Colorimetric Method for Determination of Sugars and Related Substances. Anal. Chem. 28, 350–356.
[14] Gaur, VK., Bajaj, A., Regar, RK., Kamthan, M., Jha, RR., Srivastava, JK., Manickam, N., 2019. Rhamnolipid from a Lysinibacillus sphaericus strain IITR51 and its potential application for dissolution of hydrophobic pesticides. Bioresour. Technol. 272, 19–25.
[15] George, S., & Jayachandran, K., 2013. Production and characterization of rhamnolipid biosurfactant from waste frying coconut oil using a novel Pseudomonas aeruginosa D. J. Appl. Microbiol. 114, 373–383.
[16] George, S., & Jayachandran, K., 2009. Analysis of rhamnolipid biosurfactants produced through submerged fermentation using orange fruit peelings as sole carbon source. Appl. Biochem. Biotechnol. 158, 694-705.
[17] Gudiña, EJ., Rodrigues, AI., Alves, E., Domingues, MR., Teixeira, JA., Rodrigues, LR., 2015. Bioconversion of agro-industrial by-products in rhamnolipids toward applications in enhanced oil recovery and bioremediation. Bioresour. Technol. 177, 87–93.
[18] He, S., Ni, Y., Lu, L., Chai, Q., Yu, T., Shen, Z., Yang, C., 2020. Simultaneous degradation of n-hexane and production of biosurfactants by Pseudomonas sp . strain NEE2 isolated from oil-contaminated soils. Chemosphere. 242, 125237.
[19] Jain, RM., Mody, K., Mishra, A., Jha, B., 2012. Physicochemical characterization of biosurfactant and its potential to remove oil from soil and cotton cloth Carbohydr. Polym. 89, 1110–1116.
[20] Lan, G., Fan, Q., Liu, Y., Chen, C., Li, G., Liu, Y., Yin, X., 2015. Rhamnolipid production from waste cooking oil using Pseudomonas SWP-4. Biochem. Eng. J. 101, 44–54.
[21] Lotfabad, TB., Abassi, H., Ahmadkhaniha, R., Roostaazad, R., Masoomi, F., Zahiri, HS., Ahmadian, G., Vali, H., Noghabi, KA., 2010. Structural characterization of a rhamnolipid-type biosurfactant produced by Pseudomonas aeruginosa MR01: Enhancement of di-rhamnolipid proportion using gamma irradiation. Colloids Surf. B. 81, 397–405.
[22] Luna, JM., Rufino, RD., Sarubbo, LA., Campos-Takaki, GM., 2013. Characterisation, surface properties and biological activity of a biosurfactant produced from industrial waste by Candida sphaerica UCP0995 for application in the petroleum industry. Colloids Surfaces B Biointerfaces. 102, 202–209.
[23] Macdonald, CR., Cooper, DG., Zajic, JE., 1981. Surface-active lipids from Nocardia erythropolis grown on hydrocarbons. Appl. Environ. Microbiol. 41, 117–123.
[24] Meylheuc, T., Van Oss, CJ., Bellon-Fontaine MN., 2001. Adsorption of biosurfactant on solid surfaces and consequences regarding the bioadhesion of Listeria monocytogenes LO28. J. Appl. Microbiol. 91, 822–832.
[25] Mishra, S., & Singh, S. N., 2012. Microbial degradation of n-hexadecane in mineral salt medium as mediated by degradative enzymes. Bioresource technology, 111, 148-154.
ISSN 2348-313X (Print) International Journal of Life Sciences Research ISSN 2348-3148 (online) Vol. 9, Issue 1, pp: (47-66), Month: January - March 2021, Available at: www.researchpublish.com
[26] Mittal, A., & Singh, P. 2009. Studies on biodegradation of crude oil by Aspergillus niger. The South Pacific Journal of Natural and Applied Sciences, 27(1), 57-60.
[27] Mulligan, CN., Cooper, DG., Neufeld, RJ., 1984. Selection of microbes producing biosurfactants in media without hydrocarbons. J. Ferment. Technol. 62, 311–314.
[28] Onur, G., Yilmaz, F., & Icgen, B., 2015. Diesel oil degradation potential of a bacterium inhabiting petroleum hydrocarbon contaminated surface waters and characterization of its emulsification ability. J Surfactants Deterg, 18(4), 707-717.
[29] Patel, RM., Desai, AJ., 1997. Biosurfactant production by Pseudomonas aeruginosa GS3 from molasses. Appl. Microbiol. 25, 91–94.
[30] Pathak, KV., & Keharia, H., 2014. Application of extracellular lipopeptide biosurfactant produced by endophytic Bacillus subtilis K1 isolated from aerial roots of banyan (Ficus benghalensis) in microbially enhanced oil recovery ( MEOR ), 3 Biotech. 4, 41–48.
[31] Patowary, K., Patowary, R., Kalita, M. C., & Deka, S. 2017. Characterization of biosurfactant produced during degradation of hydrocarbons using crude oil as sole source of carbon. Frontiers in microbiology, 8, 279.
[32] Patowary, R., Patowary, K., Kalita, MC., Deka, S., 2016. Utilization of Paneer Whey Waste for Cost-Effective Production of Rhamnolipid Biosurfactant. Appl. Biochem. Biotechnol. 180, 383–399.
[33] Pornsunthorntawee, O., Wongpanit, P., Chavadej, S., Abe, M., 2008. Structural and physicochemical characterization of crude biosurfactant produced by Pseudomonas aeruginosa SP4 isolated from petroleumcontaminated soil. Bioresour. Technol. 99, 1589–1595.
[34] Radzuan, MN., Banat, IM., Winterburn, J., 2017. Production and characterization of rhamnolipid using palm oil agricultural refinery waste. Bioresour. Technol. 225, 99–105.
[35] Rahim, R., Ochsner, UA., Olvera, C., Graninger, M., Messner, P., Lam, JS., Soberón-Chávez, G., 2001. Cloning and functional characterization of the Pseudomonas aeruginosa rhlC gene that encodes rhamnosyltransferase 2, an enzyme responsible for di-rhamnolipid biosynthesis. Mol. Microbiol. 40, 708–718.
[36] Rocha e Silva, NMP., Rufino, RD., Luna, JM., Santos, VA., Sarubbo, LA., 2014. Screening of Pseudomonas species for biosurfactant production using low-cost substrates. Biocatal. Agric. Biotechnol. 3, 132–139.
[37] Rodrigues, LR., Teixeira, JA., van der Mei, HC., Oliveira, R., 2006. Physicochemical and functional characterization of a biosurfactant produced by Lactococcus lactis 53. Colloids Surf. B. 49, 79–86.
[38] Rudden, M., Tsauosi, K., Marchant, R., Banat, IM., Smyth, TJ., 2015. Development and validation of an ultraperformance liquid chromatography tandem mass spectrometry (UPLC-MS/MS) method for the quantitative determination of rhamnolipid congeners. Appl. Microbiol. Biotechnol. 99, 9177–9187.
[39] Sathi Reddy, K., Yahya Khan, M., Archana, K., Gopal Reddy, M., Hameeda, B., 2016. Utilization of mango kernel oil for the rhamnolipid production by Pseudomonas aeruginosa DR1 towards its application as biocontrol agent. Bioresour. Technol. 221, 291–299.
[40] Siegmund, I., Wagner, F., 1991. New method for detecting rhamnolipids excreted by Pseudomonas species during growth on mineral agar. Biotechnol. Tech 5, 265–268.
[41] Silva, EJ., Rocha e Silva, NMP., Rufino, RD., Luna, JM., Silva, RO., Sarubbo, LA., 2014 Characterization of a biosurfactant produced by Pseudomonas cepacia CCT6659 in the presence of industrial wastes and its application in the biodegradation of hydrophobic compounds in soil. Colloids Surf. B. 117, 36–41.
[42] Silva, EJ., Silva, IA., Brasileiro, PPF., Correa, PF., Almeida, DG., Rufino, RD., Luna, JM., Santos, VA., Sarubbo, LA., 2019. Treatment of oily effluent using a low-cost biosurfactant in a flotation system. Biodegradation. 30, 335–350.
[43] Silva, SNRL., Farias, CBB., Rufino, RD., Luna, JM., Sarubbo, LA., 2010. Glycerol as substrate for the production of biosurfactant by Pseudomonas aeruginosa UCP0992. Colloids Surf. B. 79, 174–183.
ISSN 2348-313X (Print)
International Journal of Life Sciences Research ISSN 2348-3148 (online) Vol. 9, Issue 1, pp: (47-66), Month: January - March 2021, Available at: www.researchpublish.com
[44] Singh, AK., & Cameotra, SS., 2013. Rhamnolipids production by multi-metal-resistant and plant-growth-promoting rhizobacteria. Appl. Biochem. Biotechnol. 170, 1038–1056.
[45] Suthar, H., Hingurao, K., Desai, A., Nerurkar, A., 2008. Evaluation of bioemulsifier mediated Microbial Enhanced Oil Recovery using sand pack column. J. Microbiol. Methods. 75, 225–230.
[46] Varjani, SJ., Upasani, VN., 2016a. Biodegradation of petroleum hydrocarbons by oleophilic strain of Pseudomonas aeruginosa NCIM 5514. Bioresour. Technol. 222, 195–201.
[47] Varjani, SJ., Upasani, VN., 2016b. Core Flood study for enhanced oil recovery through ex-situ bioaugmentation with thermo- and halo-tolerant rhamnolipid produced by Pseudomonas aeruginosa NCIM 5514. Bioresour. Technol. 220, 175–182.
[48] Wei, YH., Chou, CL., Chang, JS., 2005. Rhamnolipid production by indigenous Pseudomonas aeruginosa J4 originating from petrochemical wastewater. Biochem. Eng. J. 27, 146–154.
[49] Youssef, N., Elshahed, MS., Mcinerney, MJ., 2009. Chapter 6 - Microbial Processes in Oil Fields: Culprits, Problems, and Opportunities, 1st ed., Elesvier Inc.
[50] Zhao, F., Zhang, J., Shi, R., Han, S., Ma, F., Zhang, Y., 2015. Production of biosurfactant by a Pseudomonas aeruginosa isolate and its applicability to in situ microbial enhanced oil recovery under anoxic conditions. RSC Adv. 5, 36044–36050.
[51] Zheng, T., Xu, YS., Yong, XY., Li, B., Yin, D., Cheng, QW., Yuan, HR., Yong, Y.C., 2015. Endogenously enhanced biosurfactant production promotes electricity generation from microbial fuel cells. Bioresour. Technol. 197, 416–421.
[52] Zhou, Q., Takenaka, S., Murakami, S., Seesuriyachan, P., Kuntiya, A., Aoki, K., 2007. Screening and Characterization of Bacteria That Can Utilize Ammonium and Nitrate Ions Simultaneously under Controlled Cultural Conditions. J. Biosci. Bioeng. 103, 185–191.
Figures
ISSN 2348-313X (Print)
International Journal of Life Sciences Research ISSN 2348-3148 (online) Vol. 9, Issue 1, pp: (47-66), Month: January - March 2021, Available at: www.researchpublish.com
Fig. 2. Neighbor-joining phylogenetic tree of strain PU1 based on 16S rRNA gene sequence.
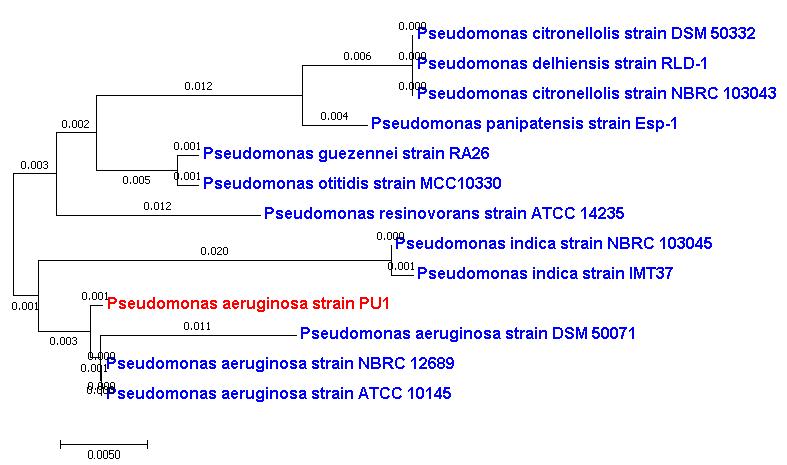
Fig. 3. Determination of CMC of the biosurfactant extracted from P. aeruginosa PU1.
ISSN 2348-313X (Print)
International Journal of Life Sciences Research ISSN 2348-3148 (online) Vol. 9, Issue 1, pp: (47-66), Month: January - March 2021, Available at: www.researchpublish.com
Fig. 4. Analysis of the degradation of various oils by P. aeruginosa PU1 using gravimetric method (AC = abiotic control; T = P. aeruginosa PU1 treated).
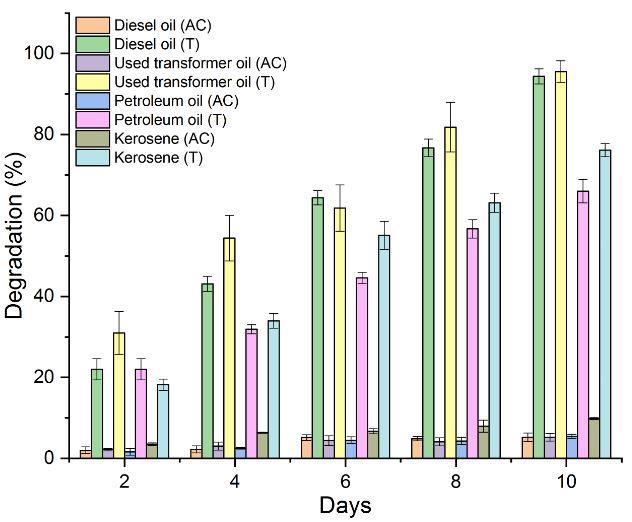
Fig. 5. Characterization of the biosurfactant. (A) TLC of the purified biosurfactant was performed using the mobile phase chloroform:methanol:water (65:25:4). The TLC plate was developed using anisaldehyde, H2SO4 and glacial acetic acid (5:1:50) by heating the plate to 100 ˚C for 5 min. (B) Determination of the ionic nature of purified biosurfactant produced by P. aeruginosa PU1.
ISSN 2348-313X (Print)
International Journal of Life Sciences Research ISSN 2348-3148 (online) Vol. 9, Issue 1, pp: (47-66), Month: January - March 2021, Available at: www.researchpublish.com
Fig. 6. FT-IR analysis of the purified biosurfactant from P. aeruginosa PU1.
Fig. 7. 1H NMR spectrum of purified biosurfactant from P. aeruginosa PU1.
ISSN 2348-313X (Print)
International Journal of Life Sciences Research ISSN 2348-3148 (online) Vol. 9, Issue 1, pp: (47-66), Month: January - March 2021, Available at: www.researchpublish.com
Fig. 8. (A) LC-MS spectrum of rhamnolipid produced from P. aeruginosa PU1 for pseudomolecular ion (m/z) 305 (Rha-C8), (B) pseudomolecular ion (m/z) 361 (Rha-C12), 451 (Rha-Rha-C8) and 505 (Rha-Rha-C12:1: m=8:1), (C) pseudomolecular ion (m/z) 532 (Rha-C10-C12: m=6, n=8; Rha-C12-C10: m=8, n=6) and 621 (Rha-Rha-C8-C10: m=4, n=6; Rha-Rha-C10-C8: m=6, n=4).
ISSN 2348-313X (Print)
International Journal of Life Sciences Research ISSN 2348-3148 (online) Vol. 9, Issue 1, pp: (47-66), Month: January - March 2021, Available at: www.researchpublish.com
Fig. 9. Physical properties of biosurfactant PU1. (A) Thermal analysis of purified biosurfactant from P. aeruginosa PU1. (B) XRD analysis of purified biosurfactant from P. aeruginosa PU1.
ISSN 2348-313X (Print)
International Journal of Life Sciences Research ISSN 2348-3148 (online) Vol. 9, Issue 1, pp: (47-66), Month: January - March 2021, Available at: www.researchpublish.com
Fig. 10. Stability of the biosurfactant PU1 at a concentration of 30 mg/mL at different temperature (A), pH (B) and NaCl concentration (C).
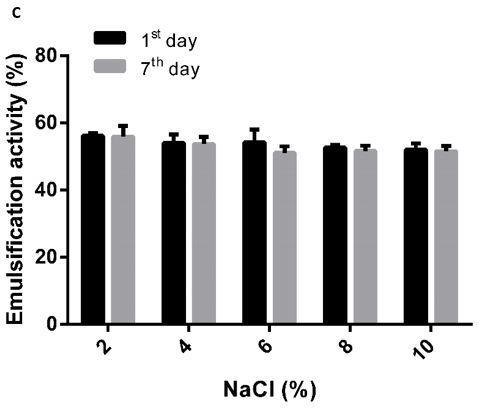
Fig. 11. Oil recovery in sand pack column using crude and purified biosurfactant of P. aeruginosa PU1, SDS and Triton X-100 after brine solution flooding. Pour volume (PV, ml); original oil in place (OOIP, ml); initial oil saturation (Soi, %); initial water saturation (Swi, %); remaining oil saturation (Sor, %); oil recovered after water flooding (Sorwf, ml); oil recovered after biosurfactant flooding (Sorbf, ml); additional oil recovery (AOR, %).
ISSN 2348-313X (Print)
International Journal of Life Sciences Research ISSN 2348-3148 (online) Vol. 9, Issue 1, pp: (47-66), Month: January - March 2021, Available at: www.researchpublish.com
Table 1. Optimization of the carbon and nitrogen source for the optimal production of the biosurfactant by Pseudomonas aeruginosa PU1. The values are expressed as the means of three determinations, with their standard deviations. The mean values (standard deviations) within the same column with different subscripts lowercase letters (a, b and c) differ significantly (p < 0.05).
Substrate Biomass (g/L) Emulsification index (%) Oil spread (cm) Rhamnolipid biosurfactant (g/L)
Molasses (2%) 3.42 ± 0.28c 61.25 ± 2.89c 0.67 ± 0.06b 3.84 ± 0.06c Molasses (4%) 3.92 ± 0.18bc 66.66 ± 2.22b 0.73 ± 0.06b 4.63 ± 0.14b Molasses (6%) 4.39 ± 0.23a 73.93 ± 3.34a 1.00 ± 0.10a 7.24 ± 0.15a Molasses (8%) 4.19 ± 0.43ab 68.41 ± 4.06ab 0.73 ± 0.06b 4.57 ± 0.11b Molasses (10%) 4.04 ± 0.19bc 66.20 ± 2.71b 0.70 ± 0.10b 4.02 ± 0.03c Molasses (6%) + peptone (5%) 4.54 ± 0.06c 74.59 ± 2.76c 0.93 ± 0.06b 7.12 ± 0.07c Molasses (6%) + tryptone (5%) 4.42 ± 0.15c 74.26 ± 3.09c 0.93 ± 0.06b 7.17 ± 0.17c
Molasses (6%) + yeast extract (5%) 4.67 ± 0.22bc 75.85 ± 3.34c 1.07 ± 0.12b 7.24 ± 0.12c Molasses (6%) + beef extract (5%) 4.80 ± 0.04b 77.42 ± 4.25ab 1.07 ± 0.06b 7.86 ± 0.24b Molasses (6%) + ammonium nitrate (5%) 5.30 ± 0.10a 82.72 ± 2.14a 1.37 ± 0.06a 8.92 ± 0.08a
Table 2. Assignments of mass spectral ions obtained in rhamnolipid mixture produced by P. aeruginosa PU1.
S. No. Rhamnolipid congener Molecular Formula Pseudomolecular Ion (m/z)
1 R-C8 C14H26O7 305
2 R-C12 C18H34O7 361 3 R2-C8 C20H36O11 451
4 R2-C12:1 C24H42O11 505 5 R-C10-C12 C28H52O9 532
6 R-C12-C10 C28H52O9 532 7 R2-C8-C10 C30H54O13 621 8 R2-C10-C8 C30H54O13 621