International Journal of Civil and Structural Engineering Research ISSN 2348-7607 (Online) Vol. 10, Issue 1, pp: (38-50), Month: April 2022 - September 2022, Available at: www.researchpublish.com
PRICE DIFFERENTIATION MODEL BETWEEN UNITS FOR VERTICAL HOUSING:ASTUDY OFABUILDING CONSTRUCTION COMPANY
Edilson De Souza Vidal1 , Sérgio Junichi Idehara1,2 Joinville School of Technology
1,2 Federal University of Santa Catarina (UFSC), Joinville, Brazil
DOI: https://doi.org/10.5281/zenodo.6475476
Published date: 21-April-2022
2
Abstract: The use of the internet as a sales channel provides the consumer with information, facilitating the comparison of goods and increasing the already existing competitiveness between companies. The customer chooses by analyzing the products in terms of their attributes and according to the purchasing power. In this sense, an adequate pricing process is essential for any company. In the construction industry, this issue is even more relevant because of the heterogeneity of housing units Furthermore, the high purchase price compared to other products, together with a variety of subjective attributes in the customer's perception, make the pricing process a complex undertaking. Thus, one question would be how to devise a distribution of prices in vertical housing, where the units in a building vary in size, number of rooms and external views. With the aim of defining a price differentiation model between units, this study was carried out based on the price formation process in a construction company in Santa Catarina state, Brazil. With the collected empirical data, a hedonic multivariate linear regression model was developed, with the aim of constructing an automated price differentiation system. The mathematical model showed good results for the numerical adjustment and in its ability to estimate price differentiation based on quantifiable attributes. Thus, it provides evidence of the applicability of the method in the correlation of the client's subjective attributes with the value of residential units in vertical condominiums.
Keywords: Pricing; residential property; numerical method; linear regression.
I. INTRODUCTION
According to [1], civil construction represented 6.5% of the national Gross Domestic Product (GDP) in 2012, but following a decrease in national GDP, it fell to 3.7% in 2019. The outbreak of the Coronavirus (COVID-19) further affected the construction industry, but the sector is referred as a way to downturn the situation ([2]) This economic scenario illustrates the importance of civil construction in regional development, as it can lead to an increase in national income levels and give greater access to durable goods with a higher market value [3]. In addition to construction companies, there are a number of other professions such as designers, realtors and brokers which are instrumental in developing and selling a property, and the role of the real estate agent is also crucial Taking into account these factors, the real market value can be estimated [4] Despite this, numerous other factors and fluctuation in demand may affect the final price, making the pricing process a difficult task.
Recently, easier access to information has become evident through the speed at which communication occurs between people and different sectors of the market. This development brings a high degree of competition, since when making a purchase, the customer has access to a variety of possibilities This starts to regulate the relationship between supply and demand, bringing about a change in real estate prices [5]. As mentioned by [6], the growing use of e-commerce tools and
International Journal of Civil and Structural Engineering Research ISSN 2348-7607 (Online)
Vol. 10, Issue 1, pp: (38-50), Month: April 2022 - September 2022, Available at: www.researchpublish.com
consumer-to-consumer (C2C) platforms have led to increased satisfaction among consumers when buying goods These innovations influence consumer behavior and may enhance their satisfaction with the sellers. In this sense, the issue of pricing of products by companies is becoming increasingly important [7] Companies that do not use these variables in their procedures may be at risk, since they may have an inappropriate pricing policy with prices lower (―under-priced‖) or higher (―over-priced‖) in relation to the value perceived by the customer This situation may have an impact on the marketability of the property, affecting the selling time and the finances of the company [8]
Real estate products have the specific characteristics of being durable and with a long consumer purchase cycle and fixed location compared to other sectors. Properties are assets that have a range of distinct attributes and that are perceived in a variety of ways by consumers They are referred to as composite goods, since comparisons between them must be made in terms of their specific attributes [9]. The attributes or package of characteristics are what define the value as judged by the customer. Choices are made not only considering what exists inside, but also taking into account local amenities, accessibility to the workplace, and public services in the vicinity of the property [10]. The customer's purchase decision is based on his perception of the property’s value, his consideration of the set of attributes, and a number of volatile characteristics [11].
The sale prices of apartment units in a vertical housing development are also influenced by factors relating to the purchase decisions of consumers, which change over time and according to consumers’ characteristics [12] The calculation of the prices of apartments in a building is complex and considers variables such as buying power and market price in addition to the total cost of ownership. Thus, one of the principle challenges is to determine the best price differentiation between apartments, since a building in addition to having a large number of individual units may have many floors, and rooms with a variety of sizes and aspects. Currently, many of the methods employed by companies are based on business principles such as market research This research is based on production costs and return on investment (ROI) goals. Due to a need for methodologies for the adequate distribution of prices for companies in the construction industry, this study aimed to develop a differentiation model for the pricing of apartments in residential buildings, using mathematical modeling and parameter adjustment with numerical multivariate regression tools. The mathematical approach to pricing with hedonic models is already being applied in the market to gain a better understanding of the relationship between demand and supply and the influence of attributes on customer preference, as described by [13] and [14]
II. PROPERTY PRICING
The method of pricing of a product varies for each company and can be influenced by several factors, such as environment, profit margin and competition, among others. For example, [15] found a correlation between the pre-sale prices of apartments, taking into account attributes such as the number of towers in the design, local taxes and the level of development of the neighborhood. However, the fixing of prices is not always based on a specific methodology but is guided by the values practiced by the market or simplified by a mark-up evaluation [16]. This form of pricing, although common, can lead to inappropriate values, causing the products to have a lower selling speed or even stagnate in the market stock. This illustrates the importance of an adequate pricing methodology and how much it can affect the company's sustainability in a volatile economic environment, as mentioned by [17] regarding the importance of risk in the pricing process. The authors emphasize the use of market sentiment and risk to model the real estate market yields. In view of this, market research is conducted as part of the pricing process, with customers being asked questions such as ―what price would you not pay (since it would be outside the family budget or you would not see enough value in the product)?‖ [18]
The literature presents several pricing methods, and the dependent factors can be divided into internal and external variables. The internal ones are related to the costs, expenses and the profit margin (mark-up), whereas the external ones concern the competition, the value perceived by the customers, and their purchasing intentions [19]. In [20], two ways of pricing the product are cited one uses cost plus profit margin and the other is based on cost targets. According to [21], pricing strategies can usually be categorized into three large groups: cost-based pricing, prices based on competition, and prices based on the customer’s perception of the value. Companies need certain information before applying a pricing methodology, such as customer demand scheduling, cost function and competitors' prices [22]. Similar to previous studies, the author describes a number of methodologies for price formation, such as mark-up price, target return price, perceived value price and market price. In general, three main methods can be identified for pricing real estate: (1) using the average of real estate prices over a period, which disregards the variables of heterogeneity and frequency of sales, (2) basing prices on the latest sales of similar properties, the heterogeneity control of which is more favorable, and (3) by
International Journal of Civil and Structural Engineering Research ISSN 2348-7607 (Online)
Vol. 10, Issue 1, pp: (38-50), Month: April 2022 - September 2022, Available at: www.researchpublish.com
applying statistical techniques to correlate price and quality differences (attributes) through hedonic characteristics. The latter can lead to greater understanding and control of real estate pricing; however, it requires the collection of detailed information about the market and the product itself [23]
A. Numerical Methods in Pricing
The general theory of hedonic models was introduced by [24] and [25]. The first author considered the relationships between individuals, goods and characteristics, while the second evaluated an approach to hedonic prices through a mathematical function, creating a relationship of dependence between the characteristics and the price of the commodity For [26], it is assumed that the group of attributes contained in a commodity and not the commodity itself will enable the consumer's desires to be met The set of attributes is then chosen according to the consumer's needs, and this will provide the model constraints. Following the author's definition, the commodity is then expressed as a function of its attributes. According to [27], hedonic pricing models use classical regression analyses, where the sales price of a commodity is adjusted according to its attributes. That is, the estimations of the market value arise from the characteristics of this commodity. In this way, the hedonic price function also known as the explicit function determines which are the most significant attributes in establishing the price of a heterogeneous commodity. This relationship is built from a vector of a quantitative parameter such as the price ( ) and the independent variables of the attributes ( ), as described by [28]:
( ) ( ) Eq. 1
According to [29] in the hedonic price approach, the attributes of a product add value to that product in their providing usefulness to consumers In this way, the attributes are part of the value of the commodity and it is possible to observe a relationship between its characteristics and its value. However, they are not evaluated alone but as a combination of attributes. The hedonic approach results in a method that identifies the price structure of the attributes that make up a heterogeneous good through the estimation of the function that relates the price of that good with the prices of the different attributes of that product (implicit prices). According to [30], there are several modelling techniques for a numerical problem, which depend on the system evaluated for the resolution; these include exact methods and non-exact (heuristic and meta-heuristic) methods. The meta-heuristic method is a solution strategy to the heuristic processes and, in general, has good numerical performance, but requires knowledge of mathematical techniques and availability of high computational processing capability [31] employs these techniques through data taken from internet advertisements to train a machine learning algorithm. This algorithm was able to estimate real estate prices in the city of Natal, Brazil. The author concludes that the variables for the prediction model were found, but the attributes collected had little influence on the final result, indicating possible difficulties in adjusting the pricing model with the available attributes.
The multiple linear regression technique is one such exact method and was used in the work of [32]. The authors observed the degree of influence and correlation of a set of variables in the prices of residential properties offered for sale and lease in the city of João Monlevade, Brazil. The methodology was based on real information and on the characteristics of the properties, such as the number of rooms and parking spaces, the number of police incidents, and the distance from the shopping center, among other variables. According to the authors, although the coefficient of determination (R²) was low, it was possible to obtain a set of mathematical equations capable of adjusting the price as a function of the analyzed variables and evaluating the correlation between them. Additionally, [33] used multiple linear regression to predict the prices of houses for sale in the city of Paranaíba, Brazil according to their characteristics. That model was based on the land area, the number of rooms and the state of conservation. The model showed good results in terms of prediction, and the authors suggest constant updating is necessary so that it remains significant given the dynamics of the Brazilian real estate market.
B. Builders' Pricing Methodology
The pricing of housing units can be based on a number of concepts, such as cost and profit margin, suggested market price, and price perceived by the customer (hedonic); it can also be based on a combination of these variables, as already mentioned by [12]. The process of compiling a price list begins with determining the financial viability of the enterprise in terms of costs This includes the Potential Sales Value (PSV) that the enterprise must have in order to reach the profit margin projected by the company, as described in the work by [34] Usually, the feasibility study is carried out by the real estate development company with support from the financial sector (accounting). This phase may influence the final cost
International Journal of Civil and Structural Engineering Research ISSN 2348-7607 (Online)
Vol. 10, Issue 1, pp: (38-50), Month: April 2022 - September 2022, Available at: www.researchpublish.com
of the enterprise; other phases such as design, contracting and execution are less influential in this regard [35]. The sales administration area would be responsible for the preliminary study of the new venture through the implementation project, verifying factors that may influence the price differentiation of the apartments, such as:
• Sun position (morning/sunrise, afternoon/sunset);
• Number of towers;
• Number of floors;
• Sea view (for buildings located on the coast);
• Number of apartments per floor;
• Number of bedrooms and bathrooms;
• Proximity of the tower to the leisure area;
• Private area;
• Location of the apartment units on the enterprise design
Generally, the analysis is done subjectively, based on experience and common market practices This is the case, for example, with the valuation of designs that have a greater incidence of morning sun and an increase or decrease in value depending on the floor. The valuation by floor depends on the style of the enterprise. When the building has an elevator, it is generally considered that the higher the floor, the higher value the unit will have [36] On the other hand, if the building does not have an elevator, then the higher the floor, the lower the value of the unit. However, there is no evidence of differing levels of appreciation of apartments between buildings of different heights, as mentioned by [37]. The authors have evaluated that the incremental change in the value of the units according to floor is not linear, being smaller between floors on higher levels. Therefore, it would be an important design constraint to measure the height and shape of residential condominiums to obtain an optimized investment return. These characteristics cause the final price of one apartment to differ from another in the same condominium.
The result of the differentiation of price between units is a discrete classification of units, using the value of the base square meter ( ) for pricing. This is done by dividing the total PSV of the design by the total private area (sum of the private areas of all units), so that the value obtained will correspond to the standard classification of 100%. The other classes are arbitrarily defined by the company, being below or above this average value of 100% In Eq. 2, denotes the classification weight. To determine the value of the square meter of these classes, the percentage adopted is multiplied by the value of the base square meter ( ). Finally, the sale price of the units is calculated by multiplying the private area ( ) of apartment with the price per square meter stipulated in the classification. The sum of the individual prices of each unit must result in the PSV itself, as indicated by:
∑
Eq. 2
Pricing strategies may vary according to different companies, as highlighted by [38] Nevertheless, the pricing classification is subject to the decisions and intentions of a particular company. This methodology involves the subjective valuation of each unit, taking into account measurable characteristics, such as the private area and number of bedrooms, or abstract characteristics, such as the extent of the sea view or amount of sunlight. This makes the process slower and more dependent on the people performing the pricing. Therefore, there is a need for greater independence and automation of the methodology for price differentiation of units of the same enterprise, as well as for a standardization of results between different products.
III. METHOD
The formulation of the problem of a multivariate regression considers that the physical and constructive characteristics have a linear correlation with the value of the housing unit ([39]), following an equation such that
International Journal of Civil and Structural Engineering Research ISSN 2348-7607 (Online) Vol. 10, Issue 1, pp: (38-50), Month: April 2022 - September 2022, Available at: www.researchpublish.com
where , - is the matrix of the input data of the characterization of the unit, which are the independent variables, and * + is the output vector, representing the unit pricing and dependent on the attributes in , -. The vector * + is the regression coefficients and represents the modeling parameters of the system. For a number of units and characteristics (attributes), the matrix equation can be written as:
Eq. 4
[ ] { } { }
The last term of the matrix , - of * + is a unit vector so that represents the independent term of the equation. The other coefficients indicate the slope of the plane in the Euclidean space , formed by the evaluated attributes. The solution of this system of equations, * + , is obtained from the normal equation:
, - , - * + , - * + Eq. 5
The solution in Eq. 6 represents the global minimum where the coefficients adjust the pricing model based on information on the characteristics of housing units ( ) and sales prices ( ), which in this case represents the proportional classification value of each unit
* + (, - , - ) , - * + Eq. 6
where , - is the transposed matrix of the input data and , - is the inverse of the matrix.
A. Case study
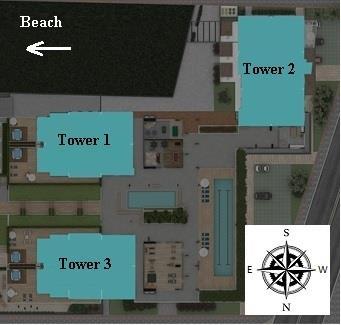
The case evaluated in this work is a vertical residential condominium developed by a construction company in Santa Catarina state (Brazil), close to the beach, with a sales launch of 3 towers taking place in December 2019. In total, the design comprises 296 units, with 98 units in Tower 1, 100 units in Tower 2 and 98 units in Tower 3. Each tower has 16 floors each containing 6 units plus the ground floor. Fig 1 is an illustration of the design and the layout of the buildings. The total land area is around nine thousand square meters and the condominium has a number of leisure facilities, such as a swimming pool and a recreation area.
FIG. 1: LAYOUT OF THE PROJECT'S TOWERS IN SANTA CATARINA.
Publish Journals
International Journal of Civil and Structural Engineering Research ISSN 2348-7607 (Online)
Vol. 10, Issue 1, pp: (38-50), Month: April 2022 - September 2022, Available at: www.researchpublish.com
In order to perform the linear regression, it was necessary to mathematically describe the attributes of the product. The first step was to list the main items used subjectively in the company's current pricing model. The selected attributes are shown in Table 1, together with their respective meanings. Nine items were selected for analysis. Among these can be seen both quantitative parameters private area, floor number, number of bedrooms and number of garages and qualitative parameters morning sun, spatial vision, afternoon sun, sea view and sun exposure. In the case of spatial vision and sea view, a scale comprising three possible values was used for the classification: zero (0.0), half (0.5) and one (1.0). For spatial vision, which indicates whether there are structures obscuring the view from the apartment, the value can vary from free (1.0) to partial (0.5) to without view (0.0), where ―free‖ is the best view and ―without view‖ the worst view. Similarly, sea view denotes the extent to which the unit affords views of the sea. The other non-quantitative attributes were classified according to a scale of two possible values, as shown in Table 2. The classification of each housing unit was adopted manually during the pre-processing of the data by the company responsible for the pricing of the apartments.
TABLE 1: LIST OF ATTRIBUTES SELECTED FOR PRICE DIFFERENTIATION OF HOUSING UNITS.
Attributes Description
1 Area
Dimensions of the unit's private area
2 Floor Floor number where the apartment is located
3 # Bedrooms
Number of bedrooms in the unit
4 Morning sun Whether the unit receives sunlight in the morning (summer)
5 Spatial vision Whether the view from the apartment is clear, good, and unobstructed by other buildings
6 Afternoon sun Whether the unit receives sunlight in the afternoon (summer)
7 Sea view Whether the unit has a sea view
8 Garage Number of garages available to the unit
9 Sun exposure Period that the unit receives the most sunlight
TABLE 2: QUANTIFICATION USED FOR SUBJECTIVE ATTRIBUTES.
Morning sun 1 (yes) 0 (no)
Afternoon sun 1 (yes) 0 (no)
Spatial vision 1 (unobstructed) 0.5 (partial vision) 0 (obstructed)
Sea view 1 (yes) 0.5 (lateral view) 0 (no)
Sun exposure 1 (morning) 0.5 (afternoon)
Quantitative items, such as private area, were normalized according to the highest value of the attribute. For example, if 120 m² is the largest private area, it corresponds to the maximum value of 1.0, and the values of the other units are divided by 120. The same normalization procedure was applied to other items, such as number of bedrooms, garage spaces and floor. The matrix , -, containing the information on the attributes per unit, is assembled in the sequence shown in Table 3. The table displays 24 lines of the original matrix , -, presented as an example. The output vector with differentiation in prices, * +, is the percentage value ( ) applied in the classification of each unit employed by the company from the usual pricing process from Eq. 2
B. Model tuning and validation
The model adjustment was made using data from Tower 1 to determine the regression coefficients by Eq. 6. These coefficients also indicate the sensitivity of each attribute in influencing the unit's selling price. With the model fitted, these coefficients were tested with data from towers 2 and 3, evaluating the quality to predict the company's original price differentiation. In this work, the calculations were performed using MATLAB software. As an assessment of the fit, the coefficient of determination (r-squared) was calculated. This coefficient describes the proportion of variance in the dependent variables related to the independent variable, formulated by:
Eq. 7
Where is the average of the price differentiation of all housing units and is the housing unit. The closer is to 1.0 (100%), the better the model fits the modeling input.
International Journal of Civil and Structural Engineering Research ISSN 2348-7607 (Online) Vol. 10, Issue 1, pp: (38-50), Month: April 2022 - September 2022, Available at: www.researchpublish.com
TABLE 3: SECTION OF THE DATA INPUT MATRIX, CONTAINING 24 HOUSING UNITS OF TOWER 1. THE REAL VALUE IS GIVEN IN BRACKETS
Area Floor # Bedrooms Morning sun Spatial vision Afternoon sun Sea view Garage Sun exposure
0 99 0 06 (1) 1 00 (4) 1 00 1 00 1 00 1 00 0 67 (2) 1 00
1.00 0.06 (1) 1.00 (4) 1.00 1.00 1.00 1.00 0.67 (2) 0.50
0 55 0 06 (1) 0 50 (2) 1 00 1 00 0 00 0 50 0 33 (1) 1 00
0 55 0 06 (1) 0 50 (2) 0 00 1 00 1 00 0 50 0 33 (1) 0 50
0 68 0 06 (1) 0 75 (3) 1 00 1 00 0 00 0 50 0 33 (1) 1 00
0.68 0.06 (1) 0.75 (3) 0.00 1.00 1.00 0.50 0.33 (1) 0.50
0 99 0 12 (2) 1 00 (4) 1 00 1 00 1 00 1 00 1 00 (3) 1 00
1 00 0 12 (2) 1 00 (4) 1 00 1 00 1 00 1 00 0 67 (2) 0 50
0 55 0 12 (2) 0 50 (2) 1 00 1 00 0 00 0 50 0 33 (1) 1 00
0.55 0.12 (2) 0.50 (2) 0.00 1.00 1.00 0.50 0.33 (1) 0.50
0 68 0 12 (2) 0 75 (3) 1 00 1 00 0 00 0 50 0 33 (1) 1 00
0 68 0 12 (2) 0 75 (3) 0 00 1 00 1 00 0 50 0 33 (1) 0 50
0 99 0 18 (3) 1 00 (4) 1 00 1 00 1 00 1 00 0 67 (2) 1 00
1.00 0.18 (3) 1.00 (4) 1.00 1.00 1.00 1.00 0.67 (2) 0.50
0 55 0 18 (3) 0 50 (2) 1 00 1 00 0 00 0 50 0 33 (1) 1 00
0 55 0 18 (3) 0 50 (2) 0 00 1 00 1 00 0 50 0 33 (1) 0 50
0 68 0 18 (3) 0 75 (3) 1 00 1 00 0 00 0 50 0 33 (1) 1 00
0.68 0.18 (3) 0.75 (3) 0.00 1.00 1.00 0.50 0.33 (1) 0.50
0 99 0 24 (4) 1 00 (4) 1 00 1 00 1 00 1 00 0 67 (2) 1 00
1 00 0 24 (4) 1 00 (4) 1 00 1 00 1 00 1 00 0 67 (2) 0 50
0 55 0 24 (4) 0 50 (2) 1 00 1 00 0 00 0 50 0 33 (1) 1 00
0.55 0.24 (4) 0.50 (2) 0.00 1.00 1.00 0.50 0.33 (1) 0.50
0 68 0 24 (4) 0 75 (3) 1 00 1 00 0 00 0 50 0 33 (1) 1 00
0 68 0 24 (4) 0 75 (3) 0 00 1 00 1 00 0 50 0 33 (1) 0 50
IV. RESULTS AND DISCUSSIONS
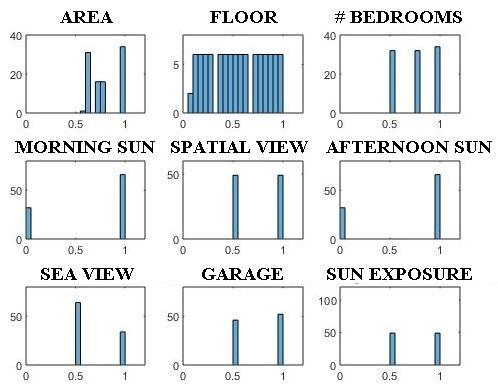
The model adjustment is made from the information of Tower 1, as described in the method section For characterization, the data contained in the attributes are presented in Figs. 2 & 3 as a histogram with the frequency distribution and a boxplot of variability in price differentiation as a function of floor (a) and number of bedrooms (b), respectively. In Fig. 2, the histogram of the attributes displays a relatively uniform distribution of the classes, since several characteristics are repeated across floors number of bedrooms and garage spaces, for example Nevertheless, for some attributes such as area, solar incidence and sea view greater differences are revealed. These are parameters influenced by the constructive design of the tower and the layout of the whole development. Therefore, in the model of price differentiation between units, these parameters could potentially influence the final values. FIG. 2: HISTOGRAM OF INFORMATION ON
THE ATTRIBUTES OF TOWER 1, USED TO ADJUST THE MODEL
Publish Journals
International Journal of Civil and Structural Engineering Research ISSN 2348-7607 (Online) Vol. 10, Issue 1, pp: (38-50), Month: April 2022 - September 2022, Available at: www.researchpublish.com
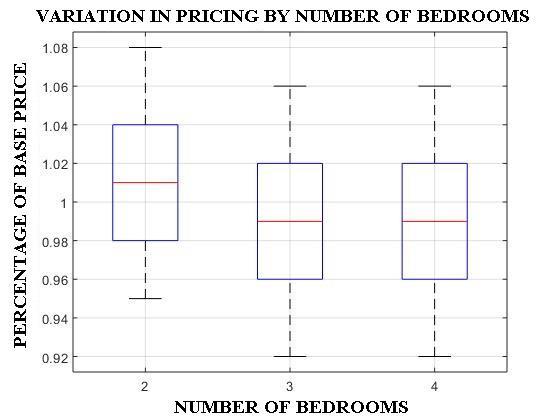
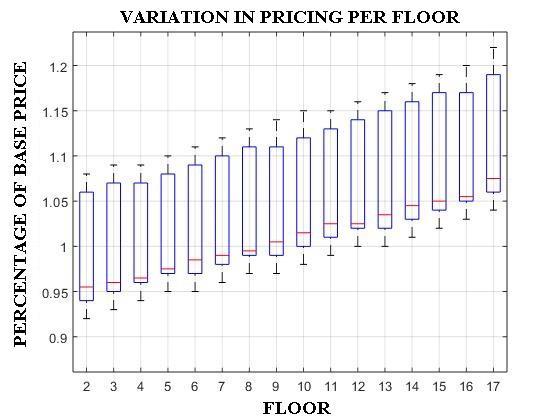
The distribution in the boxplot in Fig. 3a indicates that the price differentiation of the unit increases with the floor level, as can be seen by the increase in the median with each higher floor. Also, the variation of this differentiation, seen between the lower and upper quartiles for a given floor, is considerable, but approximately constant from one floor to another. As for the differentiation in pricing by the number of bedrooms (Fig. 3b), there is little variation in the median between two-, three- or four-bedroom units. However, the price of two-bedroom units was slightly higher than that of three- and four-bedroom units, as illustrated by the limits of the first and third quartiles. This price profile is established by differentiating the prices of the apartments according to the criteria that the company adopts in the commercialization of its products.
FIG. 3: BOXPLOT OF THE FLOOR NUMBER (a) AND NUMBER OF ROOMS (b) DUE TO THE DIFFERENTIATION IN THE PRICING OF UNITS IN TOWER 1.
A. Adjustment by linear regression (Tower 1)
The input data is the set of attributes in matrix , -; in this case it is a matrix of 98 x 10, with each row representing a unit of the enterprise, and the columns containing the data of each attribute (9 columns) with an additional column vector of those presented previously. The output variable * + is a 98 x 1 column vector that contains the pricing percentages generated by the company with real data from the enterprise. The regression coefficients, which represent the model of the price differentiation, were determined by Eq. 6 and presented in Table 4. The R² found for the adjustment was 99.55%, demonstrating that the model has relatively high accuracy and achieves the estimation of the original pricing. The value of PSV for Tower 1 of Eq. 2 resulted in a difference of 0.16% in relation to the original PSV ($12.660.227,00), obtaining an overall result similar to the original data.
The differentiated pricings were estimated by the regression model, multiplying these coefficients by the data matrix , -. Then, the total number of units that are correct in the estimate with a maximum of 5% variation in relation to the original data as an acceptable variation reference was used to assess the degree of proximity between the actual and estimated data. In this count, it was found that all samples (100%) were correct in relation to the real data, reflecting the high degree of precision of the adjusted model. From the quality of the fit, it can be inferred that the attributes selected to represent the price differentiation between apartments are suitable for the model.
International Journal of Civil and Structural Engineering Research ISSN 2348-7607 (Online) Vol. 10, Issue 1, pp: (38-50), Month: April 2022 - September 2022, Available at: www.researchpublish.com
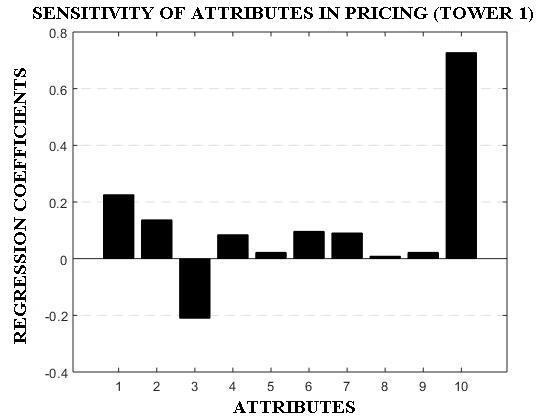
Fig. 4 shows the values of the coefficients found in the linear regression for each pricing item in the form of a bar graph. The abscissa represents the attributes and the ordinate represents the values of the coefficients obtained for each item. The higher the absolute value of the coefficient, the greater its relevance in the price differentiation, and the lower the value, the lower its impact on the price differentiation. The coefficient that has a negative value is inversely proportional to pricing, and positive coefficients are directly proportional. The first three attributes private area (1), floor (2) and bedroom (3) have higher coefficient values, indicating that they have a greater influence on price differentiation between units. However, the dependence on the number of rooms is inversely proportional as it is negative. This trend has already been observed in the analysis of Fig. 3b. Attributes 4, 6 and 7 related to solar incidence and sea view have positive and similar amplitudes. The other parameters (5, 8 and 9) have less relevance in the pricing of the units. The last coefficient (10) is a numerical term of the adjustment and is not associated with the physical parameters of the design
FIG. 4: SENSITIVITY LEVEL OF ATTRIBUTES IN DIFFERENTIATING PRICING BETWEEN HOUSING UNITS
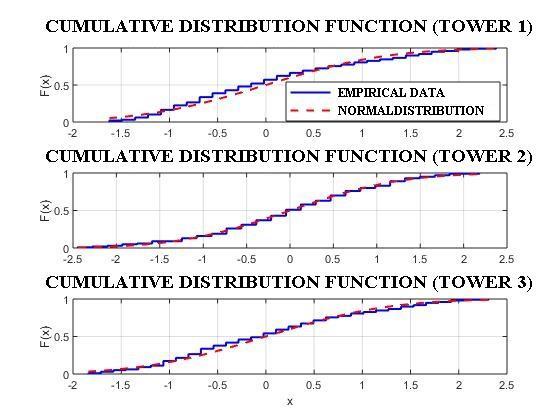
The probability distribution of pricing differentiation data is similar to a normal distribution. To verify this hypothesis, the Kolmogorov-Smirnov test was used for the null hypothesis of a Gaussian distribution. The results of processing of the values of the three towers is shown in Fig. 5. The solid blue curve is the cumulative distribution function of the price differentiation data and the dashed red curve is the reference, that would be obtained for a normal distribution For all of the three towers, the empirical curve is close to the theoretical one, indicating a tendency of the data to follow a Gaussiantype distribution profile. The P-value obtained in each one was 28.63%, 94.07% and 43.29% for Tower 1, 2 and 3, respectively. These values indicate that the price differentiation data can be represented by a normal distribution. Thus, analysis of variance (ANOVA) can be performed to compare the percentages of differentiation in the pricing of the original and estimated units. In this case, single-factor ANOVA was used for Tower 1. The means and variances are presented in Table 5, and the resulting P-value was 99.96%, indicating hypothesis H0 to be correct; thus, there is no statistical difference between the two data (empirical and estimated).
International Journal of Civil and Structural Engineering Research ISSN 2348-7607 (Online) Vol. 10, Issue 1, pp: (38-50), Month: April 2022 - September 2022, Available at: www.researchpublish.com
FIG. 5: CUMULATIVE DISTRIBUTION FUNCTION OF THE PRICE DIFFERENTIATION DATA OF TOWERS 1, 2 AND 3.
B. Model validation as a predictor (Towers
2 and 3)
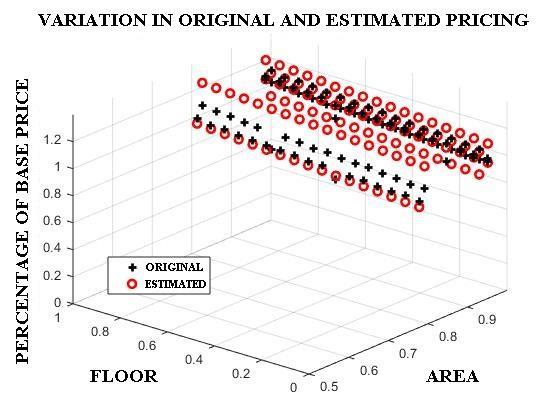
The coefficients found in the case of Tower 1 were used to obtain a new differentiation of pricing between units for Towers 2 and 3. That is, a new pricing index was obtained for the units of the development, applying the adjusted model of Tower 1 to the input data of Towers 2 and 3. In the analysis of the proximity of the estimated value to the original value, it was found that 47.0% (Tower 2) and 94.9% (Tower 3) of the units fell within a difference threshold of less than 5% of the empirical value. Fig. 6 presents a three-dimensional graph of pricing, area and floor position to illustrate the distance between the sample and the estimate. Table 6 displays the results (for Towers 2 and 3) of verification of the statistical equivalence between the original and estimated data using ANOVA. Since the P-value is above 5% for both towers, it can be inferred that, statistically, there is no significant difference between the pricing percentage adopted by the company and that predicted by the model. In addition, the difference between the original PSV and the estimated PSV was observed to be -2.61% and -0.17% for Tower 2 and Tower 3, respectively It can be concluded that the model results are very close to the real values in a global assessment, albeit with some variability in the individual estimated values. The difference in the predicted results between Tower 2 and Tower 3 can be attributed to the difference in the position of the towers in relation to the modeling tower (Tower 1). In Fig. 1, it can be seen that Towers 1 and 3 are adjacent to each other and both afford an extensive view of the sea; however, Tower 2 is positioned behind and at a 90° angle to the other two towers, with the view partially being obstructed by the construction of the other towers. These physical differences lead to different pricing strategies for the units of each tower being adopted by the company. In this case, the adjusted model could be used for all towers without having a considerable impact on the final PSV; alternatively, different models could be used depending on the design's layout. Thus, the methodology presented here for differentiating prices between units of the same enterprise is proven to be viable and, furthermore, reduces the subjectivity of the pricing process and the time required for analysis.
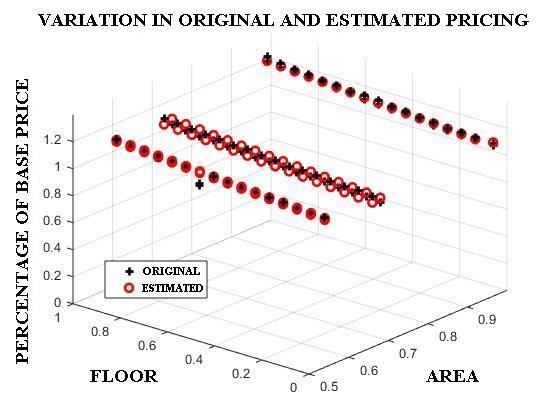
FIG. 6: VIEW OF THE ORIGINAL AND ESTIMATED DATA FOR TOWER 2 (a) AND TOWER 3 (b).
International Journal of Civil and Structural Engineering Research ISSN 2348-7607 (Online) Vol. 10, Issue 1, pp: (38-50), Month: April 2022 - September 2022, Available at: www.researchpublish.com
TABLE 6: STATISTICAL COMPARISON BETWEEN THE ORIGINAL AND ESTIMATED PRICE DIFFERENTIATION IN THE MODEL FOR TOWERS 2 AND 3
Building Pricing
Tower 2
Tower 3
Mean Variance P-Value
Original pricing 0.9827 0.0034 24.82%
Estimated pricing 0.9993 0.0171
Original pricing 1.0419 0.0059 96.28%
Estimated pricing 1.0414 0.0054
V. CONCLUSION
By modeling the company's pricing data, the objective was to develop a methodology for differentiating prices between units in vertical residential condominiums based on a numerical tool. Since the model used had a high correlation of adjustment and prediction in estimating prices based on the quantifiable attributes of the property, it has high potential as a mathematical tool for enabling the automation of the price differentiation process. However, the model presented a significant variation in the individual values of prediction in the comparison between the different towers. This fact can be explained by the difference between the original pricing criteria used by the company in each tower.
The regression model makes it feasible to identify the characteristics that have the greatest influence on the price of the property and on the formation of value as understood by customers purchasing residential units This methodology would help companies in the pricing processes currently used, would provide information for decision making, and would ultimately lead to significant competitive gains in the evaluation and processing of market information. Marketing efforts could be directed toward the specific factors that bring value to customers, the design team could prioritize the most significant features to improve the development of new products, and the sales team could offer solutions with a greater focus on customer needs, among other possibilities. It is clear that the methodology reduces the use of subjectivity and standardizes the pricing process of a company; additionally, it facilitates the improvement of the method, since it reduces the dependence on people with experience.
REFERENCES
[1] DIEESE, ―A Construção Civil e os Trabalhadores: panorama dos anos recentes‖ [Civil construction and workers: overview of recent years], Estudos e Pesquisas, n°.95, 2020.
[2] A. Biswas, A. Ghosh, A. Kar, T. Mondal, B. Ghosh, P. K. Bardhan, ―The impact of COVID-19 in the construction sector and its remedial measures‖, Journal of Physics: Conference Series, 1797, pp. 1-11, 2021.
[3] A. Khaertdinova, A. Maliashova, S. Gadelshina, ―Economic development of the construction industry as a basis for sustainable development of the country‖, E3S Web of Conferences, 274, pp. 1-11, 2021.
[4] C. M. Barresi, ―The role of the real estate agent in residential location‖, Sociological Focus, vol. 1, n°. 4, pp. 59-71, 1968.
[5] N. Rizun, A. Baj-Rogowska, ―Can Web Search Queries Predict Prices Change on the Real Estate Market?‖, IEEE access, vol. 9, pp. 70095-70117, 2021.
[6] Q. Huang, X. Y. Chen, C. Ou, R. M. Davison, Z.S. Hua, ―Understanding buyers' loyalty to a C2C platform: The roles of social capital, satisfaction and perceived effectiveness of E-commerce institutional mechanisms‖, Information Systems Journal, vol. 27, n°. 1, pp. 91-119, 2017.
[7] C. A. C. Abreu, ―Estimating the optimal market price to sell an apartment‖, Ambiente Construído, vol. 18, n°. 4, pp. 319-327, 2018.
[8] P. M. Anglin, R. Rutherford, T. M. Springer, ―The trade-off between the selling price of residential properties and time-on-the-market: the impact of price setting‖, The Journal of Real Estate Finance and Economics, vol. 26, pp. 95–111, 2003.
[9] R. B. Abidoye, A. P. C. Chan, ―Critical determinants of residential property value: professionals’ perspective‖, Journal of Facilities Management, vol. 14, n°. 3, pp. 283-300, 2016.
[10] J. M. Quigley, ―Consumer choice of dwelling, neighborhood and public services‖, Regional Science and Urban Economics, vol. 15, pp. 41-63, 1985
International Journal of Civil and Structural Engineering Research ISSN 2348-7607 (Online) Vol. 10, Issue 1, pp: (38-50), Month: April 2022 - September 2022, Available at: www.researchpublish.com
[11] P. Englund, J. M. Quigley, C. L. Redfearn, ―The choice of methodology for computing housing price indexes: comparisons of temporal aggregation and sample definition‖, Journal of Real Estate Finance and Economics, vol. 1, n°. 1, pp. 91-112, 1999.
[12] Park, D. Lee, S. Kim, ―Feasible sales price decision model of apartment housing units considering the market price and buying power‖, Journal of Asian Architecture and Building Engineering, vol. 15, n°. 2, pp. 202-208, 2016.
[13] J. Hong, H. Choi, W. S. Kim, ―A house price valuation based on the random forest approach: the mass appraisal of residential property in South Korea‖, International Journal of Strategic Property Management, vol. 24, n°. 3, pp. 140-152, 2020.
[14] S. B. Caudill, F. G. Mixon, ―Estimating bargaining power in real estate pricing models: conceptual and empirical issues‖, Journal of Risk and Financial Management, vol. 13, n°. 105, pp. 1-8, 2020.
[15] K. Kim, J. Yun, S. Kim, D. Y. Kim, D. Lee, ―Development of simulation model for proper sales price of apartment house in Seoul‖, Buildings, vol. 10, n°. 244, pp. 1-15, 2020.
[16] Dikmen, M. T. Birgonul, A. K. Gur, ―A case-based decision support tool for bid mark-up estimation of international construction projects‖, Automation in Construction, vol. 17, n°. 1, pp. 30-44, 2007.
[17] T. McGough, J. Berry, ―Pricing risk and its use in modelling real estate market yields‖, Journal of Property Investment & Finance, vol. 38, n°. 5, pp. 419-433, 2020.
[18] C. Breidert, D. Hahsler, T. Reutterer, ―A review of methods for measuring willingness-to-pay‖, Innovative Marketing, vol.2, pp. 8- 32, 2006.
[19] G. Dash, K. Kiefer, J. Paul, ―Marketing-to-Millennials: Marketing 4.0, customer satisfaction and purchase intention‖, Journal of Business Research, vol. 122, pp. 608-620, 2021.
[20] J. Ribeiro, M. C. C. Moraes, R. A. Vieira, V. S. Carvalho, ―Precificação e lucratividade‖ [Pricing and profitability], XIV Congresso Brasileiro De Custos, João Pessoa/PB, pp. 1-10, 2007.
[21] A. Hinterhuber, ―Customer value-based pricing strategies: why companies resist‖, Journal of Business Strategy, vol. 29, n°. 4, pp. 41-50, 2008.
[22] P. Kotler, ―Administração de Marketing‖ [Marketing Administration], 14th ed., São Paulo: Pearson Education, 2012.
[23] Frew, D. Jud, ―Estimating the value of apartment buildings‖, Journal of Real Estate Research, vol. 25, n°. 1, pp. 7786, 2003.
[24] J. Lancaster, ―A New Approach to Consumer Theory‖, Journal of Political Economy, vol. 74, n°. 2, pp. 132-157, 1966.
[25] S. Rosen, ―Hedonic Prices and Implicit Markets: Product Differentiation in Pure Competition‖, Journal of Political Economy, vol. 82, n°. 1, pp. 34-55, 1974.
[26] R. C. Galvão, ―Determinantes do preço sob a ótica do construtor/incorporado: um modelo de precificação hedônico para o mercado imobiliário da cidade de Caruaru-PE‖ [Price determinants from the builder/incorporated perspective: a hedonic pricing model for the real estate market in the city of Caruaru-PE], Recife: Federal University of Pernambuco, 2013.
[27] N. A. Sartoris, ―Estimação de modelos de preços hedônicos: um estudo para residências na cidade de São Paulo‖ [Estimation of hedonic pricing models: a study for homes in the city of São Paulo], São Paulo: University of São Paulo, 1996.
[28] D. Bax, M. G. Chasomeris, ―Listing price estimation of apartments: A generalised linear model‖, Journal of Economic and Financial Sciences, vol. 12, n°. 1, pp. 1-11, 2019.
[29] S. F. Ferreira, M. A. Resende Filho, ―Aplicação do método de preços hedônicos na precificação de atributos raros de peças filatélicas e construção de carteiras eficientes‖ [Application of the hedonic pricing method in the pricing of rare attributes of philatelic pieces and construction of efficient portfolios], Revistas da USP: Estudos Econômicos, São Paulo, vol. 40, n°. 2, Jun. 2010.
International Journal of Civil and Structural Engineering Research ISSN 2348-7607 (Online) Vol. 10, Issue 1, pp: (38-50), Month: April 2022 - September 2022, Available at: www.researchpublish.com
[30] Ram, J. P. Davim, ―Mathematical Concepts and Applications in Mechanical Engineering and Mechatronics‖, Engineering Science Reference, p. 522, 2016.
[31] A. S. Amaral, ―Uma metodologia orientada a dados para precificação de imóveis‖ [A data-driven methodology for real estate pricing], Natal: Federal University of Rio Grande do Norte, 2018.
[32] V. S. Rosa, P. B. Oliveira, R. L. M. Pinto, ―Modelos de precificação para locação e venda de imóveis residenciais na cidade de João Monlevade – MG via regressão linear multivariada‖ [Pricing models for rental and sale of residential properties in the city of João Monlevade - MG via multivariate linear regression], GEPROS. Gestão da Produção, Operações e Sistemas, vol.14, n°.3, pp. 151-167, 2019.
[33] E. G. Araújo et al., ―Modelo de regressão linear múltipla para a predição do preço de imóveis residenciais urbanos no município de Parnaíba – MS‖ [Multiple linear regression model for predicting the price of urban residential properties in the city of Parnaíba - MS], NEXUS Mathematicæ. vol.1, pp. 109-123, 2018.
[34] R. G. Serra, R. Martelanc, A. F. Souza, ―Empreendimentos imobiliários com permuta: avaliação pela abordagem da teoria das opções reais (TOR)‖ [Real estate developments with barter: valuation using the real options theory (ROT) approach], Revista de Gestão e Projetos, vol. 3, n°. 2, pp. 146-177, 2012.
[35] S. Rufino, ―A importância do projeto no empreendimento‖ [The importance of the project in the enterprise], II Congresso De Tecnologia - FATEC-SP, São Paulo, 2000.
[36] S. Conroy, A. Narwold, J. Sandy, ―The value of a floor: valuing floor level in high-rise condominiums in San Diego‖, International Journal of Housing Markets and Analysis, vol. 6, n°. 2, pp.197-208, 2013.
[37] S. K. Wong, K. W. Chau, Y. Yau, A. K. C. Cheung, ―Property price gradients: the vertical dimension‖, Journal of Housing and the Built Environment, vol. 26, pp. 33–45, 2011.
[38] A.O. Czesnat, T. T. Quintas, J. E. Scarpin, ―Formação de preço nas empresas de construção civil da cidade de Balneário Camboriú – SC‖ [Price formation in civil construction companies in the city of Balneário Camboriú –SC], Revista del Instituto Internacional de Costos, nº 5, julio/diciembre 2009.
[39] D. Wittowsky, J. Hoekveld, J. Welsch, M. Steier, ―Residential housing prices: impact of housing characteristics, accessibility and neighbouring apartments – a case study of Dortmund, Germany‖, Urban, Planning and Transport Research, vol. 8, n°. 1, pp. 44-70, 2020.
