ISSN 2348-313X (Print)
International Journal of Life Sciences Research ISSN 2348-3148 (online)
Vol. 10, Issue 4, pp: (47-56), Month: October - December 2022, Available at: www.researchpublish.com

ISSN 2348-313X (Print)
International Journal of Life Sciences Research ISSN 2348-3148 (online)
Vol. 10, Issue 4, pp: (47-56), Month: October - December 2022, Available at: www.researchpublish.com
2
, Dr. G. Areendran3 , Sunny Joshi4
1School of environment and Natural Resources, Doon University, Dehradun, Uttarakhand. Email:
2Assistant Professor, School of environment and Natural Resources, Doon University, Dehradun, Uttarakhand.
3Director IGCMC, WWF-India, Delhi.
4Project Coordinator, WWF-India, Delhi DOI: https://doi.org/10.5281/zenodo.7335477
Published Date: 18-November-2022
Abstract: Musk deer (Moschus chrysogaster) is considered Endangered by International Union for Conservation of Nature (IUCN) and is under Schedule-I of the Indian Wildlife (Protection) Act, 1972, because of its illicit hunting for musk as well as habitat loss. The present study aims to analyze the present distribution pattern of Musk Deer in the Himalayan region of Uttarakhand. Precipitation of the driest month (Bio14), mean temperature of warmest quarter (Bio10), annual mean temperature (Bio1) and land use land cover were the major contributing variables to the model with area under Receiver Operating Characteristics (ROC) curve being 0.924. Using the Global Climate Models (GCM)MaxEnt and MIROC6,weprojected the distribution of the endangered MuskDeer in the Himalayan region of Uttarakhand for the years 2021-2040, 2041-2060, 2061-2080, and 2081-2100. Future climate change will either widen, narrow, or shift the climatic niche of many species, which may cause those species' geographic ranges to change. Overall, the shift of habitat shows a latitudinal pattern.
Keywords: Musk Deer, Species Distribution Modelling (SDM), MaxEnt, Uttarakhand, Bioclimatic variables.
The Musk deer (Moschus chrysogaster) is the smallest Himalayan ungulate that is adaptive to live in colder regions. It is found in Bhutan, Northern India, Nepal, and China's Himalayan (Chandra et al., 2021). The musk deer population has dropped dramatically over the last three to four decades, owing primarily to theft of its prized item, the musk pod (the most precious animal products, known as Musk, can sell for more than $55,000 per kg on international markets (Nandy et al., 2020), this species is mostly hunted without regard to age or gender. For every male musk bearer that is killed, four to five musk deer are also killed) (Nandy et al., 2020), large-scale habitat degradation due to livestock grazing and anthropogenic pressures, and meat hunting. Trade inmuskdeerparts, ontheother hand, is prohibited/restricted due tothe species'inclusion in Appendix I of the Convention on International Trade in Endangered Species of Wild Fauna and Flora (CITES) (Manish et al., 2016).Musk deer are protected in India by the Wildlife (Protection) Act, 1972, under "Schedule I." Musk deer are classed as “Endangered” on the IUCN Red List of Threatened Species in 2014 (Khadka & James, 2017).
Distribution: The Musk deer lives in the forested regions between 2,500 meters and the tree line(Wangdi et al., 2019). In Uttarakhand, the tree line is typically located at a height of roughly 3,300 meters(Adhikari, 2009). The Musk deer is well adapted for living in alpine, subalpine, and high temperate habitats (>.2500 m) even during winter, unlike other ungulates of the Himalaya that must migrate to lower elevations(Aryal & bhatta, 2019). In Uttarakhand musk deer are present in Protected Areas such the Nanda Devi National Park & Biosphere Reserve, Valley of Flowers National Park, Gangotri National Park, Kedarnath Wildlife Sanctuary, Govind Wildlife Sanctuary, Askot Wildlife Sanctuary, and numerous more Reserve Forest Divisions in the high Himalaya(Syed & Ilyas, 2012).
ISSN 2348-313X (Print)
International Journal of Life Sciences Research ISSN 2348-3148 (online)
Vol. 10, Issue 4, pp: (47-56), Month: October - December 2022, Available at: www.researchpublish.com
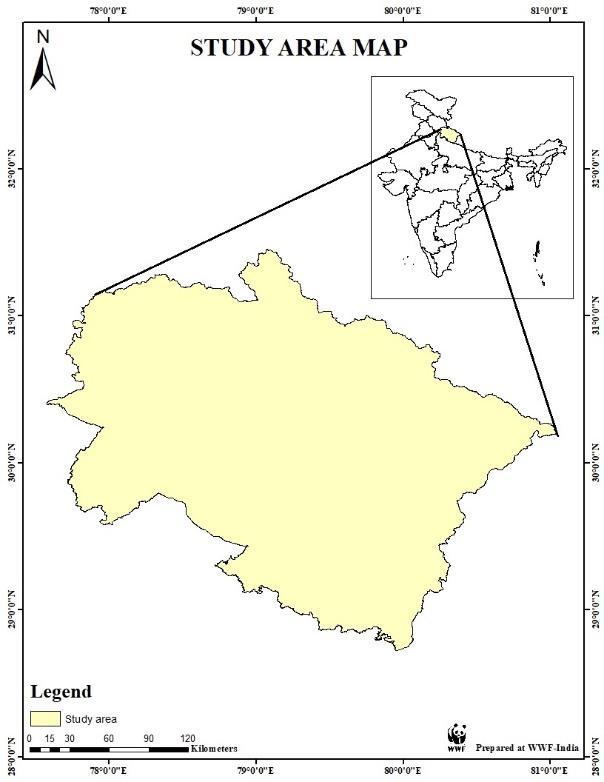
Figure I: Study Area Map
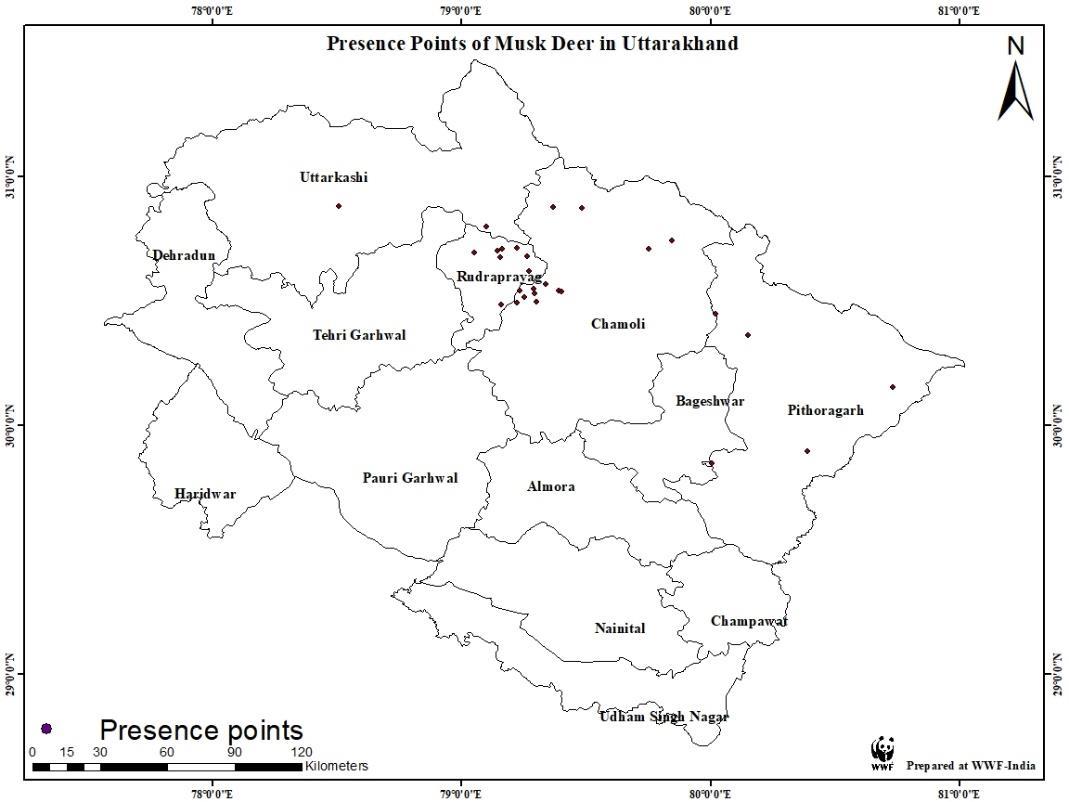
Maximum Entropy (MaxEnt) model was used to process a total of 28 distribution points of Musk Deer within the region of Uttarakhand (from a total of 55, after removing numerous presences in close vicinity). These distribution locations or presence points were gathered from various sources of literature. The majority of the Kedarnath Wildlife Sanctuary's presence points were obtained from a research article (Nandy et al., 2020). 14 of the 55 presence points were obtained from a research paper (Syed & Ilyas, 2012). The Uttarakhand Forest Department provided 2 of the 55 presence points during the field survey in the Askot Wildlife Sanctuary. Using the GPS Essential app one of the presence points was identified from the Musk Deer Research Center, Mahroori, (Bageshwar). Two of the presence points near Asi Ganga sub-basin were shared by Himalayan Institute for Sustainable Environment and Research Society. 28 locations were used in the model, which cover the entire current spatial distribution of the species in Uttarakhand from the eastern to western sections and represent various altitudes, temperatures, and habitat types along that stretch. The MaxEnt was used to forecast the present and future species distribution of Musk Deer in Uttarakhand (Elith et al., 2011). To estimate an unknown probability distribution for the presence of the species, Maxent looks for a set of pixels inside the research area whose environmental attributes are most similar to those of known occurrences (Padalia et al., 2014). Itis believed that the species occurrence points considered in modelling represent the entire range of climatic conditions for the species (Miller, 2010) . In order to create a correlative model of the environmental conditions that satisfy ecological requirements of the species and ultimately predict relative appropriateness of habitat, the MaxEnt model uses data on species occurrence and environmental factors. It is among the most widely used software applications for modelling environmental niches and can produce excellent forecast accuracies even with limited presence data (Phillips & Dudík, 2008) (Khadka & James, 2017).
We downloaded 19 grid-based bioclimatic variables from the WorldClim dataset to simulate the distribution of Musk Deer (www.worldclim.org). The elevation data was used to determine the slope and aspect(Phillips et al., 2006). To make the aforementioned raster layers comparable to WorldClim bioclimatic data, each layer was resampled using bioclimatic data as a reference(Cuesta, 2011).Future climate scenarios for time periods: 2021-2040 ,2041-2060, 2061-2080 and 2081-2100
ISSN 2348-313X (Print)
International Journal of Life Sciences Research ISSN 2348-3148 (online) Vol. 10, Issue 4, pp: (47-56), Month: October - December 2022, Available at: www.researchpublish.com
were downloaded from the WorldClim database (www.worldclim.org). We used Model for Interdisciplinary Research on Climate (MIROC6), the latest version of global climate change (GCM) to predict the distribution of Musk Deer and Shared Socio-economic Pathways (SSPs)-585 with spatial resolutions of 30 seconds(Manish et al., 2016). Research paper reported that MIROC6 captures various observed features of future climate very well, especially for the South Asian region, and studies have used it to predict species distribution for Nepal Himalaya (Lamsal et al., 2018).
Table 1: Predicator variables used for species distribution modelling of Musk Deer
S.No. Variable Description 1. BIO1 Annual Mean Temperature 2. BIO2 Mean Diurnal Range (Mean of monthly (max temp - min temp)) 3. BIO3 Isothermality (BIO2/BIO7) (×100) 4. BIO4 Temperature Seasonality (standard deviation ×100) 5. BIO5 Max Temperature of Warmest Month 6. BIO6 Min Temperature of Coldest Month 7. BIO7 Temperature Annual Range (BIO5-BIO6) 8. BIO8 Mean Temperature of Wettest Quarter 9. BIO9 Mean Temperature of Driest Quarter 10. BIO10 Mean Temperature of Warmest Quarter 11. BIO11 Mean Temperature of Coldest Quarter 12. BIO12 Annual Precipitation 13. BIO13 Precipitation of Wettest Month 14. BIO14 Precipitation of Driest Month 15. BIO15 Precipitation Seasonality (Coefficient of Variation) 16. BIO16 Precipitation of Wettest Quarter
of Driest Quarter
of Warmest Quarter
Figure II: Methodology
ISSN 2348-313X (Print)
International Journal of Life Sciences Research ISSN 2348-3148 (online)
Vol. 10, Issue 4, pp: (47-56), Month: October - December 2022, Available at: www.researchpublish.com
Of the 13 model variables, the contribution of the four variables, precipitation of the driest month (BIO14), mean temperature of warmest quarter (BIO10), annual mean temperature (BIO1) and land use land cover accounted for almost 80.1% of the model prediction. Precipitation of the driest month (BIO14), which made up 35.9% of the model, had a significant impact onthe potential habitat of muskdeer, as did the meantemperature ofthe warmest quarter (BIO10), annual mean temperature (BIO1) and land use land cover, which made up 20.9%, 12.9%, and 10.4% of the model, respectively. Similarly, 5.7%, 3.7%, 3.3%, and 3.1% respectively were provided by the precipitation of coldest quarter (BIO19), aspect, maximum temperature of warmest month (BIO5), and precipitation of driest quarter (BIO17) (Khadka & James, 2017).
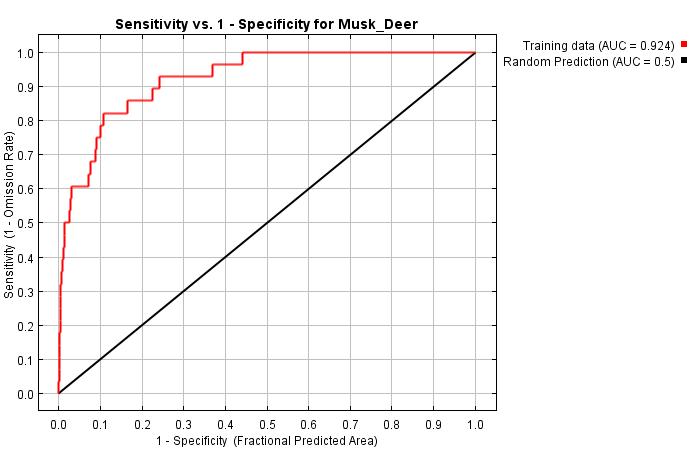
The jackknife test also showed that the precipitation of driest month (BIO14) (Mishra et al., 2014), mean temperature of warmest quarter (BIO10), annual mean temperature (BIO1) and land use land cover were the four main variables. Area Under the ROC Curve (AUC) values above 0.75 are often regarded as useful for training models; the model's training AUC score of 0.924 indicates that the chosen variables do a good job of describing the distribution of Musk deer (Lamsal et al., 2018)
Response curves showed how each environmental variable used in this modelling responded to the predicted suitability of Musk deer, both on each variable and its correlation with other variables (Elith et al., 2006) The finding showed that the most important factor influencing the distribution of musk deer is precipitation of the driest month (BIO14).
ISSN 2348-313X (Print)
International Journal of Life Sciences Research ISSN 2348-3148 (online) Vol. 10, Issue 4, pp: (47-56), Month: October - December 2022, Available at: www.researchpublish.com
Percent Contribution Variables
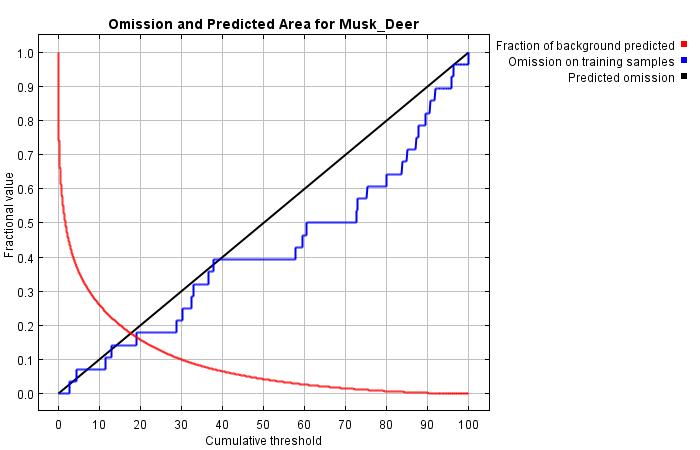
The predicted area and omission rate are displayed in figure5 as functions of the cumulative threshold. If test data are used, the test records are also used to determine the omission rate in addition to the training presence records. The definition of the cumulative threshold should cause the omission rate to be near to the projected omission.
ISSN 2348-313X (Print)
International Journal of Life Sciences Research ISSN 2348-3148 (online) Vol. 10, Issue 4, pp: (47-56), Month: October - December 2022, Available at: www.researchpublish.com
The outcomes of the jackknife test of variable importance are depicted in figure7. Bio14 appears to have the most relevant information when used alone because it exhibits the biggest gain when used alone. Land Use Land Cover (LULC) is the environmental variable that has the most impact on gain when it is absent, and as a result, it seems to contain the most information that isn't contained in the other variables.
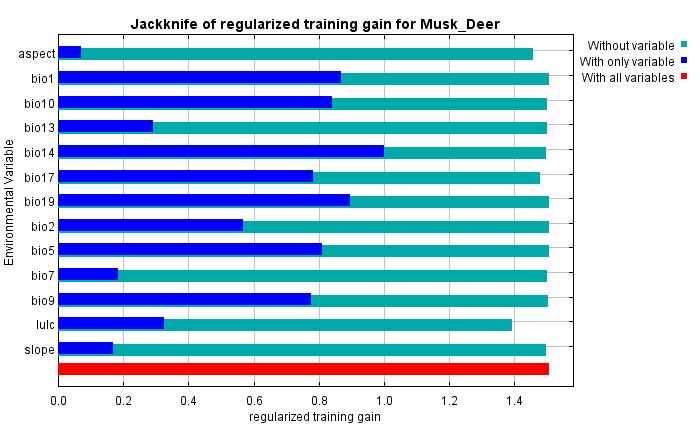
Figure VII: Jackknife Curve
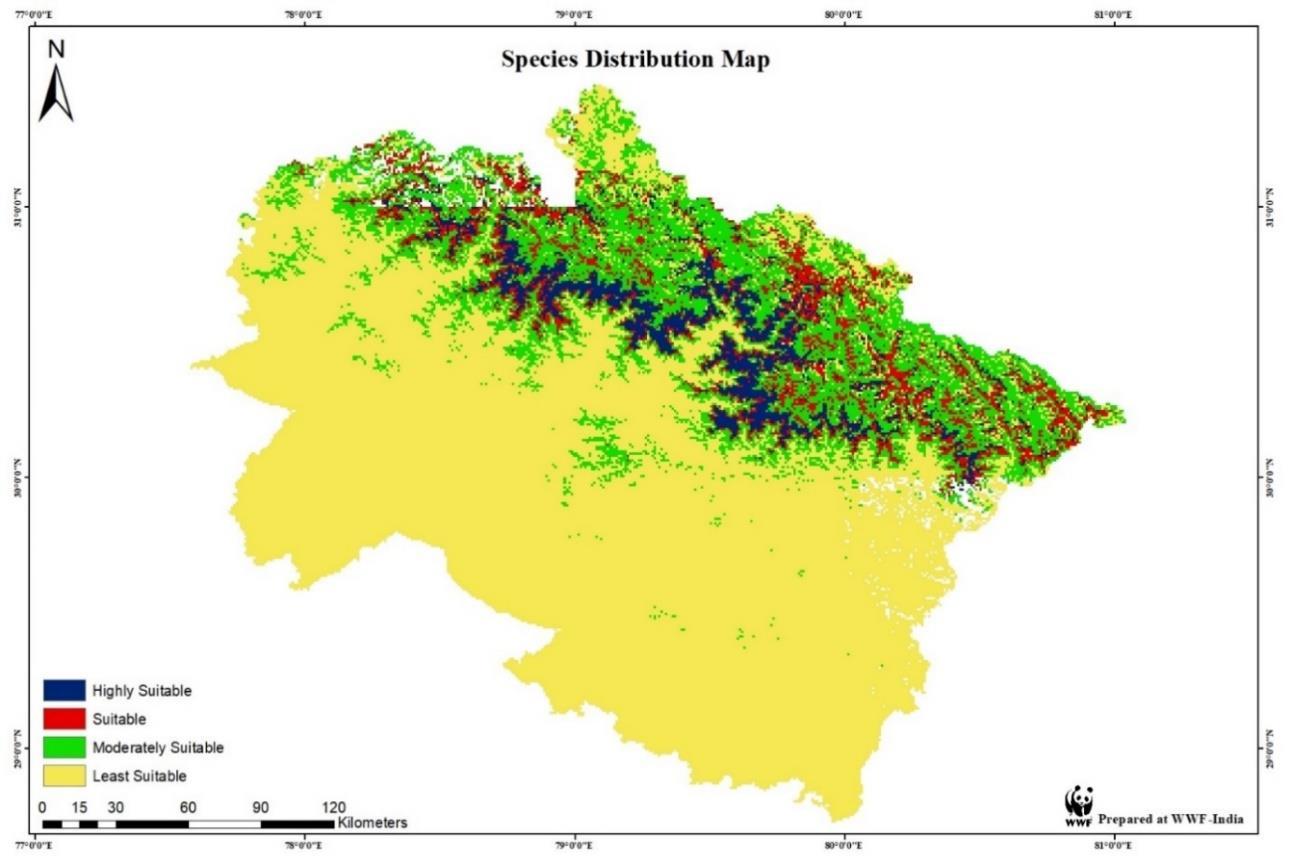
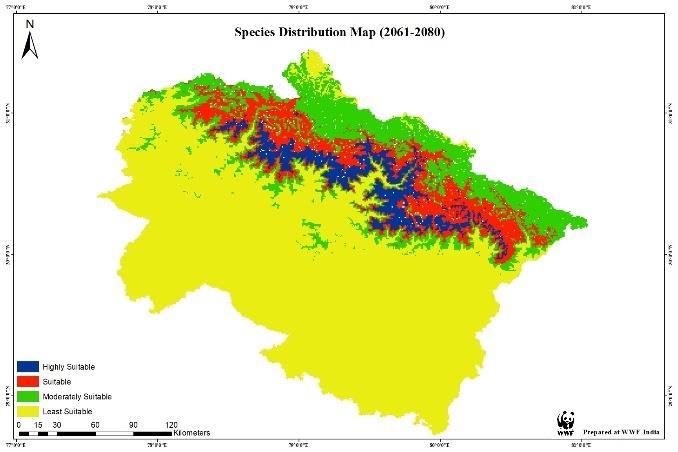
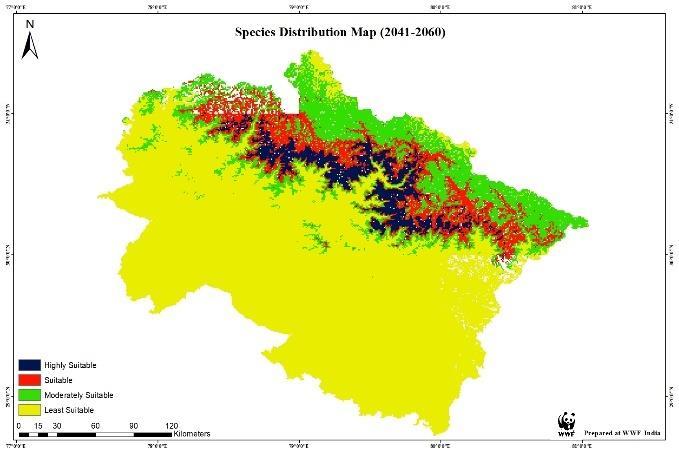
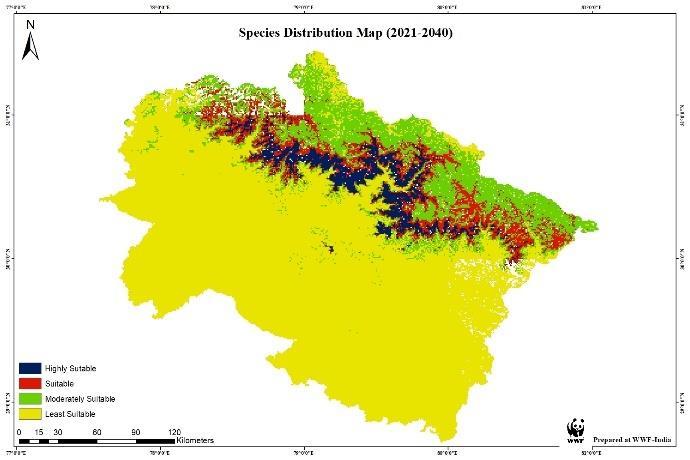
Figure VIII: Species Distribution Map
ISSN 2348-313X (Print)
International Journal of Life Sciences Research ISSN 2348-3148 (online)
Vol. 10, Issue 4, pp: (47-56), Month: October - December 2022, Available at: www.researchpublish.com
In the figure 8. The entire area could be divided into 4 classes based on the suitability of the species for its survival and perpetuation. The area is divided into highly suitable, suitable , moderately suitable and least suitable classes.
Future distribution prediction was done for the years 2021-2040, 2041-2060, 2061-2080, 2081-2100 (figure9: a, b, c, d respectively). Latitudinal shift of the suitable habitat for musk deer can be observed from the following maps (Chen et al., 2011). Notably, accordingto theoretical predictions ofclimate change effects, climatically acceptable habitat for the species seems to be expanding towards the north in the Uttarakhand Himalayan region (Khadka & James, 2017). In order to keep up with the changing climate and follow an adaptive climate niche, the species is therefore theoretically anticipated to reshuffle its range in the future (Lamsal et al., 2018).
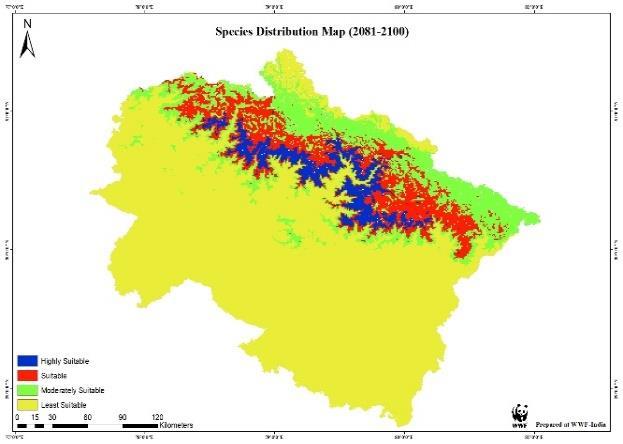
However, among many other factors, the rate at which a species can track ideal climatic conditions depends on its capacity for dispersal, its rate of migration, and the availabilityof adjoining habitat. Since little is known about the species' migration ecology, it is impossible to predict how the shift in precipitation brought on by climate change would affect the species (Chen et al., 2011). Future research on the species' dispersal capacity and migration ecology will therefore provide greater insight into the species' very little impacts of climate change (Ali, 2014) The southern range limit, on the other hand, does not appear to shrink significantlyin the future given the anticipated climatic circumstances taken into account here (Khadka & James, 2017). The absence of major contraction or range shift in the southern limit of the range in the future does not implythat the species will be infected bythe predicted climate change. This is so although climatic elements unquestionably mark the species' physiological tolerance limits, they are not the only factors influencing species dispersion (Cuesta, 2011)
ISSN 2348-313X (Print)
International Journal of Life Sciences Research ISSN 2348-3148 (online)
Vol. 10, Issue 4, pp: (47-56), Month: October - December 2022, Available at: www.researchpublish.com
It is important to keep in mind that the study only considered areas that the species might thrive in depending on the local climate. Thus, the aforementioned species maynot necessarilybe present inthe locations that are expected tobe climatically suitable (Jackson & Robertson, 2011). However, the climatic conditions in these regions are favourable for the survival of the questioned species, therefore they demand serious conservation attention (Khadka et al., 2017). Different ecological factors, such as competition for resources, resource distribution, predation, dispersal, etc., could define the actual area occupied by the species. However, due to the challenges in the evaluation and their unpredictability over space and time, these habitat parameters are typically overlooked in methods for modelling species distribution (Parmesan & Yohe, 2003). Therefore, any modifications brought about by predicted climate change on these dimensions may have an impact on the population and regional distribution of species (Khadka & James, 2017).
Conservation planning requires the identification of environmentally suitable locations that will help species survive over time; (Khadka & James, 2017) for instance, these sites are recommended for reserve design, corridor design, species translocation, and, in extreme circumstances, aided migration (Green, 1986). In the current study, an endeavor was made to predict and map the endangered musk deer's current and future climatic niche throughout its entire range in Uttarakhand. We anticipate that the map we have created will be reliable and perhaps accurate (Nandy et al., 2020). It was observed that under all of the future years taken into account, the climatically acceptable range for species will expand. Our findings indicate a latitudinal shift rather than a longitudinal shift in habitat, indicating that future climate change will cause the musk deer's habitat to move to higher altitudes (Jiang et al., 2020) and to grow in the latitudinal direction. From 2021 to 2100, suitable habitat will continue to grow (Lamsal et al., 2018).
The study was successful in identifying the prospective musk deer habitat. Based on the range of environmental suitability for musk deer for its survival and perpetuation, the entire area might be divided into four classes. For the conservation of the species and to reduce the risk that could be brought on by projected climate change, a collaborative international management plan is advised in addition to the national management plan for the species (Khan et al., 2006). The results of this study can be extremely helpful in protecting and conserving musk deer through the wise deployment of resources and personnel in sanctuaries and protected areas (Khadka & James, 2017).
The highest happiness that accompanies the successful completion of any task would be incomplete without the expression of gratitude to all those who have helped me throughout this project. We take this opportunity to express our profound gratitude to Dr. Krishna Raj, Senior ProgramDirector, Mr Kumar Ranjan, Programme officer, and Ms Abhijitha CS, Information cum GIS officer, IGCMC, WWF-India, Mr. Sunny Joshi, Ph.D. Scholar,DoonUniversity,Dr.KhimaNandBalodi,HISER(NGO)and Mr.KuberSinghBisht, Conservator,AskotWildlife Sanctuary,for their unserved assistance guidance throughout the project period.
Lastly, I would like to thank my family, friends and colleagues for their continuous help and moral support.
[1] Adhikari, B. S. (2009). Status and distribution pattern of coarse woody debris along an altitudinal gradient in Askot Wildlife Sanctuary, Uttarakhand, West Himalaya. Journal of Forestry Research, 20(3), 205–212. https://doi.org/ 10.1007/s11676-009-0040-0
[2] Ali, M. (2014). Habitat suitability modeling for exploration of the spatial distribution of Kashmir musk deer in Dachigam National Park, Kashmir. American Journal of Environmental Sciences, 10(5), 446–457. https://doi.org/ 10.3844/ajessp.2014.446.457
[3] Aryal, A., & bhatta, K. P. (2019). Mapping and analysis of the Himalayan musk deer habitat in Annapurna conservation area. Journal of Wildlife and Biodiversity.
[4] Chandra, K., K.Sharma, D., Shridhar, V., & Arunachalum, K. (2021). A Study on Distribution, Habitat Use and Conservation Status of Himalayan Musk Deer (Moschus chrysogaster) in Askot Wildlife Sanctuary, India. Applied Ecology and Environmental Sciences, 9(2), 193–202. https://doi.org/10.12691/aees-9-2-11
ISSN 2348-313X (Print)
International Journal of Life Sciences Research ISSN 2348-3148 (online) Vol. 10, Issue 4, pp: (47-56), Month: October - December 2022, Available at: www.researchpublish.com
[5] Chen, I.-C., Hill, J. K., Ohlemüller, R., Roy, D. B., &Thomas, C. D. (2011). Rapid Range Shifts ofSpecies Associated with High Levels of Climate Warming. Science, 333(6045), 1024–1026. https://doi.org/10.1126/science.1206432
[6] Cuesta, F. (2011). Species Distribution Modeling and the Challenge of Predicting Future Distributions A Guide to Using SDM for Prediction of Future Species Distributions. http://www.worldclim.org/,
[7] Elith, J., H. Graham, C., P. Anderson, R., Dudík, M., Ferrier, S., Guisan, A., J. Hijmans, R., Huettmann, F., R. Leathwick, J.,Lehmann, A., Li, J., G.Lohmann, L., A. Loiselle, B.,Manion, G., Moritz, C.,Nakamura, M., Nakazawa, Y., McC. M. Overton, J., Townsend Peterson, A., … E. Zimmermann, N. (2006). Novel methods improve prediction of species’ distributions from occurrence data. Ecography, 29(2), 129–151. https://doi.org/10.1111/j.2006.09067590.04596.x
[8] Elith, J., Phillips, S. J., Hastie, T., Dudík, M., Chee, Y. E., & Yates, C. J. (2011). A statistical explanation of MaxEnt for ecologists. Diversity and Distributions, 17(1), 43–57. https://doi.org/10.1111/j.1472-4642.2010.00725.x
[9] Green, M. J.B.(1986).The Distribution, Status and Conservationofthe HimalayanMuskDeer Moschus chrysogaster. In Biological Conservation (Vol. 35).
[10] Jackson, C. R., & Robertson, M. P. (2011). Predicting the potential distribution of an endangered cryptic subterranean mammal from few occurrence records. Journal for Nature Conservation, 19(2), 87–94. https://doi.org/10.1016 /j.jnc.2010.06.006
[11] Jiang, F., Zhang, J., Gao, H., Cai, Z., Zhou, X., Li, S., & Zhang, T. (2020). Musk deer (Moschus spp.) face redistribution to higher elevations and latitudes under climate change in China. Science of the Total Environment, 704 https://doi.org/10.1016/j.scitotenv.2019.135335
[12] Khadka, K. K., & James, D. A. (2017). Modeling and mapping the current and future climatic-niche of endangered Himalayan musk deer. Ecological Informatics, 40, 1–7. https://doi.org/10.1016/j.ecoinf.2017.04.009
[13] Khadka, K. K., Kannan, R., Ilyas, O., Abbas, F. i., & James, D. A. (2017). Where are they? Where will they be? In pursuit of current and future whereabouts of endangered Himalayan musk deer. Mammalian Biology, 85, 30–36. https://doi.org/10.1016/j.mambio.2017.02.007
[14] Khan, A. A., Oureshi, B. ud din, & Awan, M. S. (2006). Impact of musk trade on the decline in Himalayan musk deer Moschus chrysogaster population in Neelum Valley, Pakistan. 91, 696–699.
[15] Lamsal, P., Kumar, L., Aryal, A., & Atreya, K. (2018). Future climate and habitat distribution of Himalayan Musk Deer (Moschus chrysogaster). Ecological Informatics, 44, 101–108. https://doi.org/10.1016/j.ecoinf.2018.02.004
[16] Manish, K., Telwala, Y., Nautiyal, D. C., & Pandit, M. K. (2016). Modelling the impacts of future climate change on plant communities in the Himalaya: a case study from Eastern Himalaya, India. Modeling Earth Systems and Environment, 2(2), 92. https://doi.org/10.1007/s40808-016-0163-1
[17] Miller, J. (2010). Speciesdistribution modeling. In Geography Compass (Vol. 4,Issue 6, pp.490–509). https://doi.org/ 10.1111/j.1749-8198.2010.00351.x
[18] Mishra, V., Kumar, D., Ganguly, A. R., Sanjay, J., Mujumdar, M., Krishnan, R., & Shah, R. D. (2014). Reliability of regional and global climate models to simulate precipitation extremes over India. Journal of Geophysical Research: Atmospheres, 119(15), 9301–9323. https://doi.org/10.1002/2014JD021636
[19] Nandy, S., Neethu Lakshmi, M., & Kushwaha, S. P. S. (2020). Habitat Suitability Analysis of Himalayan Musk Deer (Moschus leucogaster) in Part of Western Himalaya, India. Journal of the Indian Society of Remote Sensing, 48(11), 1523–1533. https://doi.org/10.1007/s12524-020-01175-8
[20] Padalia, H., Srivastava, V., & Kushwaha, S. P. S. (2014). Modeling potential invasion range of alien invasive species, Hyptis suaveolens (L.) Poit. in India: Comparison of MaxEnt and GARP. Ecological Informatics, 22, 36–43. https://doi.org/10.1016/j.ecoinf.2014.04.002
[21] Parmesan, C., & Yohe, G. (2003). A globally coherent fingerprint of climate change impacts across natural systems. Nature, 421(6918), 37–42. https://doi.org/10.1038/nature01286
ISSN 2348-313X (Print)
International Journal of Life Sciences Research ISSN 2348-3148 (online) Vol. 10, Issue 4, pp: (47-56), Month: October - December 2022, Available at: www.researchpublish.com
[22] Phillips, S. J., Anderson, R. P., & Schapire, R. E. (2006). Maximum entropy modeling of species geographic distributions. Ecological Modelling, 190(3–4), 231–259. https://doi.org/10.1016/j.ecolmodel.2005.03.026
[23] Syed, Z., & Ilyas, O. (2012). Status, distribution and aspects of ecology of Alpine Musk Deer (Moschus chrysogaster) in Uttarakhand Himalayas, India
[24] Wangdi, T., Tobgay, S., Dorjee, K., Dorji, K., & Wangyel, S. (2019). The distribution, status and conservation of the Himalayan Musk Deer Moschus chrysogaster in Sakteng Wildlife Sanctuary. Global Ecology and Conservation, 17. https://doi.org/10.1016/j.gecco.2018.e00466
Plagiarism Report