44 minute read
THE INFLUENCE OF ORGANIZATIONAL CULTURE ON PROJECT TEAM PERFORMANCE IN NGOS USING A SPECIFIC REFERENCE OF LIVING WATER RWANDA

from THE INFLUENCE OF ORGANIZATIONAL CULTURE ON PROJECT TEAM PERFORMANCE IN NGOS USING A SPECIFIC REFE
DAVID MUGABO (PhD)
Abstract: This study was conducted on the influence of organizational culture on project team performance in NGOs using a specific reference of Living Water Rwanda. The specific objectives of the study were; to investigate the influence of control on project team performance in Living Water Rwanda; to examine the influence of reward criteria on project team performance in Living Water Rwanda and to analyze the influence of risk tolerance on project team performance in Living Water Rwanda. The study adopted a cross sectional research design where questionnaires, interviews, FGDS and documentary analysis were used to collect data from team members, project managers and team leaders. At the end of the study, it was found out that organization control and risk tolerance had a positive influence on project team performance in Living Water Rwanda organization whilst reward criteria had a negative influence on project team performance. This meant that the organization had put so much effort to see that they control their team’s work performance and have been risk tolerant which have positively influenced project team performance but however, the organization lacks equitable reward criteria which has negatively affected the project team performance. Therefore, it is recommended that the organization need to put in place formal guidelines to be followed in controlling staffs which are balanced on each and every one, come up with a reward criterion that is equitable to all project team members as well as practicing risk tolerance on individual level of project team members.
Advertisement
Keywords: organizational culture, Living Water Rwanda, project team performance, project team members.
1. INTRODUCTION
All over the world, the issue of organizational culture has been affecting project team performance and however, it has come on the frontline all over the world whenever donors are seeking for answers to the increasing failure of their projects in non-government organization. Many explanations for the success or failure of funded projects come from the donors themselves. Amidst intensifying poor project team performance, project manager have focused on organizational culture as a means of sustaining performance (Hopkins, 2007; McDonald & Rundle-Thiele, 2008). According to Drucker (1993), most NGOs have their own cultures that ignore important elements and in the end it affects their overall performance. The Successful management of NGO projects from idea generation to handover presents a win-win situation for the funder and the society (Scot, 2007). However, NGOs have failed to implement projects to the satisfaction of society (Ofori & Hinson, 2007).
According to Baker (2007), over 95% of project failures could be attributed to poor organizational culture in form of dimensions such as control, reward criteria and risk tolerance. Scott (2007) alludes to the fact that perceived failure of projects causes negative publicity.
With the popularity of teams increasing so rapidly around the world, some organizations have started using teams just because everyone else is doing so. This is obviously a wrong reason. The best reason to use teams in an organization is
International Journal of Management and Commerce Innovations
ISSN 2348-7585 (Online) Vol. 7, Issue 2, pp: (1318-1337), Month: October 2019 - March 2020, Available at: www.researchpublish.com the positive benefits that can result from a team based environment, which include enhanced performance, employees‘ benefits, reduced costs and organizational enhancement (Naveen Jain, 2008 pg 194). In this first chapter we review the research evidence about the potential benefits of team working and the factors that influence the effectiveness of teams, focusing particularly upon their use in health care settings. We draw on empirical evidence from research conducted in the United Kingdom, mainland Europe, North America and Australia. The literature on team composition and the processes which influence team performance is briefly reviewed with particular emphasis on communication, decisionmaking and problem-solving. We then explore the influences of organizational context and leadership, before presenting the theoretical model which guided the research programme described in this report. First we consider what a ‗team‘ means. The activity of a group of people working co-operatively to achieve shared goals is basic to our species (Baumeister & Leary, 1995).
The current enthusiasm for team working in health care reflects a deeper, perhaps unconscious, recognition that this way of working offers the promise of greater progress than can be achieved through individual Endeavour. Mohrman, Cohen, and Mohrman (1995) define a team as: ―a group of individuals who work together to produce products or deliver services for which they are mutually accountable. Team members share goals and are mutually held accountable for meeting them, they are interdependent in their accomplishment, and they affect the results through their interactions with one another. The performance of teams within organizations is, therefore, an important variable in the performance of the organization as a whole. Crucial to the performance of teams are the abilities and behaviors of their members. Organizational culture has been defined as patterns of shared values and beliefs over time which produces behavioral norms that are adopted in solving problems within the organization. In order for the organization to realized high team performance, than it has to embrace culture that is commonly held and relatively stable beliefs, attitudes, and values that exist within the organization. In this case, we are considering performance increase as when there is less absenteeism, fewer employee leaving early and less breaks; whereas in a factory setting, increase in performance can be measured by the number of units produced per employee per hour (Dorgan, 1994). Culture is the commonly held and relatively stable beliefs, attitudes and values that exist within the organization (Williams et al., 1989).
The current trends on the organizational culture and project team performance is so crucial employees in different organizations have different organizational culture. Every organization has unique control, reward criteria and different levels of risk tolerance. Better cultural environment that will boost the team spirits and increased team performance within the organization. This has caused the organization to experienced persistent low performance among project team from 2011-2013 (NGO annual analysis report, 2013). In this research study the dependent variable that can easily be manipulated is the Project Team Performance and the independent variable that causes a change on project team performance is the organizational culture.
2. STATEMENT OF THE PROBLEM
Due to globalization, the world is becoming a global village. Organizations are increasing employing people of different cultures. Organization culture has become increasingly topical issue in the research. Ouchi & Wilkins (2014) asserted that organizational culture may be the most frequently studied cultural subtopic. Culture has been studied from many perspectives and disciplines. Cameron and Ettington (2013) wrote that from the anthropologist functionalist viewpoint, culture is discernible in behaviors. A functionalist views culture ―as a coherent set of norms, values, and beliefs mirroring social structure (Peterson, 2013). Consistent with a sociologist worldview, culture takes on a symbolic nature (Peterson, 2013). Gertz (12015) wrote that culture,―denotes a historically transmitted pattern of meanings embodied in symbols, a system of inherited conceptions expressed in symbolic forms by means of which [people] communicate, perpetuate, and develop their knowledge about and attitudes toward life
Despite the fact that Living water Rwanda had a favorable external environment such as government policies, adequate infrastructures and excellent political will, but it still face a persistent low performance among project team by an average of 25% annually (NGO annual analysis report, 2013). In addition the management seems to be paying modest attention to its culture in term of control, reward criteria and risk tolerance that would be influencing its project team performance (NGO report, 2015, 2014, and 2012). Living water Rwanda remained rigid and conservative and this could partly be reason causing decline in project team performance (Mahandis, 2014). The study therefore, was to empirically investigate the influence of organizational culture on project team performance.
International Journal of Management and Commerce Innovations ISSN 2348-7585 (Online) Vol. 7, Issue 2, pp: (1318-1337), Month: October 2019 - March 2020, Available at: www.researchpublish.com
Purpose of the study
The general objective of the study is to scrutinize the relationship between the organizational culture and project team performance in Living Water Rwanda (LWR).
Specific objectives
The specific objectives of this study included the following:
1. To investigate the influence of organizational control on project team performance in Living Water Rwanda.
2. To examine the influence of reward criteria on project team performance in Living water Rwanda
3. To analyze the influence of risk tolerance on project team performance in Living Water Rwanda.
Research questions
1. What influence does organizational control have on project team performance in Living water Rwanda
2. What influence do reward criteria have on project team performance in Living Water Rwanda?
3. What influence does risk tolerance have on project team performance in Living Water Rwanda?
Significance of the study
This study will be significant in the following ways:
To Living Water Rwanda
Project managers in Living Water Rwanda will use the findings and recommendations of this study to improve team performance in their organization.
To Academicians
Academicians and students of organizational development and project management may use the findings as a strong foundation for further research in this area. This study will add to the body of existing literature and provide a basis for future studies and reference for future researchers
3. SCOPE OF THE STUDY
Content
Cope
The study covered the information on organizational culture and project team performance a case of Living Water Rwanda. It scrutinized the organizational culture and project team performance.
Geographical scope
The study was conducted in Kigali Rwanda and it focused on organizational culture and project team performance within Living Water Rwanda. This location was appropriate because it is the researcher‘s town of resident and hence it cut the cost of accommodation.
Time scope
This research study covered a period of 2014 -2016. This length of time was appropriate because it enabled the researcher to analyze the data and give the accurate report.
Research Gap.
The literature reviewed clearly indicated that there are a number of studies in place that have viably established a relationship between organizational culture and project team performance in NGOs world over. But however, there is no particular study which tries to look at this in Rwanda and particularly in Living Water Rwanda. However, the literature reviewed is reportedly done in previous years of 2010 and below. Currently, we are in 2019 and new developments have come up in the way organizations controls, rewards and handles risks which call for a study like this to try to empirically test the literature reviewed and weigh the progress of the new ways of controlling, criterions of rewarding and ways of dealing with risks in place. This revealed new works in place especially on the relationship between organizational culture and project team performance in Living Water Rwanda.
International Journal of Management and Commerce Innovations ISSN 2348-7585 (Online) Vol. 7, Issue 2, pp: (1318-1337), Month: October 2019 - March 2020, Available at: www.researchpublish.com
Research design.
This study used a cross sectional research design. This design was chosen because it is important for the researcher to find out the opinion of a cross section of the population about a subject under investigation in a particular period of time using a particular part of organisation (Sekaran, 2003). In this study, numerical figures and descriptive information were obtained, giving it both a quantitative and qualitative research dimension. The study hence used both qualitative and quantitative approaches during sampling, data collection, quality control, and analysis. At data collection stage, qualitative design involved administering open ended interview and questionnaire questions to the respondents, whilst the quantitative design was involved administering closed ended interview and questionnaire questions to respondents in Living Water Rwanda.
Study population
The total population for this study will be 64 respondents comprising of 4 project managers, 10 team leaders, and 50 team members. Managers was selected because they know the strengths and weaknesses of their project team members, team members were selected because they are the one who execute the organizational activities and their opinion were vital in this study and finally team leaders because they are aware of teams‘ effort within the organization.
Sampling
Sampling was done using different sampling designs, procedures in order to come up with a sample size.
Sampling Technique
The study was used both probability and non-probability sampling designs. From the existing probabilistic sampling designs, the study was used simple random sampling techniques. Simple random sampling was used to select team members in Living Water. This technique was chosen because the category of team members had a large population size and as such warranted simple random sampling to minimize sampling bias (Mugenda & Mugenda, 2003). From the existing non-probabilistic sampling designs, census sampling was used. Census sampling was used to select project managers and team leaders because all of them are of much importance to the study.
Sample Size
The sample of 30 respondents was selected to represent the views of the entire population. The sample of 30 respondents was appropriate because it produced more reliable and quick results because fewer errors were encountered during the data collection exercise will be easily managed.
Illustrates the staff population, sample size and technique used.
Category Population Sample
Sampling technique Managers 4 4 Census sampling Team leaders 10 10 Census sampling Team members 50 44 Simple random sampling Total 64 58
Source: Living Water Rwanda organisation HRM manual (2019)
4. DATA COLLECTION METHODS
The study employed four methods of data collection that is the questionnaire, interview, focus group discussion and documentary analysis.
Questionnaire
This was used to collect primary data from team members and, it involved use of a semi-structured questionnaire depicted in Appendices III. The method of survey using a semi-structured questionnaire is deemed appropriate since part of the questionnaire offered team members a choice of picking their answers from a given set of alternatives while the other part of the questionnaire allows them to qualify their responses (Amin, 2005).
International Journal of Management and Commerce Innovations
ISSN 2348-7585 (Online) Vol. 7, Issue 2, pp: (1318-1337), Month: October 2019 - March 2020, Available at: www.researchpublish.com
Interview
This was used to collect primary data from project managers. It involved use of a semi-structured interview guide depicted in Appendices IV. The method of interview using a semi-structured interview guide was deemed appropriate since the aforementioned categories of staff had vital information yet no time to fill in questionnaires (Sekaran, 2003).
Focus Group Discussions
A focus group discussion was employed in the study to collect data from the team leaders as depicted in Appendices V. FGD guide was used to collect data because it proved a significant tool to collect data from the aforementioned population because it enables exchange of views at a time and enable supplementing and adding on what has been got from the first two tools that is the interview and the questionnaire.
Documentary Review
This was used to collect secondary data and was guided by a documentary review checklist. Documents from Living Water Rwanda, public and private libraries with literature relevant to the research topic was analyzed as secondary sources of data to supplement primary data from survey and interviews (Amin, 2005).
Source of data
Data will be obtained from both primary and secondary sources. Primary data was obtained by using open and closed questionnaires that were given to team members and interviews that will be conducted with project managers as well as FGDs which was conducted with team leaders. Secondary data was obtained by use of a documentary review checklist.
Data quality control Validity
Validity is the extent to which research instruments measure what they are intended to measure (Oso & Onen, 2008). The researcher used the expert judgment of his supervisors to verify the validity of the instruments. To assess this, the supervisor contacted to evaluate the relevance of each item in the instruments to the objectives. The experts rated each item as either relevant or not relevant. Validity was determined using Content Validity Index (C.V.I). C.V.I=Items rated relevant by both judges divided by the total number of items in the questionnaire as shown hereinafter.
CVI = No. of items rated relevant
Total no. of items
CVI= 58 64
CVI= 0.90625
As recommended by Amin (2005), for the instrument to be valid, the C.V.I should be at least 0.7. This means that the tool was valid for this study.
Reliability
Reliability is the extent to which a research instrument yields consistent results across the various items when it is administered again at a different point in time (Sekaran, 2003). To establish reliability, the instruments were pilot-tested twice on the same subjects at a time interval of four weeks. The data collection tools were subjected to reliability test to determine the relationship between the variables
Background of the Respondents
This theme handles the background information on the respondents that were used in the study. Among these characteristics included, gender, age, level of education and the period respondents had spent in service at Living Water Rwanda.
Gender of the respondents
To understand the gender of the respondents, the researcher recorded their gender and below was the results that were recorded in figure 1.
International Journal of Management and Commerce Innovations ISSN 2348-7585 (Online) Vol. 7, Issue 2, pp: (1318-1337), Month: October 2019 - March 2020, Available at: www.researchpublish.com
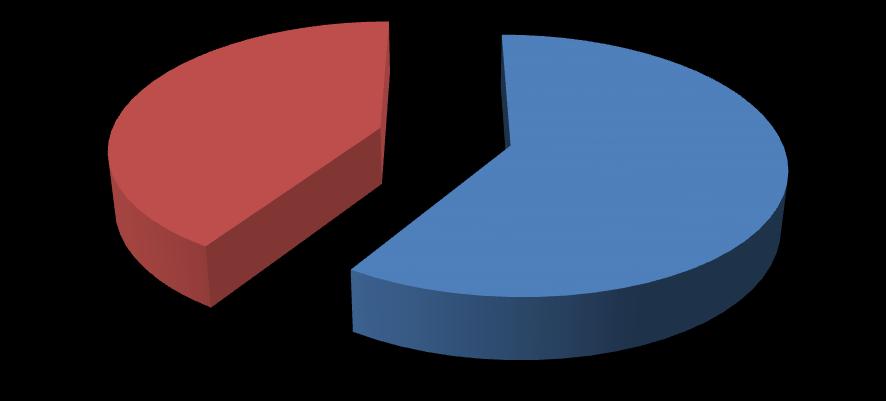
Figure 1: Gender
Gender of the respondents male female
Series1, female , 40.9, 41%
Series1, male , 59, 59%
From figure 1, it is indicated that the study was conducted mainly from the male respondents who constituted 59%. Females on the other hand, were represented by 41% of the respondents. On the other hand, from the interviews conducted, the male respondents took a highest toll, they constituted 88.5% of the respondents and female took the smaller portion of 11.5%. This directly tells us that no matter the percentage of males and females who participated in the study. This implies that the study was gender sensitive.

Age of the Respondents
To establish the age of the respondents, participants were asked to state their ages and below are the results that were recorded in figure 1
Figure 2: Age
Percentage, <24years, 13.6 frequency, <24years, 6
Percentage, 2530years, 36.3
Age of the respondents frequency Percentage
Percentage, 3135years, 27.2
Percentage, 3640years, 22.7 frequency, 2530years, 16 frequency, 3135years, 12 frequency, 3640years, 10
International Journal of Management and Commerce Innovations
ISSN 2348-7585 (Online) Vol. 7, Issue 2, pp: (1318-1337), Month: October 2019 - March 2020, Available at: www.researchpublish.com
The figure 2 above shows that in the study, the majority of the respondents were 25-30years and these took the highest toll of 36.3%. Those who were in the category of 31-35 constituted 27.2%, 36-40years were represented by 22.7% of the respondents and those who were below 24years came last with 13.6%. These categories of years are what the study had aimed at hence guaranteeing the results forethought.
Level of Education of the Respondents
Respondents were also asked to state their level of education and most of them indicated that they had a bachelor‘s degree as shown in figure 3 below.
Figure 3: Level of education
Level of education
Frequency percentage percentage, Degree, 20.4 percentage, Postgraduate , 11.3
Frequency, Postgraduate , 5
Frequency, Degree, 9 percentage, Diploma, 25 percentage, Certificate, 43
Frequency, Certificate, 19
Frequency, Diploma, 11
The Figure 3 above indicates that majority of the respondents had a certificate of education and these constituted 43% of the respondents. 25% of the respondents had attained a diploma, 20.4% had a degree and 11.3% had got a postgraduate level of education. Basing on the above findings were majority of the respondents were showed to have had at least a certificate in education, this means that the findings of the study were based on the people who had enough cognitive capacity to tell what is required to the study.

Time spent working for Living Water Rwanda
Respondents were also asked to state the time they had spent in Living Water Rwanda and their responses were what figure 4 indicated below.
International Journal of Management and Commerce Innovations ISSN 2348-7585 (Online) Vol. 7, Issue 2, pp: (1318-1337), Month: October 2019 - March 2020, Available at: www.researchpublish.com
Figure 4: Duration of employment

Percentage, 15years, 65.9 frequency, 1-5years, 29
Percentage, <1year, 11.3 frequency, <1year, 5
Percentage, >5years, 22.7 frequency, >5years, 10
Figure 4 above indicated that majority of the respondents had worked with Living Water Rwanda organization for 15years and these took 65.9%, 22.7% had spent in service for over 5years. Those who had spent below 1years were represented by 11.3%. This therefore, means that the study was based on the people who had enough experience as far as the Living Water Rwanda operations are concerned.
Empirical findings on organizational culture and project team performance in alarm organization
In this section, the research findings are presented as per the dependent and independent variables used by the study. These findings were thus obtained on organizational control, reward criteria, risk tolerance and project team performance in Living Water Rwanda. In this case therefore, to understand whether there is a relationship between organizational culture and project team performance, respondents were introduced to different pre-conceived statements as per each variable to get their views and below are the findings that were found on each dimension.
Findings on Organizational control in Living Water Rwanda
To establish whether Living Water Rwanda undertakes control of its team members, the respondents were asked different statements. Their responses were computed by making an aggregate of responses given by respondents to the 5statements and 5point Likert scale (1=Strongly agree, 2=agree, 3=Uncertain, 4=Disagree and 5=Strongly Disagree), which sought to measure the prevalence and practice of organizational control in Living Water Rwanda were categorized according to their percentages and means as follows:
Table 1: Findings on organizational culture
Statements 1 2 3 4 5 Mean
In my organization a high degree of team-member control foster team performance 9% 31.8% 2.27% 27.2% 29.5% 2.64
In my organization employees‘ behaviors are monitor by the team leaders 13.6% 22.7% 4.5% 36.4% 22.7% 3.09
In Living Water Rwanda organization evaluation process based on the monitoring and evaluation of team‘s behaviors supports high team performance 25% 29.5% 9% 15.9% 20.4% 3.23
International Journal of Management and Commerce Innovations ISSN 2348-7585 (Online) Vol. 7, Issue 2, pp: (1318-1337), Month: October 2019 - March 2020, Available at: www.researchpublish.com
In my organization personal control exercise at all level of management foster team work 36.3% 27.2% 4.5% 25% 6.8% 3.61
In my organization high level of mutual influence within team members lead to high team performance 29.5% 45.4% 9% 9% 6.8% 3.82
From table 3 above, it is evident that out of the 5-statements that were introduced to respondents to have their say, 1statement was strongly agreed on by majority of the respondents and this was statistically computed with a higher mean. 3-statements were agreed on by majority of the participants and these were indicated with highest means and 1-statement was disagreed on by majority of the respondents and this was indicated by lower means.
The response that was strongly agreed on by majority of the respondent was, ―In my organization personal control exercise at all level of management foster team work.” This was reported by 36.3% of the respondents and was represented by a mean of 3.61.
Among the responses that were agree on by majority of the respondents include; “In my organization high level of mutual influence within team members lead to high team performance” which was reported by 45.4% of the respondents and statistically computed with a mean of 3.82. 29.5% reported that “In Living Water Rwanda evaluation process based on the monitoring and evaluation of team’s behaviors supports high team performance”, this was represented by a mean of 3.23. “In my organization a high degree of team-member control foster team performance‖ was reported by 31.8% of the respondents and it was tabulated by a mean of 2.64.
Lastly, 36.4% of the respondents disagreed that “In my organization employees’ behaviors are monitor by the team leaders” and it had a mean of 3.09.
This position was further supported by the views from the interviews conducted where by majority of the interviewees indicated that organizational control that is put in place by Living Water Rwanda organization has facilitated in skill transfer among the teams which enables them to perform better and offer timely services. One of the key informants was quoted as saying, ―Team performance in a project rely so much on how the organization control its team members because they cannot haphazardly deliver with no much control form the project managers and directors…”
On the other hand, from the FGD discussions conducted with team leaders, it was evidenced that organizational control is a pillar for team performance as it acts as a basis for knowledge sharing and development.
The findings are directly in agreement to what earlier scholars had argued in the literature, such as , Tannenbaum (1968) who argued that a high degree of control by the manager is necessary for the efficient administration of an organization and, at the same time, a high degree of team-member control is also necessary to foster identification, motivation, and loyalty hence leading to high team performance.
In this case thus, it can be reached organizational control in Living Water Rwanda organization to a large extent has improved on team performance since majority of the responses that were presented to respondents were agreed on, interviews were also in support of that positions as well as the FGDs conducted in the area.
Findings on reward criteria in Living Water Rwanda
To establish the reward criteria of Living Water Rwanda, the respondents were introduced different items to have their say. Their responses were computed by making an aggregate of responses given by respondents to the 5-statements and 5point Likert scale (1=Strongly agree, 2=agree, 3=Uncertain, 4=Disagree and 5=Strongly Disagree), which sought to understand the reward criteria of Living Water Rwanda which were categorized according to their percentages and means as follows:
Table 2: Findings on reward criteria
Items 1 2 3 4 5 Mean
In my organization reward lower the performance of team members 50% 45.4% 2.27% 2.27% 2.27% 4.05
In Living Water Rwanda organization good salary compensation promote project team work 22.7% 75% 2.27% 0% 0% 4.20
International Journal of Management and Commerce Innovations ISSN 2348-7585 (Online) Vol. 7, Issue 2, pp: (1318-1337), Month: October 2019 - March 2020, Available at: www.researchpublish.com
In my organization the degree to which rewards are allocated based on performance supports team work 50% 45.4% 2.27% 2.27% 2.27% 4.34
In Living Water Rwanda organization compensation based on task significance supports team work 63.5% 27.2% 0% 4.5% 4.5% 4.45
Reward given based on task autonomy promote team work 72.7% 22.7% 2.27% 0% 0% 4.68
From table 4, it was established that out of the 5-statements that were introduced to respondents, 4-statements were strongly agreed on by most of the respondents and these were indicated to have the highest means, 1-statement was agreed on by most of the respondents and this had a relatively a high mean.
Among the responses that were strongly agreed on by most of the respondents include; “Reward given based on task autonomy promote team work”, this was reported by 72.7% of the respondents and it was measured with a mean of 4.68. “In Living Water Rwanda compensation based on task significance supports team work” was reported by 63.5% of the respondents and this was represented by a mean of 4.45. “In my organization the degree to which rewards are allocated based on performance supports team work” was represented by 50% of the respondents and this was indicated with a mean of 4.34. 50% of the respondents also admitted that “In my organization reward lower the performance of team members” and this was tallied with a mean of 4.05.
One items that was agreed on by most of the respondents was “In Living Water Rwanda good salary compensation promote project team work”, this was reported by 75% of the respondents and was calculated with a mean of 4.20
From the interviews that were conducted with managers of Living Water Rwanda, it was realized that most of them stood in support of the view that reward criteria has a relationship with project team performance because one of them in his own words was quoted,
“To all of us, money may not be the first priority but fundamentally, if a team member is not rewards as per the work done, it affect the whole team performance because a team is like a football team where one bad player can make the team to lose.”
He added, “Teams are usually creative and timely whenever they are rewarded equally and in time for work done….”
From the FGDs that were conducted with the team leaders, it was evident that all of them synonymously agreed that reward criteria of an organization affect team performance because if one member of a team earns more than the other, the level of attentiveness is reduced and they are always out to lament and this kills innovation.‖
All these views are similar to what had earlier been established in the literature by Gale (2004) who ascertained that, the importance of both organizational and individual culture (later in terms of personality) as important factors to decide if to reward employees. As a higher entrepreneurial culture is developed, the more likely rewards will be used, while a bureaucratic culture demands a fixed salary, without rewards. Slavin (1991) argues, that task characteristics need consideration. Indeed, a recent article by (Brown, 1995) emphasizes this trend by pointing out the rapid growth in group based rewards as opposed to individualistic based reward schemes.
Therefore, it can be reached that reward criterias used in Living Water Rwanda organization affect project team performance as it was completely assured by team members themselves with all items being strongly agreed on and agreed and continually supported by the views of the interviewees, FGDS and early literature reviewed.
Findings on Risk tolerance in Living Water Rwanda
To understand the risk tolerance in Living Water Rwanda, the respondents were introduced different statements to have their say. Their responses were computed by making an aggregate of responses given by respondents to the 5-statements and 5point Likert scale (1=strongly agree, 2=agree, 3=Uncertain, 4=Disagree and 5=Strongly Disagree), which sought to understand risk tolerance in Water Living Rwanda which was categorized according to their percentages and means as follows:
International Journal of Management and Commerce Innovations ISSN 2348-7585 (Online) Vol. 7, Issue 2, pp: (1318-1337), Month: October 2019 - March 2020, Available at: www.researchpublish.com
Table 3: Findings on Risk tolerance
Statements 1 2 3 4 5 Mean
In my organization risk is beneficial and it enables opportunities among team members 9% 15.9% 6.8% 29.5% 38.6% 2.27
Project team better understanding on risk-taking promote team performance 18.8% 15.9% 4.5% 36.3% 25% 2.59
In my organization the degree to which employees are encouraged to be risk seeking supports team performance 29.5% 31.8% 6.8% 22.7% 9% 3.50
In Living Water Rwanda organization managers same opinion of risk-taking with team members supports high team performance 47.7% 18.8% 4.5% 20.4% 9% 3.73
In my organization risk avoidance strategy foster team performance 50% 25% 4.5% 11.3% 9% 3.82
It is evidenced in table 4.3 that out of the 5-statements that were introduced to participants, 2- statements were strongly agreed on by most of the respondents and these were shown with the highest means, 1-statement was agreed on by majority of the respondents and it was indicated with a relatively higher mean, 1-statement was disagreed on and 1statement was strongly disagreed with.
The two items that were strongly agreed on by majority of the respondents included; “In my organization risk avoidance strategy foster team performance” which was reported by 50% of the respondents and represented by a mean of 3.82 whilst 47.7% of the respondents indicated that “In Living Water Rwanda managers same opinion of risk-taking with team members supports high team performance.” This had a mean of 3.73.
Additionally, 29.5% agreed that ―In my organization the degree to which employees are encouraged to be risk seeking supports team performance” and this was measured with a mean of 3.50.
36.3% of the respondents disagreed that ―Project team better understanding on risk-taking promote team performance.” This was computed with a mean of 2.59 and 38.6% strongly disagreed that “In my organization risk is beneficial and it enables opportunities among team members” and this was computed with a mean of 2.27
From the interviews conducted, it was found out that all of the respondents were in support of the opinion that risk tolerance is totally related to project performance in Living Water Rwanda. For instance, one of the project managers in Living Water Rwanda was quoted saying, ―In our organization, we have a risk avoidance strategy which has helped so much our teams to be efficient and effective in their services or works…..‖
Contrary, form the FGDs conducted, it was crystal clear that most of the discussants didn‘t believe that Living Water Rwanda‘s managers were risk tolerant, they wholesomely disagreed that risk tolerance in Living Water Rwanda had not impacted on project team performance.
On the other hand, according to Tversky and Kahneman (1992), the ascertained that the reference points that people use to evaluate risky prospects affect risk-taking and hence leading to high team performance. In this respect, risk tolerance is a subjective notion in the absence of clear and uniform communication and tools for risk analysis. Risk tolerance is still a developing area of research because of its human dynamics. Pratt (1964), Arrow (1965), and Ross (1981) adds that or possessed a far too simple conception of risk tolerance: to put it simply, individual decision-makers are risk averse. In fact, a person does not necessarily choose to be compensated for variability in outcomes. Many other circumstances shape attitudes toward risk, and thus risk tolerance is a complex topic demanding a more complex definition. Taking big risks can be beneficial to a firm that is able to accept them because it leads to high performance among the team. For this reason, risk must be defined as including the probability of both good and bad outcomes. It is in this context that we analyze risk tolerance correctly and understand some managers‘ ability for risk-taking.
Therefore, given the fact that most of the responses and respondents were in support of the view that risk tolerance was being practiced and part of the organizational culture Living Water Rwanda organization, it is purely true that this can improve on project team performance
International Journal of Management and Commerce Innovations
ISSN 2348-7585 (Online) Vol. 7, Issue 2, pp: (1318-1337), Month: October 2019 - March 2020, Available at: www.researchpublish.com
Findings on Project team performance in Living Water Rwanda
To establish the level of project team performance in Living Water Rwanda, the respondents were introduced different statements to have their say. Their responses were computed by making an aggregate of responses given by respondents to the 5-statements and 5point Likert scale (1=strongly agree, 2=agree, 3=Uncertain, 4=Disagree and 5=Strongly Disagree), which sought to understand project team performance in terms of effectiveness, efficiency and timeliness in Living Water Rwanda. These are tabulated as shown in different themes below; Findings on effectiveness of project teams in Living Water Rwanda
To establish the effectiveness of project teams in Living Water Rwanda, the respondents were introduced different statements to have their say. Their responses were computed by making an aggregate of responses given by respondents to the 5-statements and 5point Likert scale (1=strongly agree, 2=agree, 3=Uncertain, 4=Disagree and 5=Strongly Disagree), which sought to understand effectiveness of project teams in Living Water Rwanda which was categorized according to their percentages and means as follows:
Table 4: Effectiveness of project teams
Statements
1 2 3 4 5 Mean
Ability to forecast final cost and schedule outcome result from organizational culture within the organization 9% 0% 0% 54.5% 22.7 1.91
In my organization (work product) conforms to requirements of employees‘ culture 15.9% 40.9% 18.8% 4.5% 20.4% 3.52
In my organization process output is supportive of organizational culture 38.6% 15.9% 22.7% 13.6% 9% 3.68
Employees are doing the right things in my organization 15.9% 75% 4.5% 4.5% 2.7 3.91 Processes and tools used generate strong organizational culture within the organization 57.2% 31.8% 9% 4.5% 2.7 4.27
The study findings in table 6 above, it clear that out of 5-statements that were introduced to respondents, 1-statement was strongly agreed and this was computed with the highest mean, 1-statement was agreed on and this had a relatively higher mean, 1-statement was disagreed and 1-item was strongly disagreed and these were indicated with lower means.
The response that was strongly agreed was; “Processes and tools used generate strong organizational culture within the organization” this was reported by 57.2% of the respondents and had a mean of 4.27.
75% of the respondents agreed that “Employees are doing the right things in my organization‖ and this was indicated with a mean of 3.91
40.9% of the respondents disagreed that “In my organization (work product) conforms to requirements of employees’ culture.‖ This was computed with a mean of 3.52, whilst 54.5% of the respondents indicated that “Ability to forecast final cost and schedule outcome result from organizational culture within the organization‖ and this was indicated with a mean of 1.91.
Those who strongly disagreed (38.6%) indicated that “In my organization process output is supportive of organizational culture” and this was a mean of 3.68.
From the interviews conducted, it was evident that most of the managers indicated that there have been higher levels of effectiveness among the team members especially when it comes to meeting desired results in time. On the other hand, FGDS didn‘t indicate higher levels of effectiveness among project teams in Living Water Rwanda and their reason is that there have been so many things that have not been met in time.
Findings on efficiency of project teams in Living Water Rwanda
To establish the efficiency of project teams in, the respondents were introduced different statements to have their say. Their responses were computed by making an aggregate of responses given by respondents to the 5-statememnts and 5point Likert scale (1=strongly agree, 2=agree, 3=Uncertain, 4=Disagree and 5=Strongly Disagree), which sought to understand efficiency of project teams in Living Water Rwanda which was categorized according to their percentages and means as follows:
International Journal of Management and Commerce Innovations ISSN 2348-7585 (Online) Vol. 7, Issue 2, pp: (1318-1337), Month: October 2019 - March 2020, Available at: www.researchpublish.com
Table 5: Efficiency of project teams
Statements 1 2 3 4 5 Mean
The degree to which the process produces the required output at minimum resource cost is supportive of organizational culture 4.5% 4.5% 20.4% 43% 22.7% 2.45
Accomplishing project objectives ahead of schedule and under budget is supportive of organizational culture 25% 25% 0% 22.7% 27.2% 2.98
Maximizing resource efficiency using a temporary group of members increase organizational culture within the organization 36.3% 27.2% 4.5% 6.8% 27.2% 3.39
In my organization we are doing things right due to culture 4.5% 77.2% 4.5% 6.8% 4.5% 3.75
The study findings in table 7 above, out of the 4-statements that were introduced to respondents to have their say, 1statement was strongly agreed by 3.63% of the majority of respondents (Maximizing resource efficiency using a temporary group of members increase organizational culture within the organization) and this had a relatively higher mean of 3.39. 1-statement was agreed on by 77.2% of the most of respondents (In my organization we are doing things right due to culture) and it was indicated by a mean of 3.75. 1-statement was disagree by 43% of the respondents (The degree to which the process produces the required output at minimum resource cost is supportive of organizational culture) and this was indicated by a mean value of 2.45. 1-item was strongly disagreed by 27.2% (accomplishing project objectives ahead of schedule and under budget is supportive of organizational culture) and this was indicated with a mean of 2.98.
The team leaders in FGDs took a different position, while indicating efficiency among project team in Living Water Rwanda organization basing on the reasoning of task accomplishment and value addition qualities realized in the organization. This line of argument was also supported by interviewees saying that there are has been increased levels of efficiency.
Findings on Timeliness of project teams in Living Water Rwanda
To establish the timeliness of project in Living Water Rwanda, the respondents were introduced different items to have their say. Their responses were computed by making an aggregate of responses given by respondents to the 5-items and 5point Likert scale (1=strongly agree, 2=agree, 3=Uncertain, 4=Disagree and 5=Strongly Disagree), which sought to understand timeliness of project teams in service delivery in Living Water Rwanda which was categorized according to their percentages and means as follows:
Table 6: Timeliness
Statements 1 2 3 4 5 Mean
The length at which the work was done correctly and on time result from organizational culture 4.5% 6.8% 6.8% 43% 38.6% 1.95
What constitutes timelines for a given unit of work is part of organizational culture 29.5% 6.8% 13.6% 15.9% 31.8% 2.89
Ability to mitigate cost and schedule deviation is part of organizational culture 22.7% 22.7% 22.7% 9% 22.7% 3.30
Criteria based on customers requirement result from organizational culture 9% 52.2% 15.9% 13.6% 9% 3.55
From table 8 above, it is clearly indicated that on the 4-statements that were introduced to respondents to measure timeliness among project team services 52.2% of the respondents agreed that “Criteria based on customers requirement result from organizational culture” and it has mean of 3.55. 22.7% of the respondents were uncertain whether ―ability to mitigate cost and schedule deviation is part of organizational culture‖ and this was indicated with a mean of 3.30.
International Journal of Management and Commerce Innovations
ISSN 2348-7585 (Online) Vol. 7, Issue 2, pp: (1318-1337), Month: October 2019 - March 2020, Available at: www.researchpublish.com
On the other hand, 43% of the respondents disagreed that ―The length at which the work was done correctly and on time result from organizational culture Project” and this was computed with the lowest mean of 1.98. Lastly, 31.8% of the respondents strongly disagreed that “what constitutes timeliness for a given unit of work is part of organizational culture” and this was measured with a mean of 2.89
Relationship between organizational control and team performance
In the virtue to answer this question on whether organizational control has an influence on project team performance in Living Water Rwanda, a bivariate analysis was computed between one of the indicators of organizational control and project team performance as they were reported by the respondents to find out whether there is a correlation between the two. Below are the results in table 9.
Table 7: Correlation between organizational control and project team performance
The length at which the work was done correctly and on time result from organizational culture
The length at which the work was done correctly and on time result from organizational culture
In my organization personal control exercise at all level of management foster team work
In my organization personal control exercise at all level of management foster team work
Pearson Correlation 1 .736** Sig. (2-tailed) .000 N 44 44
Pearson Correlation .736** 1 Sig. (2-tailed) .000 N 44 44
**. Correlation is significant at the 0.01 level (2-tailed).
From the table 9 above showed that a Pearson Correlation Coefficient value is (r=.736). According to Critical Values of the Pearson Product-Moment Correlation Coefficient, when using the critical value table, the absolute value of r=.736 indicates a positive relationship, strong relationship and a significant relationship (.000<.05) between control and project team performance. This implies that organizational control has a significant influence on project team performance in ALARM organization. This thus means that organizational control practiced in ALARM organization has improved on team
Performance
Reward criteria have on project team performance in Living Water Rwanda
In the virtue to answer this question on whether reward criteria has an influence on project team performance in Living Water Rwanda, a bivariate analysis was computed between one of the indicators of reward system and project team performance as they were reported by the respondents to find out whether there is a correlation between the two. Below are the results in table 10.
Table 8: Correlation between reward criteria and project team performance
The length at which the work was done correctly and on time result from organizational culture
The length at which the work was done correctly and on time result from organizational culture
Reward given based on task autonomy promote team work
Reward given based on task autonomy promote team work
Pearson Correlation 1 .214** Sig. (2-tailed) .056 N 44 44
Pearson Correlation .214** 1 Sig. (2-tailed) .056 N 44 44
International Journal of Management and Commerce Innovations ISSN 2348-7585 (Online) Vol. 7, Issue 2, pp: (1318-1337), Month: October 2019 - March 2020, Available at: www.researchpublish.com
The length at which the work was done correctly and on time result from organizational culture
The length at which the work was done correctly and on time result from organizational culture
Reward given based on task autonomy promote team work
Reward given based on task autonomy promote team work
Pearson Correlation 1 .214** Sig. (2-tailed) .056 N 44 44
Pearson Correlation .214** 1 Sig. (2-tailed) .056 N 44 44
**. Correlation is significant at the 0.01 level (2-tailed).
From the table 10 above showed that a Pearson Correlation Coefficient value is (r=214). According to Critical Values of the Pearson Product-Moment Correlation Coefficient, when using the critical value table, the absolute value of r=.214 indicates a negative relationship, weak relationship and a insignificant relationship (056>.05) between reward criteria and project team performance. Therefore, it can be established that reward criteria has negative influence on project team performance in Living Water Rwanda. This thus means that if Living Water Rwanda organization wants to improve the performance of project teams, there is a need to invest so much in the criteria of rewarding its teams used.
Risk tolerance and project team performance in Living Water Rwanda
In the virtue to answer this question on whether risk tolerance has an influence on project team performance in Living Water Rwanda, a bivariate analysis was computed between one of the indicators of risk tolerance and project team performance as they were reported by the respondents to find out whether there is a correlation between the two. Below are the results in table 11.
Table 9: Risk tolerance and project team performance
The length at which the work was done correctly and on time result from organizational culture
The length at which the work was done correctly and on time result from organizational culture
Project team better understanding on risk-taking promote team performance
Project team better understanding on risktaking promote team performance
Pearson Correlation 1 .845** Sig. (2-tailed) .000
N 44 44
Pearson Correlation .845** 1 Sig. (2-tailed) .000 N 44 44
**. Correlation is significant at the 0.01 level (2-tailed).
From the table 11 above showed that a Pearson Correlation Coefficient value is (r=845), according to Critical Values of the Pearson Product-Moment Correlation Coefficient, when using the critical value table, the absolute value of r=.845 indicates a positive relationship, strong relationship and significant relationship (.000<.05). Therefore, it can be established there is a significant relationship between risk tolerance and project team performance in living Water Rwanda. This thus means that risk tolerance adopted by Living Water Rwanda has a positive influence on project team performance.
5. SUMMARY, CONCLUSIONS AND RECOMMENDATIONS
The study was carried out in order to establish the relationship between organizational culture and project team performance using Living Water Rwanda. The introduction of this study shade more light on the essential elements and background of organizational culture and project team performance. Many literature and academic publications from
International Journal of Management and Commerce Innovations
ISSN 2348-7585 (Online) Vol. 7, Issue 2, pp: (1318-1337), Month: October 2019 - March 2020, Available at: www.researchpublish.com different authors about the study variables were also presented. The specific objectives of the study were; to investigate the influence of control on project team performance in Living Water Rwanda to examine the influence of reward criteria on project team performance in Living Water Rwanda and to analyze the influence of risk tolerance on project team performance in Living Water Rwanda. At the end of the study, it was found out that organization control and risk tolerance had a positive influence on project team performance in Living Water Rwanda whilst reward criteria had a negative influence on project team performance.
Summary of finding for the first objective
The first objective of the study examined the influence of organizational control on project team performance in Living Water Rwanda. The study findings indicated that organizational control has a significant influence on project team performance in Living Water Rwanda. This is because most of the responses that were put forward to respondents were strongly agreed and agreed by majority of the respondents and these were indicated by higher means. For instance; most of the respondents agreed that: ―In my organization personal control exercise at all level of management foster team work,‖ ―In my organization high level of mutual influence within team members lead to high team performance,‖ ―In Living Water Rwanda evaluation process based on the monitoring and evaluation of team‘s behaviors supports high team performance‖, and ―In my organization a high degree of team-member control foster team performance‖
This position was further supported by the views from the interviews conducted where by majority of the interviewees indicated that organizational control that was put in place by Living Water Rwanda has facilitated in skill transfer among the teams which enables them to perform better and offer timely services. This was also the same line of argument documented from FGD discussions conducted team leaders who indicated that organizational control is a pillar for team performance as it acts as a basis for knowledge sharing and development. The findings are directly proportional to what earlier scholars had argued in the literature. For instance, Tannenbaum (1968) argued that a high degree of control by the manager is necessary for the efficient administration of an organization and, at the same time, a high degree of teammember control is also necessary to foster identification, motivation, and loyalty hence leading to high team performance. In this case thus, it can be reached organizational control in Living Water Rwanda organization to a large extent has improved on team performance since most of the responses that were presented to respondents were agreed on, interviews were also in support of that positions as well as the FGDs conducted in the area.
The second objective of the study assessed the influence of reward criteria on project team performance in Living Water Rwanda. The study found out that reward criteria had a negative influence on project team performance in Living Water Rwanda. This meant that organization has not invested enough in the way they reward their teams which had led lack of any impact. This is evident from the responses that were agreed on by most of the respondents and these had higher means which depicted a negative influence. Among the responses that were strongly agreed on by most of the respondents include; ―Reward given based on task autonomy promote team work‖, ―In Living Water Rwanda compensation based on task significance supports team work‖ ―In my organization the degree to which rewards are allocated based on performance supports team work‖ ―In my organization reward lower the performance of team members‖ and ―In Living Water Rwanda good salary compensation promote project team work‖. These views were proportionate to what managers of organization indicated who indicated that reward criteria is fundamental factor for improving project team performance and due to lack of enough funds, it sometimes becomes difficult to meet all the criteria required. From the FGDs that were conducted with the team leaders, it was evident that all of them synonymously agreed that reward criteria of Living Water Rwanda wasn‘t equivalent and lacked equity which affected project team performance because if one member of a team earns more than the other, the level of attentiveness is reduced and they are always out to lament and this kills innovation. All these views are similar to what had earlier been established in the literature by Gale (2004) who ascertained that, the importance of both organizational and individual culture (later in terms of personality) as important factors to decide if to reward employees. As a higher entrepreneurial culture is developed, the more likely rewards will be used, while a bureaucratic culture demands a fixed salary, without rewards. Slavin (1991) argues, that task characteristics need consideration. Indeed, a recent article by (Brown, 1995) emphasizes this trend by pointing out the rapid growth in group based rewards as opposed to individualistic based reward schemes.
Therefore, it can be reached that reward criteria‘s used in the organization influenced negatively project team performance as it was completely assured by team members themselves with all items being strongly agreed on and agreed and continually supported by the views of the interviewees, FGDS and early literature reviewed.
International Journal of Management and Commerce Innovations ISSN 2348-7585 (Online) Vol. 7, Issue 2, pp: (1318-1337), Month: October 2019 - March 2020, Available at: www.researchpublish.com
The third objective of the study analyzed the influence of risk tolerance on project team performance in Living Water Rwanda The study findings indicated that risk tolerance had a significant and positive influence on the project team performance in Living Water Rwanda. This is so because most of the responses that were put forward to respondents to react on with a pre-conceived mind and connotation of positivity were strongly agreed and agreed on by most of the respondents and had highest means despite one of them was disagreed. The two items that were strongly agreed on by most of the respondents included; ―In my organization risk avoidance strategy foster team performance‖, ―In Living Water Rwanda managers same opinion of risk-taking with team members supports high team performance‖ and ―In my organization the degree to which employees are encouraged to be risk seeking supports team performance‖ This position was supported by the opinions of key informants or managers of Living Water Rwanda that risk tolerance is totally related to project performance in Living Water Rwanda where one of the managers ascertained that they have a risk avoidance strategy which has helped so much our teams to be efficient and effective in their services or works. On Contrary, from the FGDs conducted, it was crystal clear that most of the discussants didn‘t believe that the managers were risk tolerant, they wholesomely disagreed that risk tolerance in Living Water Rwanda had not impacted on project team performance. On the other hand, according to Tversky and Kahneman (1992), the ascertained that the reference points that people use to evaluate risky prospects affect risk-taking and hence leading to high team performance. In this respect, risk tolerance is a subjective notion in the absence of clear and uniform communication and tools for risk analysis. Risk tolerance is still a developing area of research because of its human dynamics. Pratt (1964), Arrow (1965), and Ross (1981) add that or possessed a far too simple conception of risk tolerance: to put it simply, individual decision-makers are risk averse. In fact, a person does not necessarily choose to be compensated for variability in outcomes. Many other circumstances shape attitudes toward risk, and thus risk tolerance is a complex topic demanding a more complex definition. Taking big risks can be beneficial to a firm that is able to accept them because it leads to high performance among the team. For this reason, risk must be defined as including the probability of both good and bad outcomes. It is in this context that we analyze risk tolerance correctly and understand some managers‘ ability for risk-taking. Therefore, given the fact that most of the responses and respondents were in support of the view that risk tolerance was being practiced and part of the organizational culture Living Water Rwanda, it is purely true that this can improve on project team performance.
Conclusion
The conclusion was based on the objectives of the study
1. Basing on the findings, the study concluded that there is a positive influence of organisational control on project team performance in Living Water Rwanda This means that the organisation has put so many efforts to see that they control their team‘s work performance.
2. The study concluded that there is a negative influence of reward criteria on project team performance. This means that organisational reward criteria of Living Water Rwanda lacks equity and this negatively affects the project team performance.
3. There is a positive influence of risk tolerance on project team performance in Living Water Rwanda organisation. This means that the organisation‘s management or project managers are risk tolerant and this has improved project team performance.
Recommendations
The recommendations are based on the objectives of the study
1. From the findings, the study recommends that there is a significant need for Living Water Rwanda in the virtue of improving project team performance and project success at large to see that they put in place formal guidelines to be followed in controlling staffs which are balanced on each and every one. This is because it was evident in this study that the management styles adopted by project managers in one way or the other affect the performance of project teams.
2. The researcher recommends that on the second objective, there is a substantial need for Living Water Rwanda to come up with a reward criterion that is equitable to all project team members because the way of rewarding that is available in the organization cannot stimulate efficiently and effectively the performance of project teams which is too important. Here, the organization can adopt bonuses and allowances to staffs who work better than others
International Journal of Management and Commerce Innovations ISSN 2348-7585 (Online) Vol. 7, Issue 2, pp: (1318-1337), Month: October 2019 - March 2020, Available at: www.researchpublish.com
3. On the last objective, it should be noted that risk tolerance in the organization of Living Water Rwanda s available but it is practiced on individual level management; this means that sometimes some of the managers of the project may not adopt it. So, risk tolerance need to be inculcated into the organizational culture of Living Water Rwanda as this will fasten the activities of the project teams.
References
[1] Aguanno, K. (2003). 101 Ways to Reward Team Members. London. Multi-Media Publications,
[2] Amin E. M. (2005). Social Science Research, Conception, Methodology and Analysis, Kampala. Makerere University Press.
[3] Ancona, D., Caldwell, D. (1992). "Demography and design: predictors of new product team performance", Organization Science, 3 (3), 321-41
[4] Armstrong M. (2006). A Handbook of Human Resource Management Practice. London and Philadelphia Kogan Page
[5] Armstrong, M. (2002). Employee Reward, third edition London. CIPD House,
[6] Arrow, K.J. (1965). Aspects of the Theory of Risk Bearing. Helsinki. Yrjo Jahnssonis Saatio
[7] Bass, B.M. (1980). Team productivity and individual member competence. Small Group Behaviour, 11 (4), 431504.
[8] Beard RL and Salas E. (1992). Team building and its influence on team effectiveness: An examination of conceptual and empirical developments, in Kelley K.
[9] Bettenhausen, K.L. (1991). Five years of group‘s research: what we have learned and what needs to be addressed. Journal of Management. 17 (20), 345-381.
[10] Betts, et al. (2005). Relationship between team characteristics and team performance.
[11] Brown and Latham.(1999). Relationship between team’s characteristics and team performance. Brown, D. I. (1995). Team-based reward plans. Team Performance Management. 1(5), 23-31.
[12] Burgoon, M. and Ruffner, M. (1978). Human communication. U.S.A Holt, Rinehart & Winston.
[13] Cannon-Bowers et al. (1995). Characteristics of teams and team performance.
[14] Cohen, S.G & Bailey, D.E. (1997). What makes teams work: Group effectiveness research from the shop floor to the executive suite. Journal of management, 23 ( 3), 239-290
[15] Cole, G. A. (2002). Personnel and human resource management. London: Prentice Hall.
[16] Construction Industry Institute (2010). Improving the Accuracy and Timeliness of Project Outcome Predictions
[17] Cronbach, L.J. (1971). Test validation, in R.L. Thorndike (ed.). Educational measurement Washington D.C: American Council of Education.
[18] David MC court.( 2013). Definition of population
[19] Deal TE, Kennedy AA. (2000). Corporate Cultures Cape Town. Perseus Publishing.
[20] Decenzo, A.P. & Robbins, P.S. (2002). Personnel: Human resource management (3rd ed.). New Delhi: Prentice Hall of India, Private Limited.
[21] Dorgan, C.E. (1994). Productivity Link to the Indoor Environment Estimated Relative to ASHRAE 62-1989 Proceed.
[22] Flamholtz, E.G., T.K. Das and A.S. Tsui.(1985). 'Toward an Integrative Framework of Organizational Control," Accounting Organizations and Society, 10 (1), 35-50.
[23] Gale, T. (2004) Highlights the importance of both organizational and individual culture (later in terms of personality) as important factors to decide if to reward employees.
International Journal of Management and Commerce Innovations ISSN 2348-7585 (Online) Vol. 7, Issue 2, pp: (1318-1337), Month: October 2019 - March 2020, Available at: www.researchpublish.com
[24] Gruenfeld, D H (1995). Status, ideology, and integrative complexity on the U.S. Supreme Court: rethinking the politics of political decision making. Journal of Personality Soc. Psychol., 68 (51), 5-20.
[25] Guzzo, R.A., & Dickson, M.W. (1996). Teams in organizations: Recent Research on performance and effectiveness. Annual Review Psychology, 47 (58), 308-344
[26] Jacoby, S.M. (1984). Employing bureaucracy: Managers, unions and the transformation of work in American industry (1990-1945. New York: Columbia University Press.
[27] Jarrett, E.L.( 2000). The role of risk in business decision-making, or how to stop worrying and love the bombs. Research Technology Management. Industrial Research Institute, 8 (10), 44–46
[28] Kaczynski, M. (2002). Human resource management in service work. London: Palgrave.
[29] Kauffman, D. B.E. & Soucell D. (2008). Advances in industrial and labor relations. JAI Press Greenwich CT. 7(11), 146-76).
[30] Keller, R. (1986). "Predictors of the performance of project groups in R&D organizations", Educational and psychological measurement, 30 (35), 607-610.
[31] Krejcie, R.V. & Morgan, D.W. (1970). Determining sample size for research activities: New Delhi. Mchill Publishers Limited
[32] Likert, R.(1961). New Patterns of Management. New York: McGraw-Hill.
[33] Mahandis M (2013). Program manager at ALARM-org
[34] Maicibi, N.A. & Nkata, J.L. (2005). Introduction to human resource management. Kampala: Masah Publishers Limited.
[35] Maicibi, N.A. (2003). Pertinent issues in employees‟ management (1st ed.). Kampala: M.R.K Graphics.
[36] March, J.G., Shapira, Z.(1987). Managerial perspectives on risk and risk taking. ManagementScience 33(11), 1404–1418
[37] Megginson, D., Banfield, P. & Mathews, J.J. (1999). Human resource on the influence of organizational culture on project team performance in NGOs using a specific reference of Living Water Rwanda management. ( 2nd ed.). London. Kogan Page Ltd:.
[38] Mottaz, C.J. (1988). Determinants of Organizational Commitment: Human Relations. 41(6), 467-82.
[39] Mugenda O. M and Mugenda A.G., (2003) Research Methods: Quantitative and Qualitative approaches.African Centre for Technology Studies (ACTS), Nairobi, Kenya
[40] Musoke, N. (1998). Training programs and workers‘ performance at Uganda Posts &Telecommunications Cooperation. Unpublished Masters Dissertation, School of Education, Makerere University, Kampala.
[41] Naveen Jain. (2008). Organizational change and intervention strategies. NGOs, Annual analysis report. (2013).
[42] Oso, W. Y., & Onen, D. (2008). Writing research proposal and report: A handbook.
[43] Ouchi, W.G. (1979). "A Conceptual Framework for the Design of Organization Control Mechanisms," Management Science, 25 (9), 833-848.
[44] Parker, G. (1990). Team Players and Teamwork: The New Competitive Business Strategy, Public Personnel Management, Winter, 10 (11), 387-402.
[45] Pratt, J.W.(1964). Risk aversion in the small and in the large. Econometrica 32 (35), 122 136.
[46] Ross, S.A.(1981). Some stronger measures of risk aversion in the small and in the large with applications. Econometrical 49 (50), 621–638.
[47] Saleemi, N.A. & Bogonko, J.B.(1977). Management principles and practice simplified. Nairobi: N.A Saleemi publishers.
[48] Schein.(1992). ―The role of the founder in creating organizational culture. Family Business Review, 8, (3), 221-238.
