GILBERT ARIZONA RESIDENTIAL REAL ESTATE

4TH QUARTER REPORT
OCTOBER–DECEMBER 2022
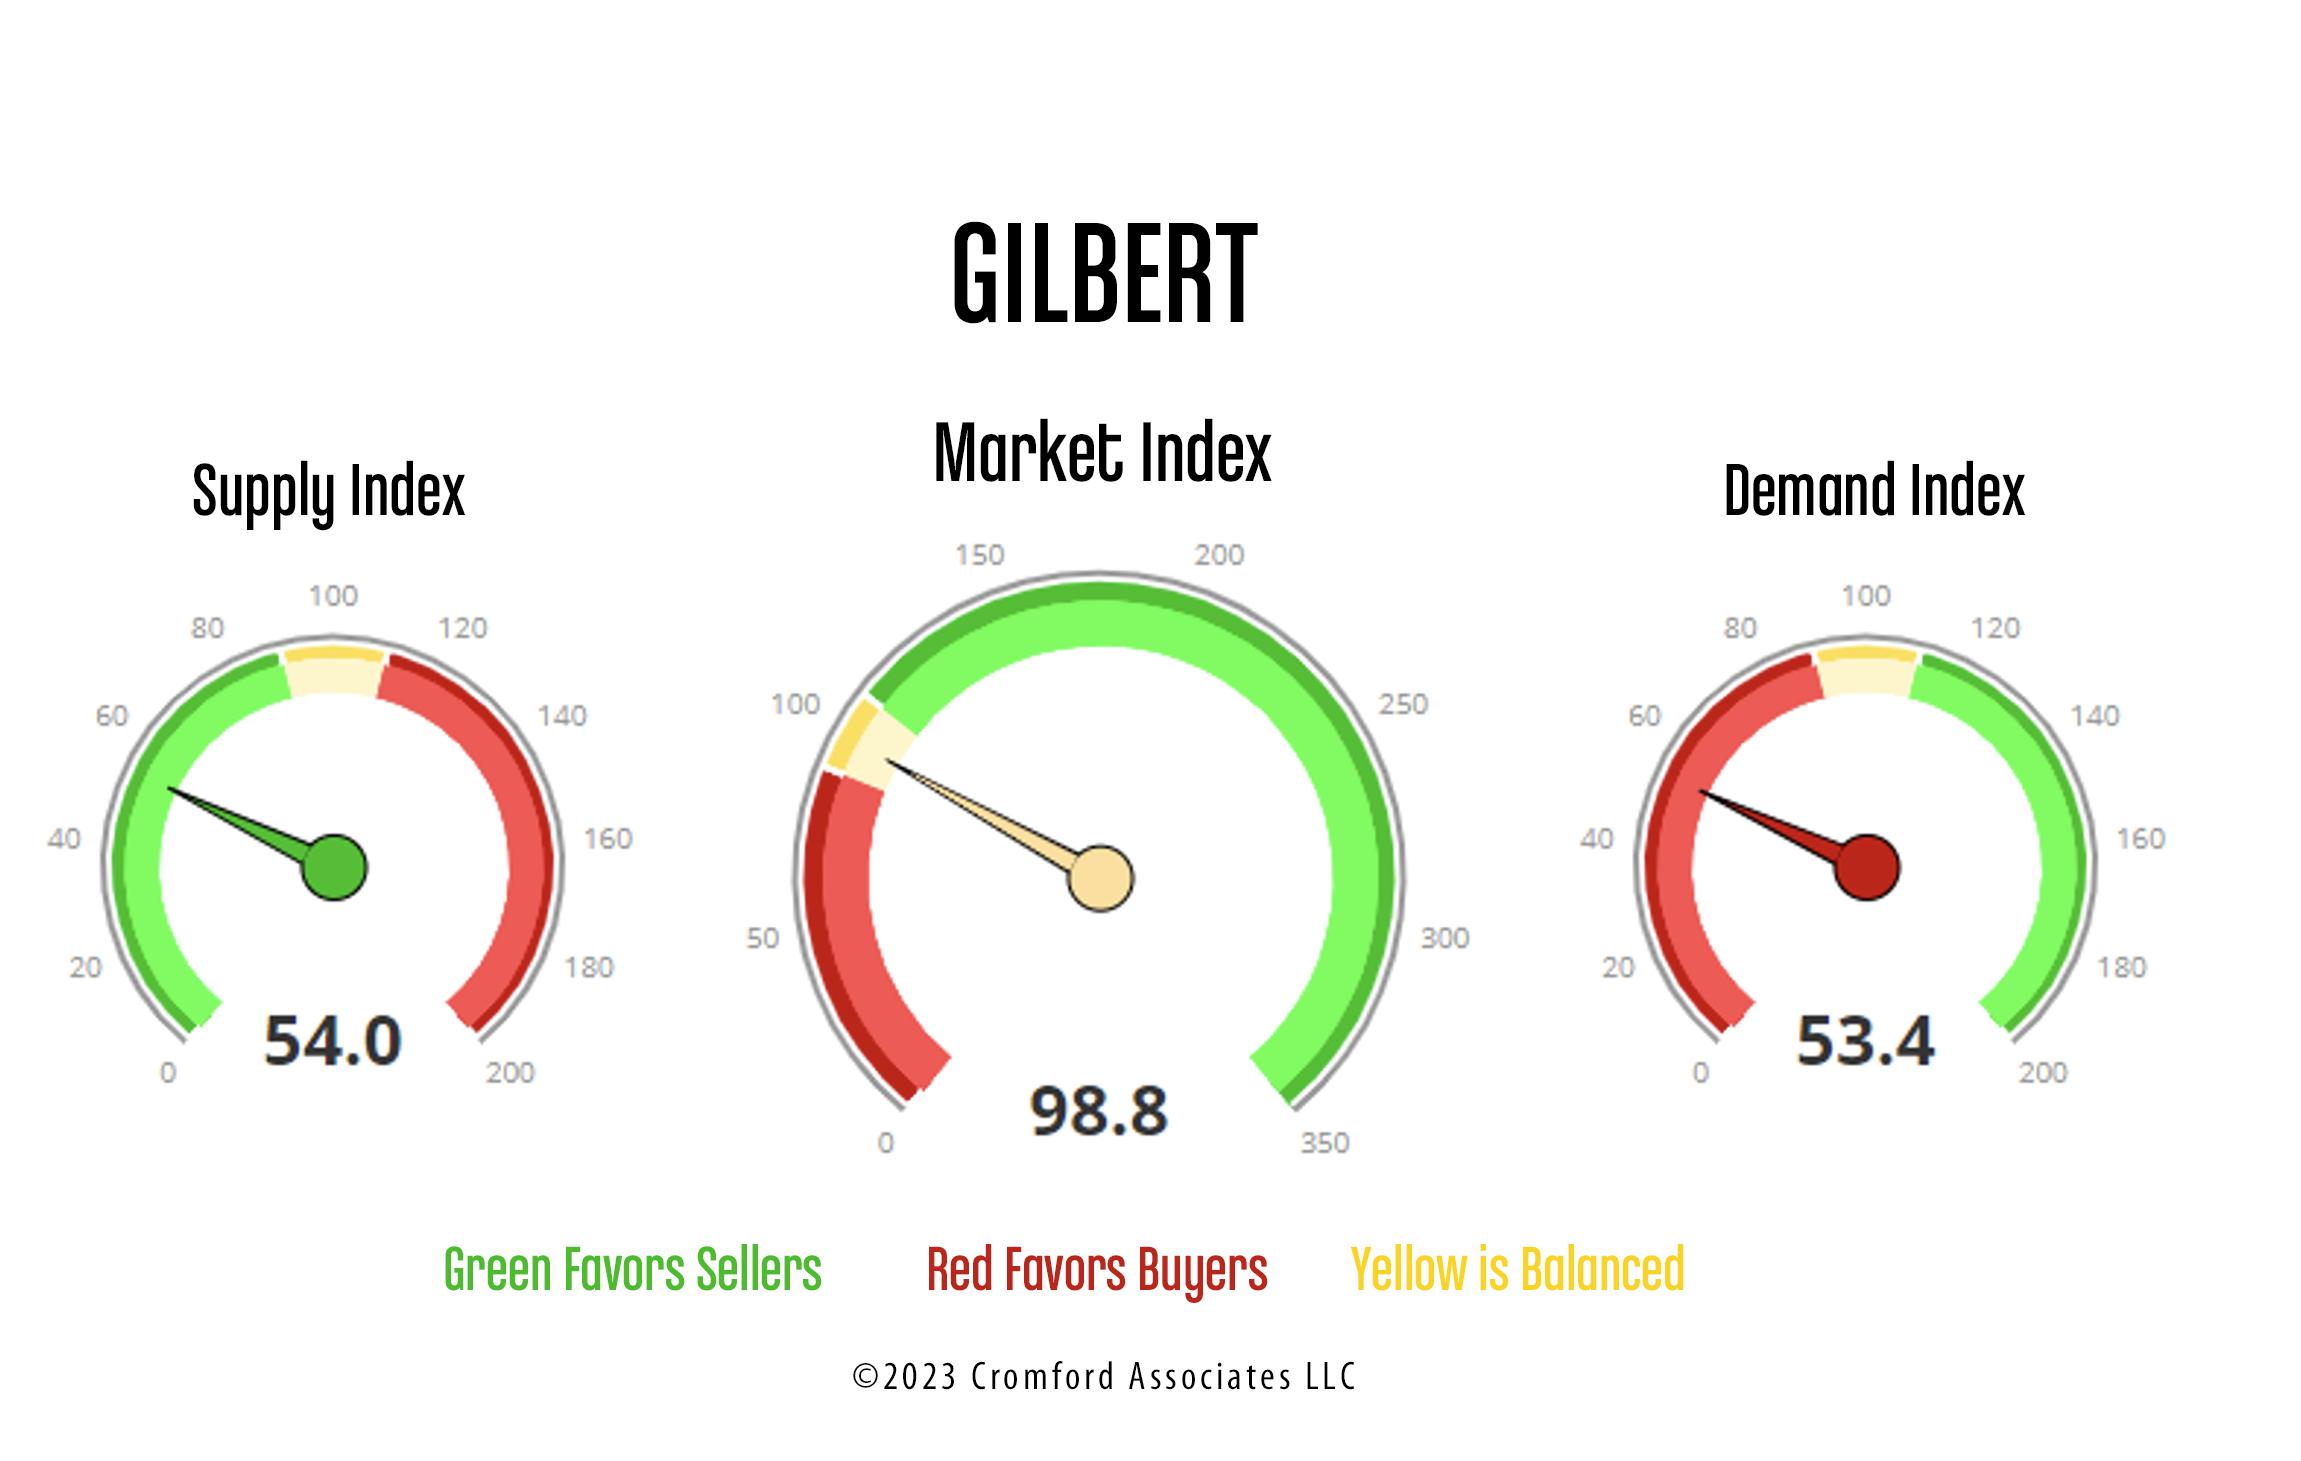
Cromford Index
The Cromford Report uses the Supply, Market, and Demand Index to report the balance of the real estate market. The indexes calculate the active, pending, and sold listings statistics.
Cromford Supply Index ™ (CSI)
• Values above 110 indicate more supply than usual, while values below 90 indicate less supply than usual.
• At the end of the 3rd Quarter 2022, the CSI for Gilbert was 24.3% below where supply should be.
• At the end of the 4th Quarter 2022, the CSI for Gilbert is 46% below where supply should be. Supply is low.
As Arizona licensed real estate professionals with over 20 years’ experience, Reserve Key Realty analyzes the real estate market with a broad view, keeping Gilbert homeowners updated regarding the local real estate market. In 2022, the Federal Reserve raised interest rates to cool the U.S. economy and reduce inflation. The actions of the Federal Reserve have impacted the residential real estate market.
KEY POINTS
90-110 = Balance | 110+ = Sellers’ Market | 90- = Buyers’ Market
Cromford Market Index ™ (CMI)
• Values below 90 indicate a buyer’s market, while values above 110 indicate a seller’s market.
• At the end of the 3rd Quarter 2022, the CMI for Gilbert was 76, indicating the Gilbert real estate market favored buyers.

• At the end of the 4th Quarter 2022, the CMI for Gilbert is 98.8, indicating the Gilbert real estate market is balanced.

Cromford Demand Index ™ (CDI)
• Values above 110 indicate more demand than usual, while values below 90 indicate less demand than usual. Values of 90 - 110 indicate the demand is close to normal.
• At the end of the 3rd Quarter 2022, the CDI (buyer activity) for Gilbert was 42.5% below normal. Lower buyer activity means supply is not being reduced, leading to more homes being available to purchase.
• At the end of the 4th Quarter 2022, the CDI (buyer activity) is 46.6% below normal.
Reasons For No Real Estate Crash
The residential real estate market does not look like it is going to crash. Jobs are plentiful. The last housing cycle experienced 8 million job cuts. The current housing cycle has not had any job cuts. If people have jobs, they can pay their mortgage. Home inventory is low. During the last housing cycle inventory was up to 3.8 to 4 million homes. The current housing cycle has low inventory of 1 to 1.2 million homes. Mortgage delinquency is very low. The last housing cycle had a 10.1% delinquency rate. The current housing cycle has a 3.6% delinquency rate. Additional Key Variables in the table also trend in the direction that indicate there will not be a housing crash.

Home Price Crashing Coming?

Average Sales Price per Square Foot
The monthly average sales price per square foot for Gilbert 3rd Quarter ended at $277.33. The 4th Quarter 2022 ended at $271.86.
Quarterly Median Sales Price
The quarterly median sales price for Gilbert 3rd Quarter 2022 ended at $595,000. The 4th Quarter 2022 ended at $553,250.

Conclusion
The statistics for Gilbert show a slowing but balanced residential real estate market. With the backdrop of higher interest rates, it is reasonable to expect the price of homes to correct. However, National Association of Realtors statistical data shows that the residential real estate market will not experience a crash. Residential real estate market corrections are healthy and necessary to maintain solid future growth.
Sellers
It is necessary to take into consideration materials, location, amenities, and features when pricing a home properly. Proper pricing is an important factor to consider when you’re selling your home. If you want top dollar, it is best to have the right price the day your house goes onto the market. When you offer your home at its true market value, you’re giving yourself the best chance to get a great price for your home in a reasonable amount of time. Research indicates that the longer a house stays on the market, the number of days on market over the average period it takes to sell homes that are similar to yours, will work against you, and as a result your final selling price will be lower. If you overprice you might end up making less money than you would have if you’d priced your house correctly when it first listed.
Buyers
Reserve Key Realty is not promoting buying a home that you can’t afford. Can you afford a home? If so, now is the time to start searching. The market is balanced. Gone are the days of multiple offers and getting out bid. Buyers can expect better pricing and have negotiation power. For the last few years buyers were at the mercy of whatever sellers were asking. Buyers will have a more normal buying experience. Contingencies such as rate buy downs and assistance with closing costs are being accepted. That was not happening before in a seller’s market.
Elmo Griffin of Reserve Key Realty is a Pricing Strategy Advisor. If you would like a Professional Property Value Estimate or are interested in selling your home, please contact Reserve Key Realty to schedule a Marketing Consultation.
If your home is currently listed, this is not a solicitation for that listing.
reservekeyrealty.com | 480.206.9360