48 minute read
5. SITE SELECTION


The design dissertation is site specific to the portlands on the Eastern waterfront of Mumbai. This chapter explores the site history, criteria of site selection and data collected on the site study.
5.1. HISTORY OF MUMBAI
Advertisement
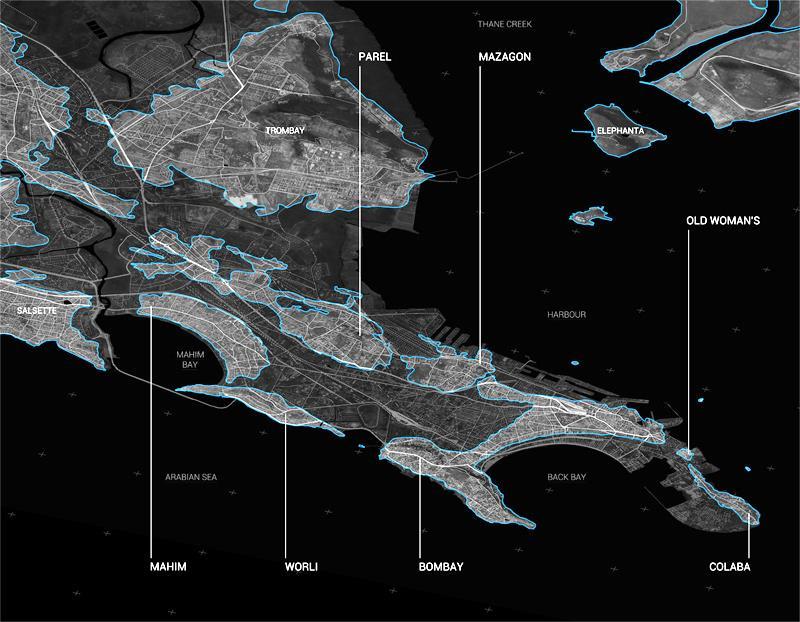
Mumbai is located on a peninsula on Bombay Island, which was once made up of seven islands off the Konkan coast of western India. Over the course of five centuries, the seven islands of Bombay formed an archipelago that was eventually physically linked by land reclamation efforts. The islands that made up the original archipelago were: Isle of Bombay, Colaba, Old Woman's Island (Little Colaba), Mahim, Mazagaon, Parel, and Worli.
The protected waters of Mumbai (Bombay) Harbour are to the east of the island. The low-lying plain of Bombay Island is flanked on the east and west by two parallel ridges of low hills, roughly one-fourth of which is below sea level. Mumbai Harbour is protected from the open sea by Colaba Point, a point formed on the extreme south by the longer of those hills.
Figure 116- ‘Island City’ Evolution. 1670, Original Seven Islands, Source- Noel Murphy
The old city stretched from Colaba Point on the southern point of Bombay Island to Mahim and Sion on the island's northern shore, covering roughly 26 square miles (67 square kilometres). Mumbai grew northward in 1950, including the huge island of Salsette, which was connected to Bombay Island by a bridge. (Darashaw, 2020)
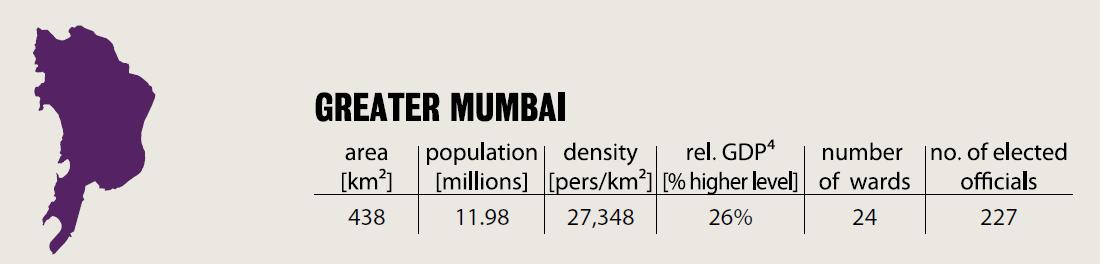
Mumbai is the capital of Maharashtra State, which is located in southern India. It is the country's financial and commercial capital, with the Arabian Sea as its main port. It is India's most populous city and the world's largest and densely inhabited urban regions, located on Maharashtra's coast.

Figure 117- ‘Island City’ Evolution. 1970-2019, Source- Noel Murphy

Mumbai Demographics
Mumbai's urban population is projected to be around 22 million people, making it India's most populous, commercially active, and densely inhabited metropolis. Over the last two decades, the metropolitan area has grown at an exponential rate, as is typical of Indian metropolises. The country's high population increase is due to migration from other regions, with people looking for business and job possibilities. (Source-World population review)
Mumbai's population has more than quadrupled since 1991, when the census revealed that the city's population was 9.9 million. The city's fast growth has resulted in significant health concerns and a huge number of inhabitants live in the city's slums. Mumbai is expected to have a population of 28 million people by 2030. According to these projections, the world's 6th most populated metropolis will rise to become the 4th most populous.
The statistical data given below shows the rapid growth of Mumbai city over the years.
AREA DENSITY POPULATION SEX RATIO LITERACY URBAN AGGLOMERATION
619 KM² 412 KM² 20,667,656 (census 2021) 853 89.73% 18,414,288 (post 2011)
Figure 118- Demographic Data of Mumbai City: Census 2011, Source- (LSE, 2015)


5.2. MUMBAI’S EASTERN WATERFRONT
The Eastern waterfront covers the 753.6 Hectors of land that stretches from Colaba to Wadala on East of city. Along with its location in both the geography of the city and the Metropolitan Region, the Waterfront is particularly intriguing and significant. Furthermore, in the local development scenarios and projections of a 'Golden Triangle' connecting Mumbai, Nashik, and Pune, the Eastern Waterfront would be critical for establishing connections between the old place and the territorial triangle – the latter of which currently contains new businesses, exceptional economic zones, and agricultural transit zones.
The eastern waterfront's potential and impact on the entire city is enormous, since it is nearly 4.5 times the size of the Mills lands, equivalent to 18 Oval maidens, 10 Chowpatty sea beaches, or 21 Priyadarshini parks. As a result, the research provided no recommendations about what may happen in the region but instead focuses on the current resources and potential of the eastern waterfront. The objective is to communicate with the public the possible role of Mumbai's future eastern waterfront—possibly the city's last large-scale planning opportunity, which would not only transform the city's densest sector but also interconnect it to the rest of the region. (Dobariya, 2020)

Figure 119- History of Mumbai, Source- Shourya Jain
MUMBAI’S EASTERNWATERFRONT – UPCOMING INFRASTRUCTURES
The Maharashtra government plans to turn the Mumbai Port region into a Sea Transport & Tourism Hub, in accordance with the changing urban fabric seeks to set a precedent for port areas in metropolitan cities. The Eastern coastline’s infrastructure expansion would influence the region's overall development and lifestyle. A substantial road and rail network runs along the eastern shore connecting the Eastern Freeway and the Central Railway line, two major regional routes. A few waterfront areas will also be used as passenger terminals for inter-city water-based travel to the Gateway of India.
Here are some of the major infrastructural projects that will have an influence on the area's overall growth and lifestyle:
Trans-harbour sea link – The 21.8-kilometer trans-harbour sea connection between Sewri and Nhava Sheva would be an architectural marvel, relieving current and future traffic congestion in the city. Furthermore, inhabitants of South
Mumbai would be able to go to Panvel's new international airport in 20 minutes.
7-km long marine drive between Mazagaon Docks and Wadala – Marine Drive 2.0, a 7-kilometer stretch of road running alongside the Mumbai Trans-Harbour
Link between Mazgaon Dock and Wadala, would improve connectivity and enhance the quality of life by providing beautiful vistas. The new Marine Drive will be roughly double the length of the Queen's necklace in the western coastline, making travel easy for Mumbai residents.
Sewri – Worli Link Bridge – The Sewri-Worli Link Bridge is a 4.5-kilometer elevated roadway that connects the MTHL (Mumbai Trans Harbor Link) under development at Sewri on the east with the planned coastal route at Worli on the west. Two rail over-bridges (RoB) at Sewri and another two-tier bridge at
Prabhadevi are part of the project.
Marina Project – Lastly, the Mumbai Port Trust plans to build a marina in Mumbai to accommodate the large number of boats that visit or are located there.
Mumbai Marina, Mumbai Eye, and ropeway to Elephanta Caves, gardens, bicycle paths, adventure sports, eco-park for flamingos, and seaside recreational activities would all benefit from the construction. The project promises to be the water-tourism-friendly shoreline that Mumbai has long yearned for.
The redevelopment of Mumbai's Eastern Waterfront will also provide 62 percent open space for the public, distinguishing the region from the rest of the city.


Figure 120- Infographic Urban Cross Section: Density to Open Space, Source- Mumbai: Shift
Figure 121- Existing Bus and Train Network (left) / Proposed East/West RBT System (right) Source- Mumbai: Shift
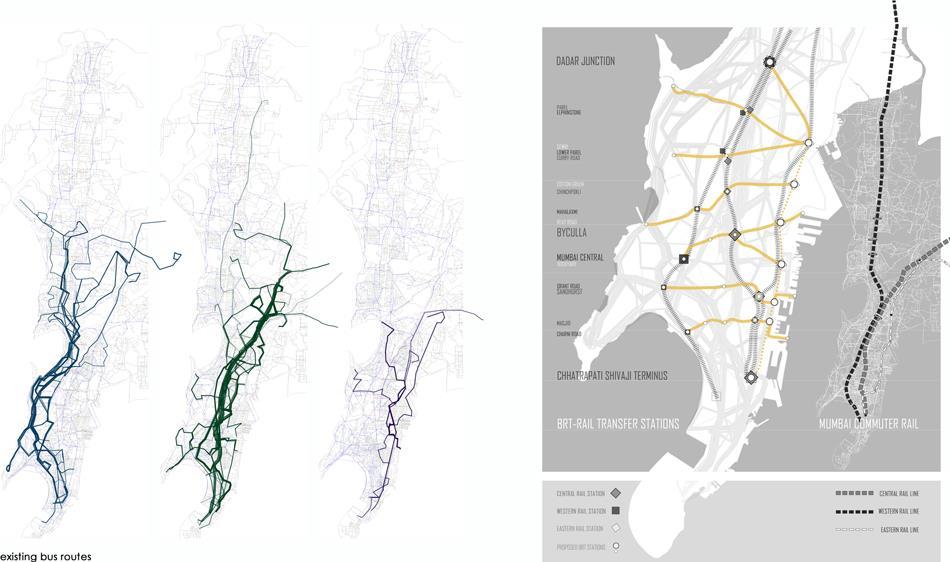

Figure 122- TDR Transfer Strategy. Source- Mumbai: Shift
The Potential of Eastern Waterfront Development-
The redevelopment of Eastern waterfront can play two vital roles-
Decongesting the city by improving its environment and opening new spaces for mobility of goods and people. Using the waterfront's central location to realign the regional axes of economics, transportation, and trade to connect the island metropolis of Mumbai to its twin city across the harbour, Navi Mumbai.
The Issues of Eastern Waterfront Development –
In the context of the Mumbai estuary, waterfront sustainability includes reclamation in the face of sea level rise, floods, and monsoons. With the demand for speculative real-estate development, there would be environmental impacts. Pollution on the Eastern coastline, as well as the devastation of marine ecosystems. Mumbai's waterfront has the potential to become a new public area. The dockland fabric and local history preservation. People living in the docklands and working in Mumbai's informal sector have a claim to social equity. Housing for the migrant population at a reasonable price. Infrastructure to link the Eastern waterfront to the rest of the city and the Navi
Mumbai across the harbour. The security and defense of the land, since Mumbai 9/11 terror attacks happened through waterways.
5.3. MUMBAI PORTLANDS AND ITS HISTORY
After the Royal Charter transferred the Port and Island to the East India Company in 1668, the Port began to develop. The Company took a variety of efforts to stimulate commerce, including the construction of a Customs house, a warehouse, and dry docks. The Company's trade monopoly was broken by an act of the British Parliament in 1813. As a result, the Port's trade increased dramatically. The East India Company was forced to leave Mumbai in 1858, and the city was placed under the direct authority of the British Crown. The current statutory independent Mumbai Port Trust was established in 1873 to handle the port's affairs.

Figure 123- Mumbai Dockyards, Source MbPT
The Suez Canal's inauguration in 1869 transformed Mumbai's marine trade. It moved the entire scenario of import and export commerce from the East coast to the West coast, and Mumbai port became India's main gateway.
The Sassoon Dock in Mumbai was the first wet dock built in India, followed by the Prince's and Victoria Docks in 1880 and 1888, respectively. However, Princess and Victoria Docks are being filled to turn the entire area into a temporary container stacking yard in conjunction with Indira Dock's "Offshore Container Terminal."
The Alexandra Dock, which was renamed Indira Dock in January 1972, was built between 1904 and 1914 and is the most modern of Mumbai's ports. A jetty was built at Pir Pau in 1923 to handle petroleum products and liquid chemicals, and a new
modern jetty capable of transporting tankers of 47,000 Displacement tonnes was commissioned in December 1996.
1668 East India Company purchased Port from Portuguese 1858 Mumbai fell under direct British Crown
1534 Portuguese captured islands of Mumbai
1813 British Parliament ended East India Company’s commercial monopoly
Figure 124- The development of Mumbai; Source MbPT
1947 India gained Independence from Great Britain
Between 1952 and 1956, a modern oil terminal with three berths was built at Jawahar Dweep, and between 1980 and 1984, a fourth oil berth capable of handling tankers up to 1,25,000 displacement tonnes was built.
The Mumbai Port is a multipurpose major port capable of handling various types of cargo such as break bulk, dry bulk, liquid bulk and container goods. However, due to the outdated nature of its facilities, out of the original three docks only the Indira Dock is currently in operation. The Merewether dry dock, along with the Princess and Victoria Docks, have been decommissioned and are being reclaimed as back yards for the Offshore Container Terminal (OCT) project under implementation. The offshore terminal project which will increase the handling capacity of the MbPT.
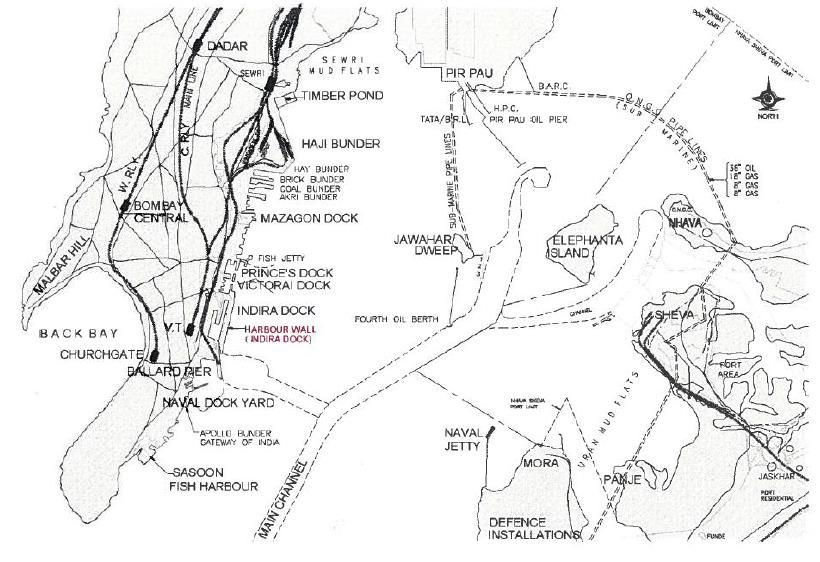
Figure 125- Mumbai Harbour Map, Source MbPT
MUMBAI PORTLANDS DEVELOPMENT
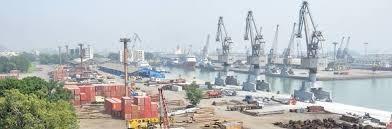
The consequent de-industrialization of the Mumbai Port has seen a general deterioration in all types of port activities. Even as the new cargo mix has shifted the focus of port operations from on-shore to offshore, the rise of the new Jawaharlal Nehru Port Trust (JNPT) across the bay, which began operations in 1987, has resulted in the diversion of almost all container cargo to the new "container port," which has a draught depth of 11.5 metres and well-established road and rail connections to the mainland.
For a long time, it has been evident that the enormous parcels of land along the Eastern Waterfront that have become superfluous for port purposes can be put to good use to meet the city's urban development objectives. (Team, 2015) The current functions of the Ports are mentioned in the flow chart below-

Figure 126- Salient features of Portland development proposal
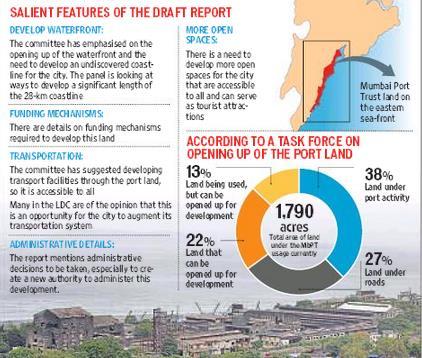
Figure 127- Portlands Land use flow chart, Source- MbPT
We need to envision a waterfront that is environmentally sustainable, climate change resilient and embraces its natural and cultural history. The Mumbai eastern waterfront will serve as a blueprint for future development in Mumbai and waterfronts around the world.
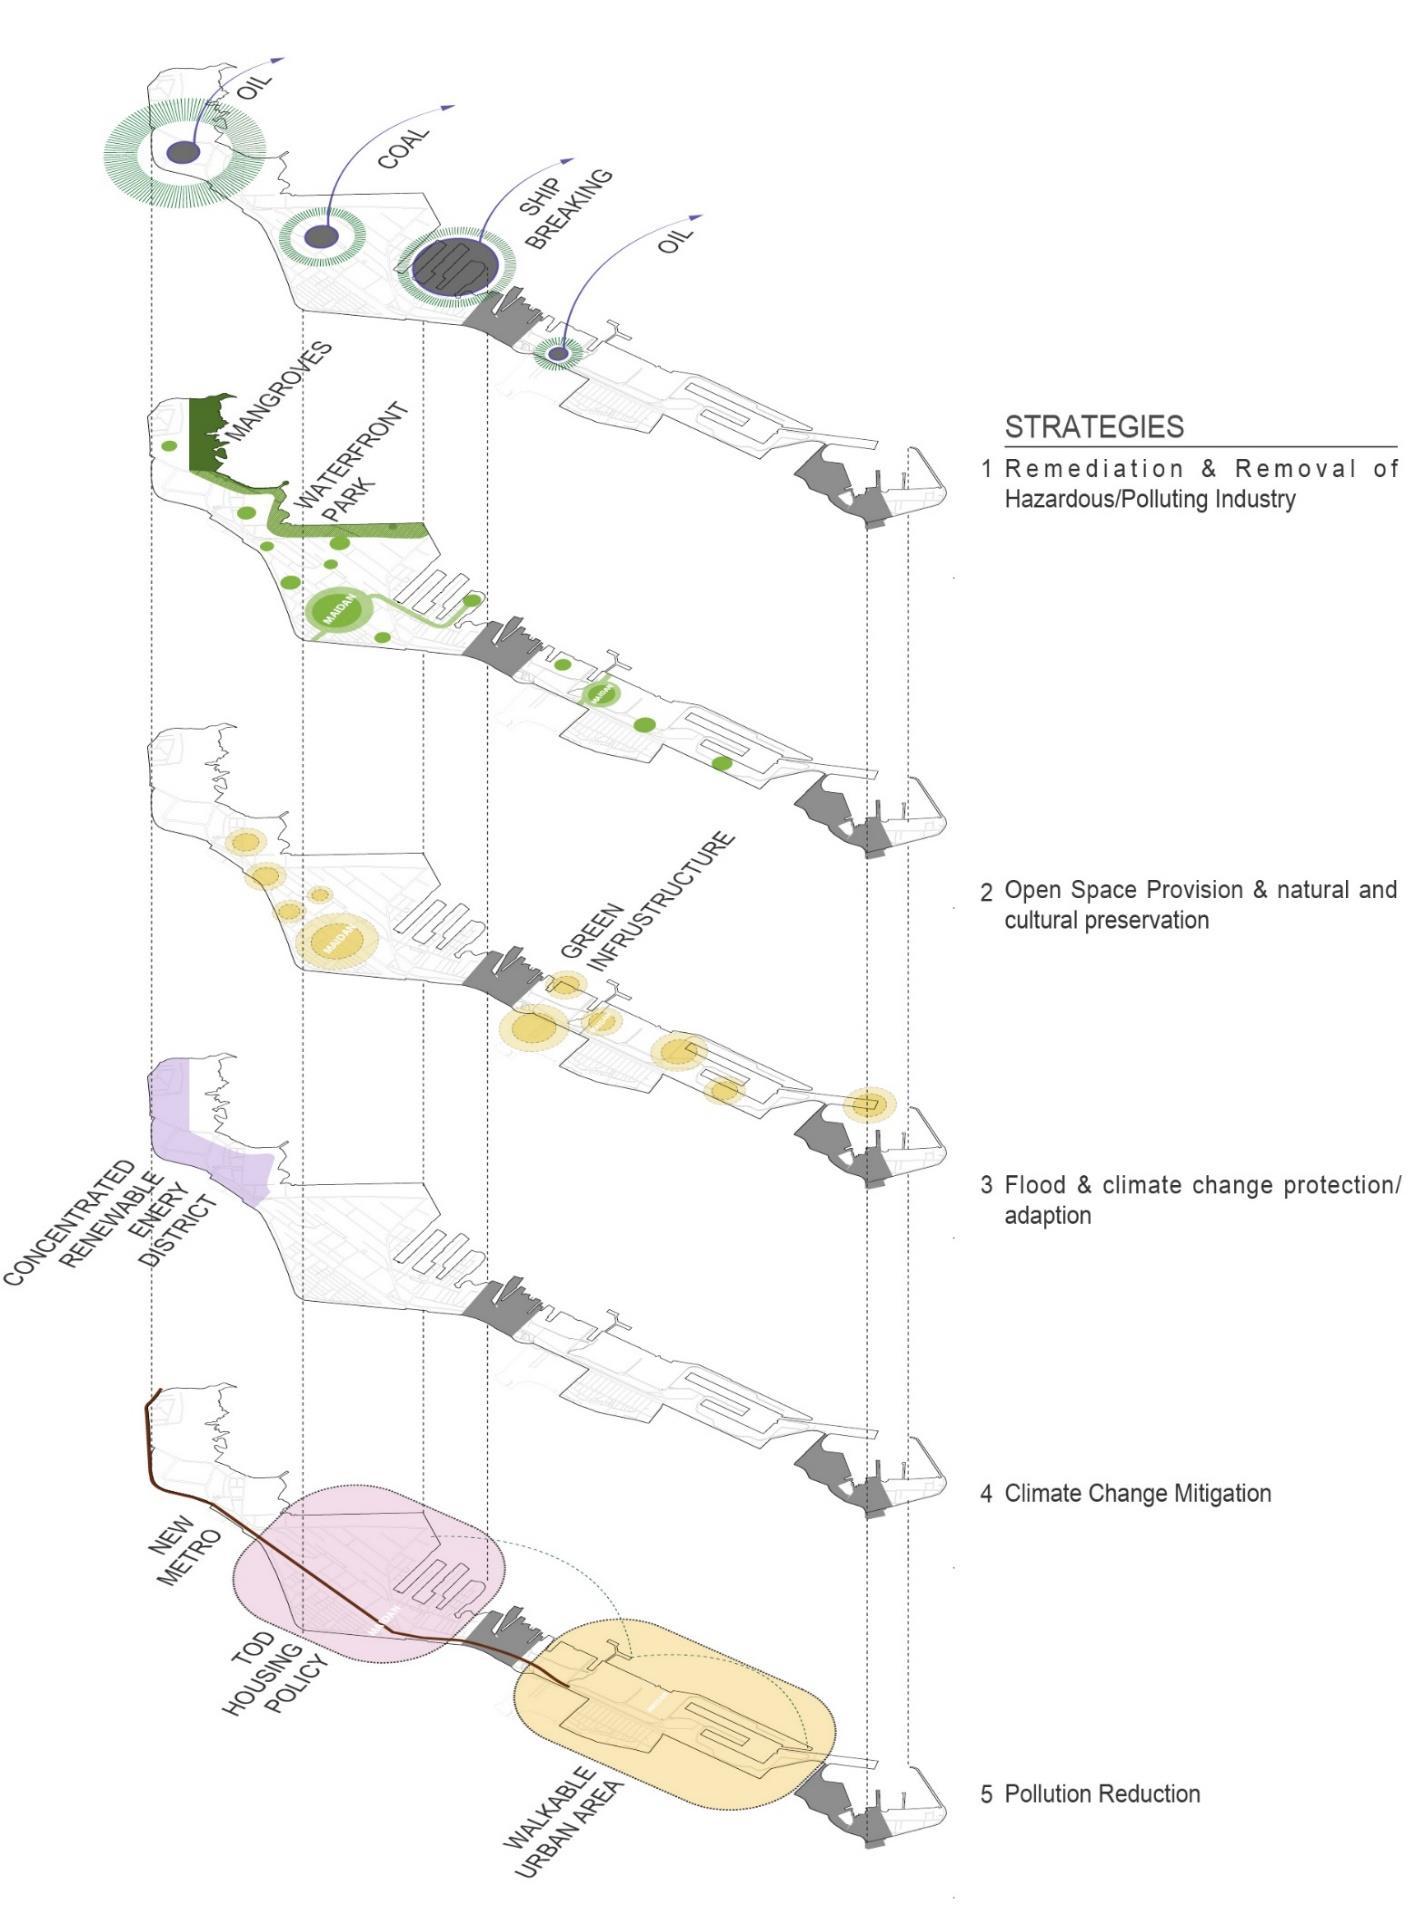
Figure 128- Environmental Framework Strategies, Source- Orange Li
5.4. MUMBAI PORT TRUST (MBPT)
Mumbai Port is located in Thane Creek on India's west coast, on the leeward side of Mumbai Island, and is one of the country's oldest British-era ports. This is a year-round natural port that is well protected from the wrath of the sea. The port connects to the Arabian Sea via a navigational channel where tidal phenomena predominate, with macro type semi-diurnal tides with a range of 5 metres. During the preindependence era, several marine facilities such as docks, jetties, and oil terminals were constructed.
The main docks- Indira, Princess, and Victoria, which were used for berthing and ships, were operating towards the Arabian sea's deep waters by harnessing the power of the tidal window. Several maritime facilities were planned as part of the master plan development after independence, including oil berths in Jawahar Dweep, chemical and POL ports at Pirpau, and the finalisation of the principal navigational channel's alignment with its deepening/widening, among others.
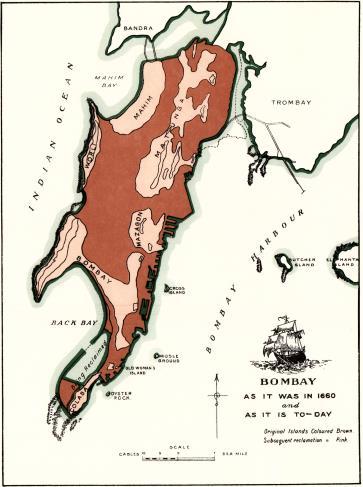
Figure 129- Mumbai Port evolution, Source- the Port of Bombay (Kamath, 2000)
The port has risen to this position as a result of its constant efforts to meet the changing needs of marine trade. Since it is a historic port, it has adapted to evolving shipping trends and cargo packaging, from break bulk to unitization and containerization. The Mumbai Port has long been India's main entry point, and it has played a critical role in the growth of the country's economy, trade, and commerce, as well as the wealth of Mumbai itself. (Smith, 1973)
Port cities of today are faced with global crisis of de-industrialization. This relocation of industrial activity outside the city which is generally due to better rail and road networks, cheaper land and labor availability, modernization and geography. The consequential industrial evacuation has led to the dereliction and redundancy in vast tracts of inner city harbour area.
The main parameters for selecting this area of Mumbai was to re-imagine the Eastern waterfront as being 'Open, connected and Green' offering the city sea connectivity and potential for development.
'Open' for new public uses including recreation, culture, tourism and community amenities.
'Connected' through multiple choices of pedestrian, cycle, metro, rail, buses, and water transit and road connectivity.
'Green' with environmentally sustainable land uses and an eco-sensitive built environment.

Figure 130- MbPT area development over the years, Source- Hindustan times
5.5. LANDMARKS ON EASTERN WATERFRONT
The land of the Mumbai Port Trust encompasses over 10% of Mumbai Island and is strategically located along the city's eastern waterfront. Within the SPA area, MbPT's estate data had previously been separated into 13 units. The MbPT SPA covers 966.30 hectares. This covers 120 hectares of land beneath water bodies in the Haji Bunder area. (Mumbai Port Trust, 2018)
a) Unit 1 (Sewri Wadala Estate):
Oil businesses, with their oil infrastructure and tanks, occupy the majority of this region being in proximity to oil refineries and a terminal at Mahul. Swamps and Saltpans cover the land to the north east of Wadala Estate.
b) Unit 2 (Sewri Estate) and Unit 6 (Reay Road)):
According to MbPT's land ownership, the territory is divided into various portions. Godowns, industries, and commercial establishments make up the majority of the region. In this area, there are also large timber operations. Units 2 and 6 have excellent development potential because they are adjacent to the main spine road.
c) Unit 3 (Cotton depot), Unit 4 (Coal & Grain depot), and Unit 5 (MSR estate):
Warehouses and godowns, land leased to the Air Force Defense Region and undeveloped ground, make up the area. This area also houses the College of Advanced Maritime Studies and Research.
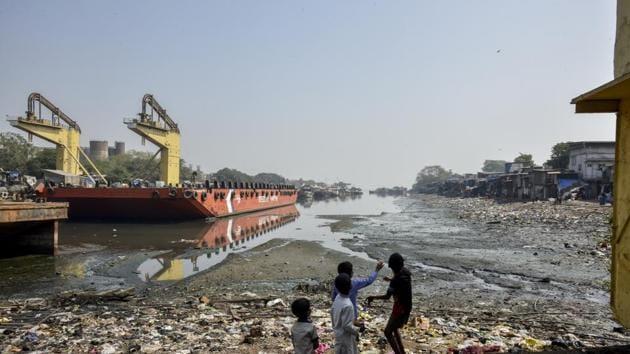
d) Unit 7 (Darukhana) and Unit - 13 (Brick, Lakdi, Coal & Tank bunders):
The profile with three fingers- Bunders were erected in the nineteenth century to facilitate marine commerce in wood and coal from neighbouring states, but they are no longer useful in today's economy. Large portions of the bunders have been encroached upon, and parts of them have been replaced with wholesale iron and steel storage.
e) Unit 8 (Mazgaon Darukhana) and Unit 9 (Elphinstone estate):
Mazgaon dock is the primary feature of this region. The land under Mazgaon Dock ltd, which is not controlled by MbPT, is not covered by the SPA. BPCL Oil depots, MbPT warehouses, jetties, and other facilities occupy a major section of the region. At Bhaucha Dhakka and Fish Jetty, respectively, passenger boat services and fishing are provided.
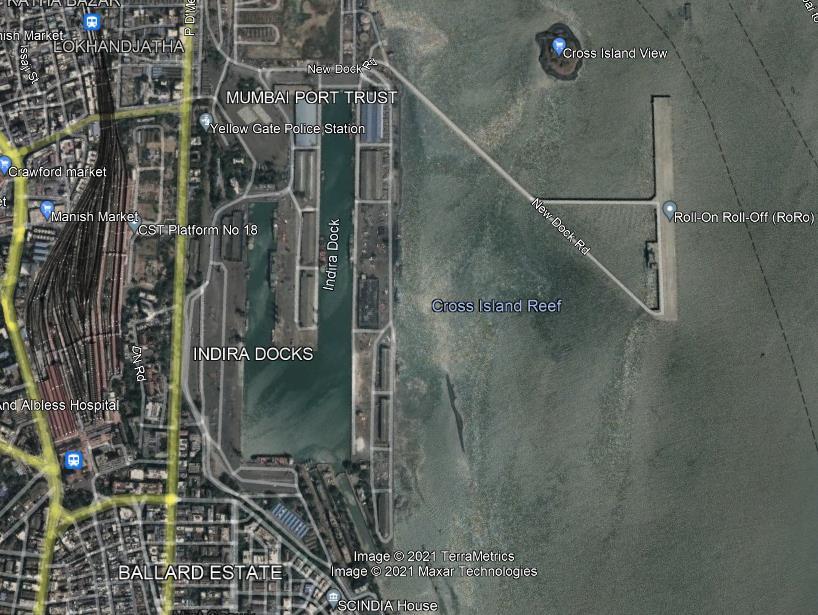
f) Unit 9 (Prince’s Dock, Victoria and Indira Dock): This is where the Mumbai Port's core operations take place. The construction of projects such as the Ro Pax, Domestic Cruise Terminal, and planned Marina are transforming the Prince's Dock. The primary truck movements converge and disperse in this region, especially from the port's Orange Gate. In this location, traffic congestion is frequent.
g) Unit 10 (Masjid Bunder – Elphinstone Estate): The region is covered by a town planning scheme that has been approved. Due to commercial activity, narrow and encroached roadways, it is the most crowded region. MbPT leases out commercial uses and warehouses on a short-term basis in this region. The majority of the estate's walkways have been encroached upon by slums.
h) Unit 11 (Ballard Estate): This is MbPT's most planned district, including ancient buildings with ornate facades and arcades built during the British rule. This is a business district that houses all of the important corporate offices, including the MbPT headquarters, the new customs office, and clearing and forwarding agents' and shipping firms' offices.
i) Unit 12 (Sassoon Docks): The Sassoon Dock was the first dock to be built in 1875. It is now Mumbai's major fish pier, complete with a renowned fish market. The dock is where the fish is sent to other nations. In the year 1995, the New Sassoon dock was built. The Maharashtra government, in collaboration with MbPT, has completed a refurbishing project at Sassoon Dock.
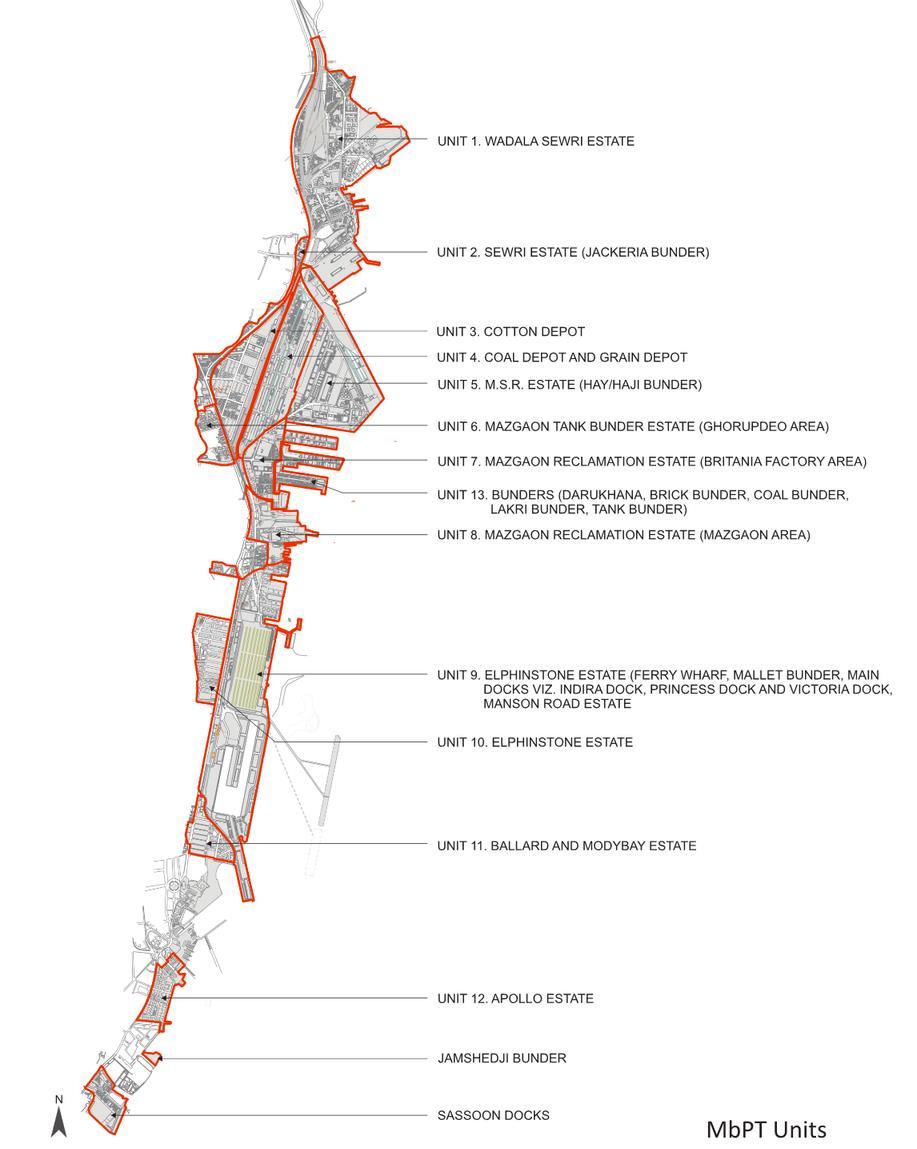
Figure 131-Land use map of Eastern Waterfront area, Source- MbPT
5.6. SITE DATA
Mumbai city lies to the West, the port is roughly 8 km wide at this point. The Princess Dock, with Indira and Victoria’s Dock, are located on the port’s East side. These two piers are next to the existing Indira port, and the terminal is being built on the opposite side of the site. Two ports, a container park, and a mere weather dry dock are all part of the complex. Prince's dock has ten berths, while Victoria dock has fourteen. The water areas of Prince's and Victoria docks are 10.12 and 12.14 hectares respectively.


SITE OPTION 2: VICTORIA DOCK

SITE OPTION 3: INDIRA DOCK
SITE OPTION 4: DARUKHANA
PROS • Future development • Diverse functions • Well connected by public transport • Currently redundant

PROS • Upcoming infrastructures • Transport linkages on land and sea • Rich historic value
PROS • Historically significant • Occupationally important • Rich cultural surrounding
PROS • Future development • Diverse functions • Well connected by public transport • Existing industries and godowns having rich maritime history CONS • Lack of infrastructure • Traffic issues • Under-developed surroundings • Prone to oil spills
CONS • Under-developed surroundings • Lack of security • Limited user group
CONS • Not accessible to everyone • Under-utilised areas • Prone to sea erosion
CONS • Inaccessibility • Under-utilised spaces • Ship breaking activities • Chemical wasted from industries • Crimes within the site
SITE SELECTION
Prince's Dock, between Fisherman's Pier to the north and Victoria's Dock to the south in Mumbai Port, was built in 1880 for steam ships.
MAZGAON DOCKS
BHAUCHA DHAKKA
DOMESTIC CRUISE TERMINAL PRINCESS DOCK
VICTORIA DOCK
RO-RO PAX TERMINAL
OFF SHORE CONTAINER TERMINAL

INDIRA DOCK
Figure 134- Map showing the selected Site, Source- MbPT, Graphic-Author
PRINCESS DOCK
Princess Dock was filled with dredged material from 2008 to 2011 in order to build a container port. It is an open space with various abandoned buildings, notably the M Shed which is positioned in front of the sea. Three to four miles east of this pier, the Elephanta Islands can be spotted. It was built as the port trust's premier dock, having a maximum draught of 7 metres. After World War II, the process of building ships changed dramatically, with riveting being replaced by welding. As most vessels cannot be handled in a 7m draught, Princess Dock is no longer suitable for cargo ships.
The MbPT has about 400 hectares of undeveloped land within 1 km of Princes Dock. This is significant infrastructure would be perfect for use as a modern berthing and ship repair facility, offering a valuable service to maritime and coastal boats while also producing employment.
VICTORIA DOCK
Victoria Dock opened in 1890, was the primary dock for handling freight vessels until 1914, when Alexandra Dock (now Indira Dock) was completed. The dock's restricted draught of 7m makes it unsuitable for contemporary cargo ships. The initiative was taken to fill these docks with sand to build a stack yard for the Containers of the OCT project. It is a historically significant dock that should be maintained and the infrastructure is well-suited to become a Marina that can be transformed quickly.
Sailing is a sport in which India participates and has excelled at the Asian Games, the Commonwealth Games, and the Olympics. The Mumbai Harbour is well-known as an ideal training environment for the young ambitious sailors. The 5m draught that may be achieved by desilting the basin at Victoria Dock which will be adequate for yachts in Mumbai. (Mumbai, 2014)
Site Selection Matrix
Factors
Site 1 Princess Dock Site 2 Victoria Dock
Site 3 Indira Dock
Site 4 Darukhana
Natural environment
Climate risks Limited Limited Limited Maximum Ecology system Limited Limited Limited Limited Erosion Maximum Maximum, Oil spills Maximum Maximum, Industrial wastes
Physical elements
NonPhysical elements
Design Programme
Area - -- Footfall Limited Limited Maximum Maximum Functions Port activities, Recreational activities Dry dock, port activities Port activities, MbPT head office Industries, Godowns, Workshops Accessibility Purple gate, Good accessibility New dock road, Good accessibility Yellow gate, Good accessibility Reay Road, Limited Infrastructure M-shed Berthing space Commercial Industries
Surroundings Mazgaon Dock, Domestic Cruise Terminal, Fishing Wharf (Bhaucha Dhakka) Ro-Ro Pax terminal, Offshore Container Terminal, Cross Island View International Cruise Terminal, Ballard estate Mazgaon Dock, Hay Bunder
Identity Deteriorating Deteriorating Strong Over-used Communal connect Limited Limited Limited Nil Development scope Maximum Maximum Moderate Moderate
Built
Marina Terminal, Yacht club, Water sports Un-built Ecological interactive areas, sky decks Marina Terminal, Yacht club
Water recreational spaces International Cruise Terminal
Interactive water pavilion Maritime Museum, Residential buildings Interactive water pavilion
Figure 135- Site selection matrix, Source- Author
5.7. Draft Mumbai Metropolitan Regional Plan
The Development plan according to Greater Mumbai Draft Development Plan- 2034 shows that the site is preserved for Port allied activities.
The Port Allied Activities Land Use is sub categories as –
a. Port Industry: Petroleum godowns, petroleum processing plants, tank farms, fueling stations, repair workshops, fabrication workshops, public garages, and all service industries are the major land uses in this category. The zone will also allow for the establishment of industry offices. Service and incubator operations will also be accommodated in the zone.
b. Fish Industry and tourism: This sub-zone is for the Sassoon Dock area, where fishing is the major activity. Simultaneously, this region will be developed as a fish tourism attraction. In this sub-zone, complementary service industries, cultural, and recreational activities are authorised.
c. Port Storage: This sub-zone is for all port activities outside of the customs bound area, which largely comprises port-related commodities storage and warehousing. All auxiliary operations authorised in the port operating zone are likewise permitted in this zone.
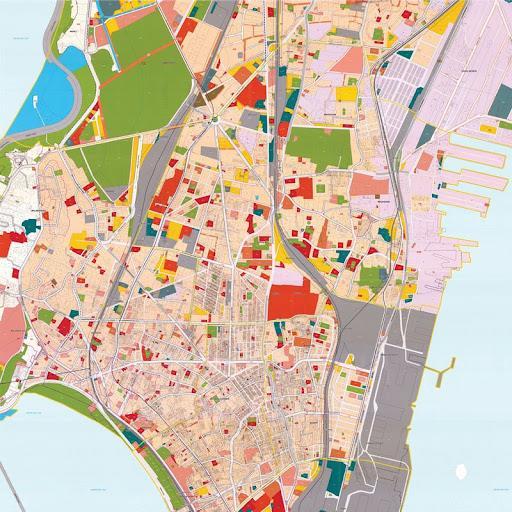
Figure 136- DCPR Map according to 2034

Figure 137- Bhaucha Dhakka at sunset, Source- Kaval Patel
6. SITE ANALYSIS
6.1 Site Brief 6.2 Site Development Control & Regulations 6.3 Site Drawings 6.4 Site Surrounding Analysis 6.5 Climatology Study 6.6 Accessibility 6.7 Architectural Vocabulary 6.8 Site Photos 6.9 SWOT Analysis


6. Site Analysis
The site analysis chapter will study all the aspects of the selected site. The study of connectivity of land and from water, transportation networks, land use and zoning will be carried out. The climatic study and environmental analysis and site’s topography will also be illustrated.
6.1. SITE BRIEF
The site for the proposed project is located on the Eastern waterfront of MumbaiPrincess Dock and Victoria Docks. It is located next to the existing Domestic Cruise Terminal and Ferry Wharf (Bhaucha Dhaka), having good connectivity to the central railway route. It is easily accessible by road and waterways.
Mumbai's strategic position is responsible for its status as a global city. Mumbai is recognized as a significant junction for the western coast of India on some of the most important marine trading routes. Throughout the 18th, 19th, and early 20th centuries, the availability of a good natural harbour was the stimulus for extensive land reclamations along the Eastern Waterfront in order to develop the port and expand port-related businesses. (Committee, 2014)
For a myriad of purposes, industrial manufacturing has ceased to be a viable business in Mumbai during the last several decades. As a result of the deindustrialization, the Mumbai Port has seen a general decline in all sorts of port activities.
The site demands for the following functions-
Marina development Good connectivity with the existing Terminal Berthing areas for yachts Water sports as leisure activties Public decks overlooking the sea
The proposed site area on Princess Docks is 15.4 ha, further classified asLand side area: 7.8 ha Sea side area: 6.7 ha Total Berths: 425

6.2 SITE DEVELOPMENT CONTROL & REGULATIONS
Currently, the MbPT region has been planned for under MCGM's Development Plan. However, a substantial portion of the jurisdiction is within the coastal regulation zone, which has different development extreme rules than the rest of the jurisdiction, according to the CZMP.
Price's Dock is located in CRZ - II (Urban), according to the Draft Coastal Regulation Zone (CRZ) Map for Greater Mumbai. The Princess Dock area is situated between the High Tide Line (hence referred to as the HTL) and 500-200 metres along the
coastline on the landward side.
The MbPT Planning Area was covered by the Revised Modified Draft Development Plan 2034, which was presented to the State Government. The Sanctioned Development Plan 2034 and Development Control and Promotion Regulations 2034, on the other hand, do not apply to CRZ areas inside the Planning Area, but they do apply to non-CRZ regions.
The majority of the Planning Area was divided into two zones in the updated development plan:
• Port’s Operational Zone (POZ) • Port’s Water Front Development Zone (PWFDZ)
The POZ is intended for port-related operations as well as those that are permitted in the Industrial Zone. The PWFDZ is set aside for waterfront development offices, restaurants, hotels, and other tourism-related enterprises.
1. FSI: The allowable FSI in the Island city is 1.33 in the Residential and Commercial zones, and 1.00 in the Industrial zone. In addition to permitted FSI, provisions have been established for Fungible FSI and Premium FSI. On net plot area, the FSI is allowed.
2. Provision of recreational open space: In any layout or sub division/ amalgamation for the development of individual plots with single building in a residential and commercial zone, ROS should be given in the percentage of 15 to 25% of the project's land area.
6.3 SITE DRAWINGS

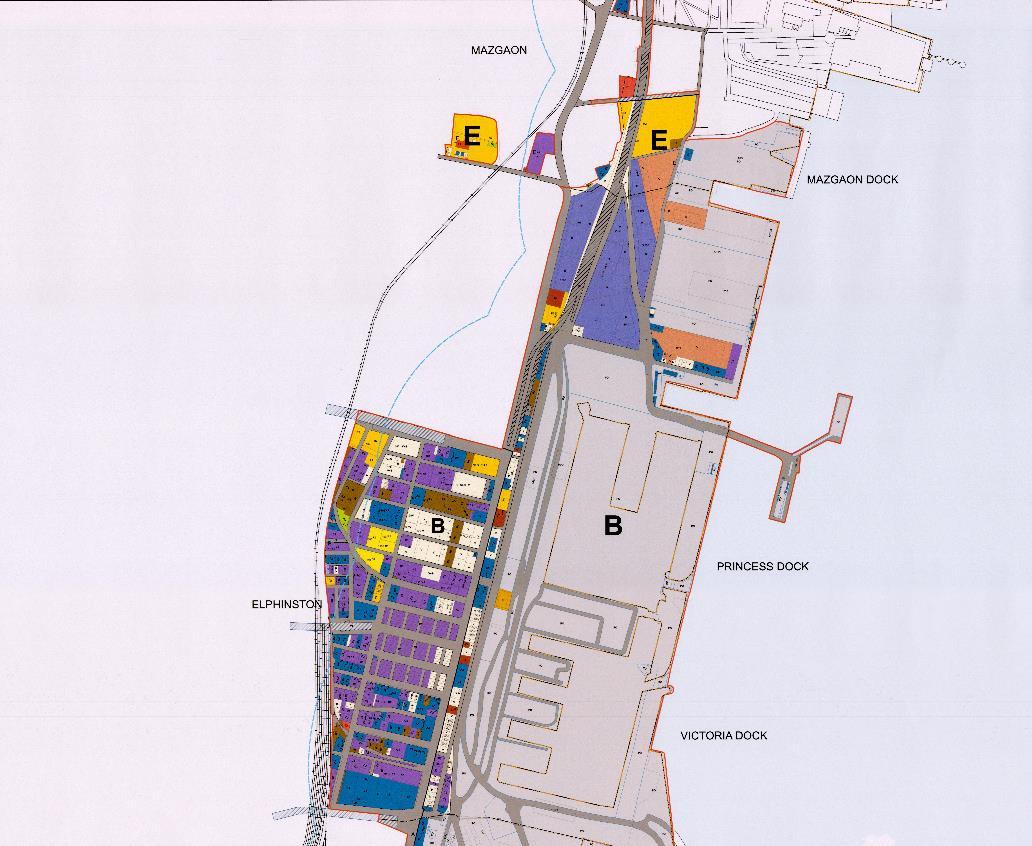
Figure 139- Development Plan of Princess and Victoria Docks, Source- DP Remarks


SITE – YEAR 2000

SITE – YEAR 2010 SITE – YEAR 2020
The site has been considered without its reclaimed portion
SITE SELECTION CRITERIA

Figure 141- Flow chart of Site selection criteria, Source- Author
Design Parameters
Parameters to be considered while preparing the Princess Docks Area Development Plan Public Transport integration Facilities / Amenities for the people Understanding people and their day to day needs Integration of public spaces with commercial activities Environmental sustainability/CRZ
Considerations Safety and Security Barrier free access Street furniture and signage Figure 142- Proposed land use zones, MbPT

6.4 SITE SURROUNDING ANALYSIS
The site is surrounded by various landmarks and zones, as specified in the previous chapter.
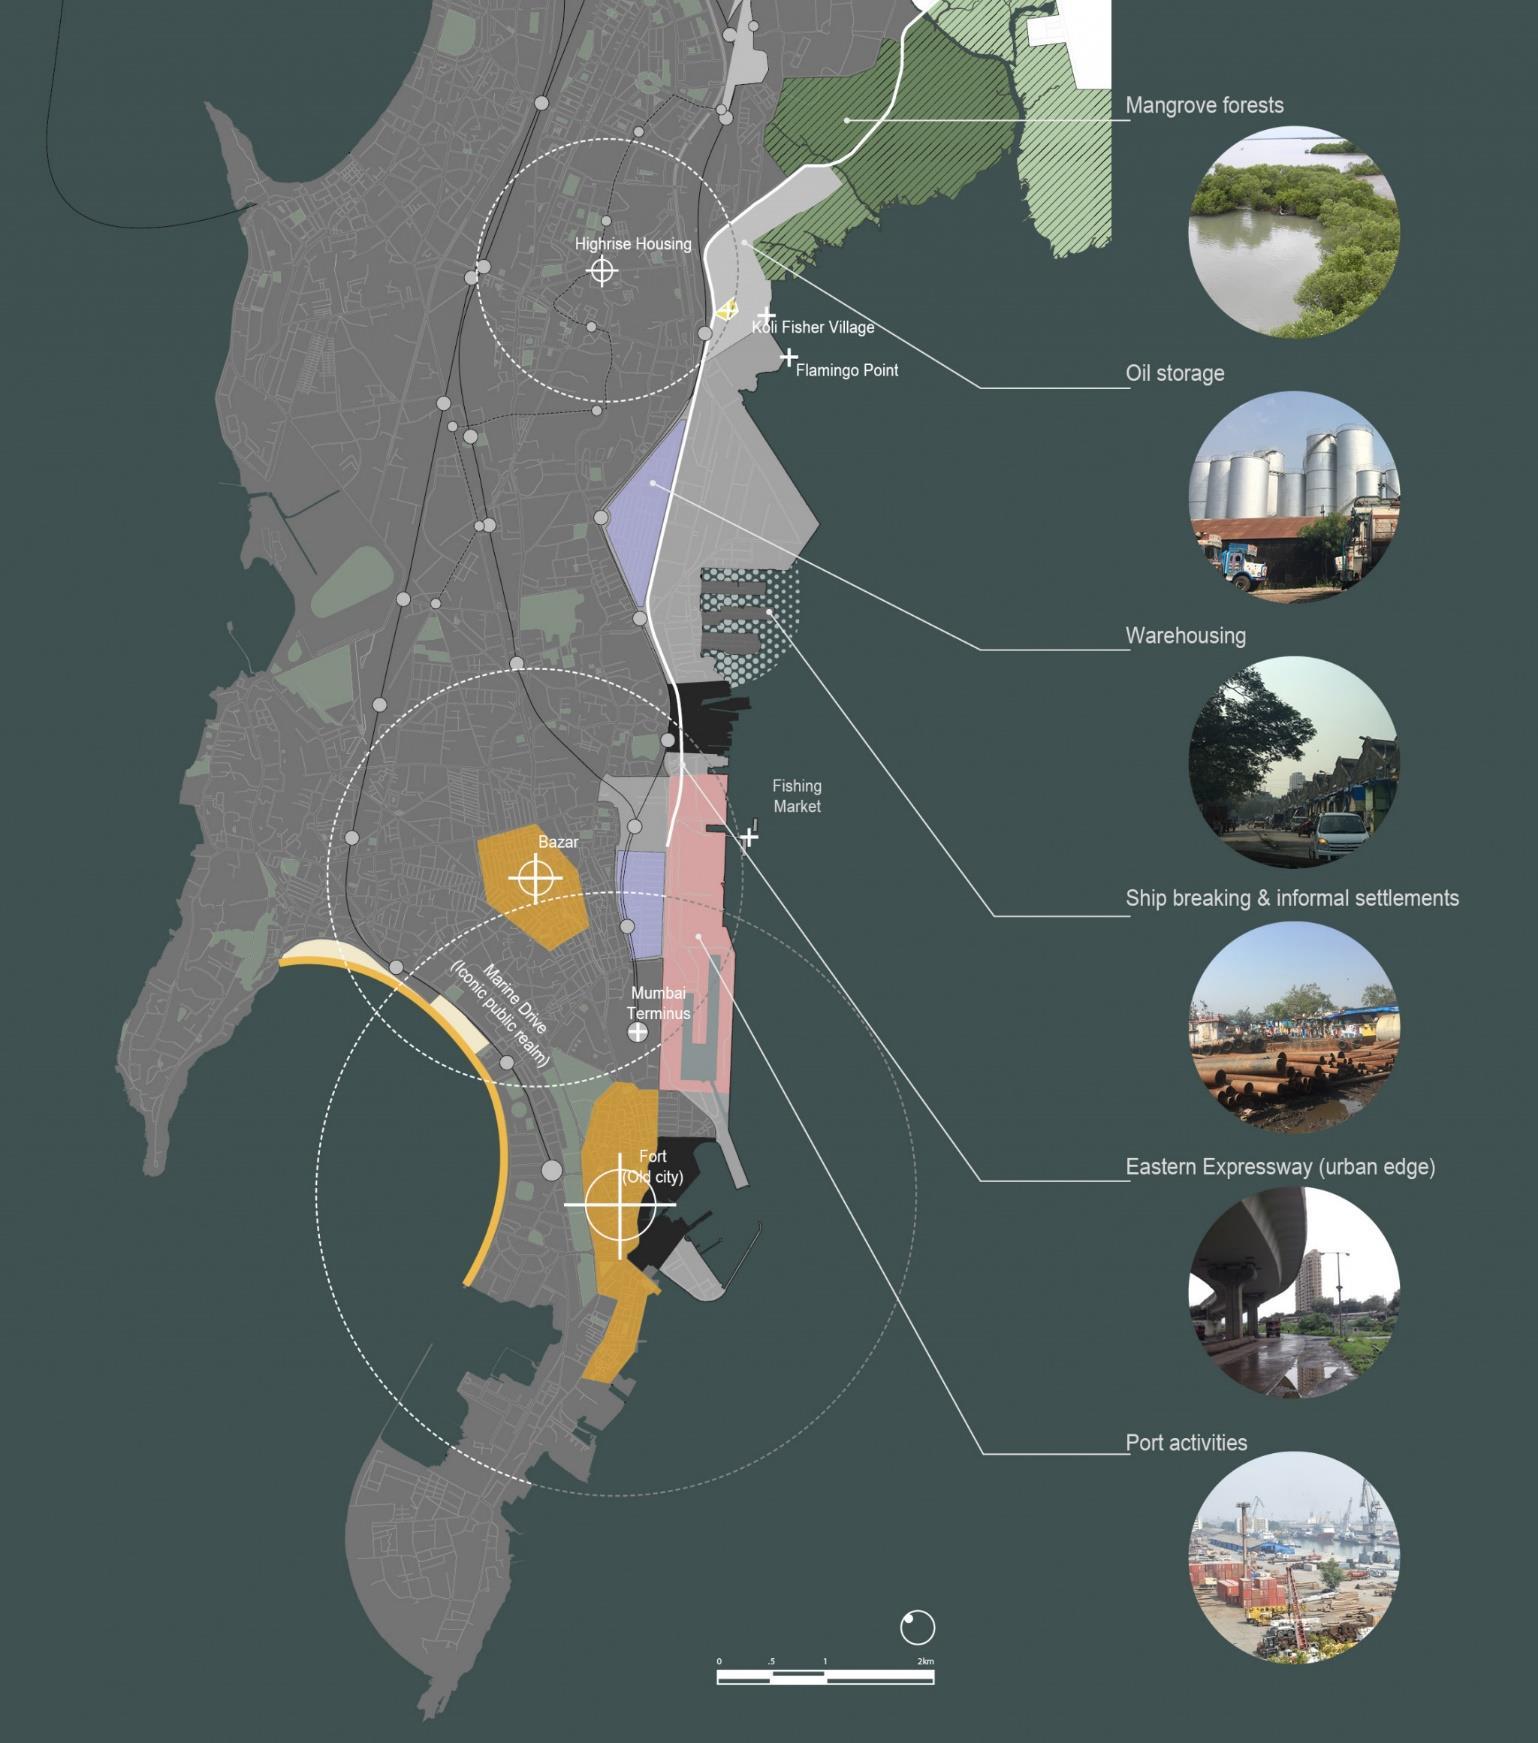
Figure 143-Mumbai and the various Landmarks on the Easternwaterfront
6.5 CLIMATOLOGY STUDY
LOCATION- MUMBAI PORT, MUMBAI
LATITUDE- 18.9483° N
LONGITUDE- 72.8442° E
ELEVATION- 6 Meters (19.68 Feet)
Rainfall
The region's climate is affected by two yearly monsoon seasons: the south–west monsoon (June to September) and the north–east monsoon (October to December) (November to March). From October through May, the weather is pleasant. The region receives the most of its rainfall during the south west monsoon, with an average monthly rainfall of 450 mm. Over the last 20 years, the average annual rainfall has been around 2000 mm. From November through March, there is very little rain.
Relative Humidity & Temperature
The relative humidity is moderate to high throughout the year, ranging from 60 to 90 percent during the summer months to 60 to 70 percent from November to February. The average daily temperature is 25 to 33°C in the summer and 20 to 25°C in the winter. March through June are the hottest months.
Wind
The Seasonal variations of wind direction and speed within Mumbai harbour area are as given in the following table.
MONTH
March to May PREDOMINANT DIRECTION WIND SPEED (BEAUFORT SCALE)
From NW to N 4 to 6 (Max.10)
June to September From SW to NW 6 to 8 (Max.10)
October to November From NW to NE 2 to 6 (Max.8)
December to February From ENW to NW 2 to 6 (Max.8)
Figure 144- Wind variation table
During the day, there are brief times when the wind speed surpasses the prevailing wind speed by a significant amount, resulting in gusts of wind from opposite directions. The strongest wind comes from the northwest in September, at a speed of 54 km/hr.
Cyclones
The west – coast of India is subjected to occasional severe cyclonic storms. In May/June, or the post-monsoon months of October and November, the area is hit by high winds and widespread rain. June and September are the months when the storms are most common. The surge can be considerable in high winds, although wave heights are significantly decreased owing to channel water depth. The latest severe cyclonic storm with winds above 48 knots occurred in 1982. Figure 145- Wind Rose diagram

Special weather phenomena
Thunderstorms are most common in May and June, as well as late September and early November. Rainstorms are most common during the monsoon season, which ranges from June to September. During these rainstorms, the wind speed may reach 6 on the Beaufort scale. Rainstorms can last for up to 15 days on average every year. Dust storms and fog are very unusual phenomena.
Seabed Depth
The Princess Dock was filled in 2015 to make way for a new container terminal in Mumbai Port. That meant reclaiming its interior basin, which had a depth of − 5,175 m C.D. at the time.
Tides
The tide levels are shown in the table below. The water level in the Jawahar Dweep fluctuates between MLWS and MHWS throughout the majority of the year, with a 3.66m range of fluctuation.
TIDE
High-High Water Level HHW Mean High Water Spring MHWS Mean High Water Neap MHWN Mean Sea Level MSL Mean Low Water Neap MLWN Mean Low Water Spring MLWS Low-Low Water Level LLW
TIDE LEVEL (in meters)
+ 5.38 +4.42 +3.30 +2.50 +1.85 +0.76 -0.44
Figure 146- Table showing Tide levels The above tide levels refer to Chart datum which is taken as 0.0. In many studies related to Mumbai Harbor reveal:
i) All high tides exceed + 2.7m ii) About 95% of all higher high tides exceed + 3.2 m. iii) About 95% of all lower high tides would be greater than + 2.85 m.
Currents
The tidal currents are primarily responsible for the currents in the harbour waters. Normally, currents in the Mumbai harbour region during ebb and flood flows are in the range of 2 to 3 knots, with a high of 4 knots predicted in the ebb during monsoon spring tide. The flood and ebb tidal currents typically flow parallel to the navigational channel, as indicated in the diagrams below. Figure 147- Map showing sea currents affecting Mumbai

Waves
The Mumbai port is sheltered, thus there is no substantial wave climate in the region. Under typical conditions, the wave height reaches a maximum of 1.5 m, with a wave period of 6 to 10 seconds. The National Institute of Oceanography (NIO) in Goa has compiled and released a "wave atlas" of wave data for India's entire coastline.
6.6 ACCESSIBILITY
Mumbai is India's main western port due to the amenities offered by the city's harbour. Although other large ports have sprouted up along India's west coast— Kandla in Gujarat to the north, Marmagao in Goa to the south, and Kochi (Cochin) in Kerala to the south—Mumbai continues to handle a considerable percentage of the country's marine commerce. The Western Railway Line, Central Railway Line, and Harbour Line connect it to the rest of the country. Eastern Freeway, Eastern Express Highway, Sion Panvel Express Highway, Western Expressway, and Santacruz –Chembur Link Road are the current highways in terms of road connectivity. The following are the important roads that are now in use: Bombay Port Trust Road, P D’Mello Road SVP Road.
Figure 148- Map showing City linkages


Figure 149- Mapping of the Eastern waterfront area
6.7 ARCHITECTURAL VOCABULARY
The constructed environment in the Planning Area differs greatly from one location to the next.
• The Sassoon Dock neighbourhood features ancient and decrepit godowns, small streets, and dense construction, whereas the Ballard Estate area showcases beautiful Victorian architecture with towering buildings, squares, and water fountains, among other things. • Terminals, godowns, port offices, and cargo transit areas make up the port area. • The Elphinstone Estate features designed roadways thanks to Town Planning initiatives. However, the dense business activity and slums that line the roadways have caused overpopulation and traffic congestion in the region. • Cotton Green and Sewri, which were previously prospering owing to cargo transportation, now have ancient and decrepit godowns that have been empty for decades. • There are no tall constructions in the Planning Area. The majority of the buildings are single-story warehouses, followed by four-story walk-up flats for residential and commercial use. • According to the ELU survey, pucca structures account for roughly 25.31 percent of buildings, semi-kutcha structures for 64.75 percent, and kutcha structures for the remaining buildings.
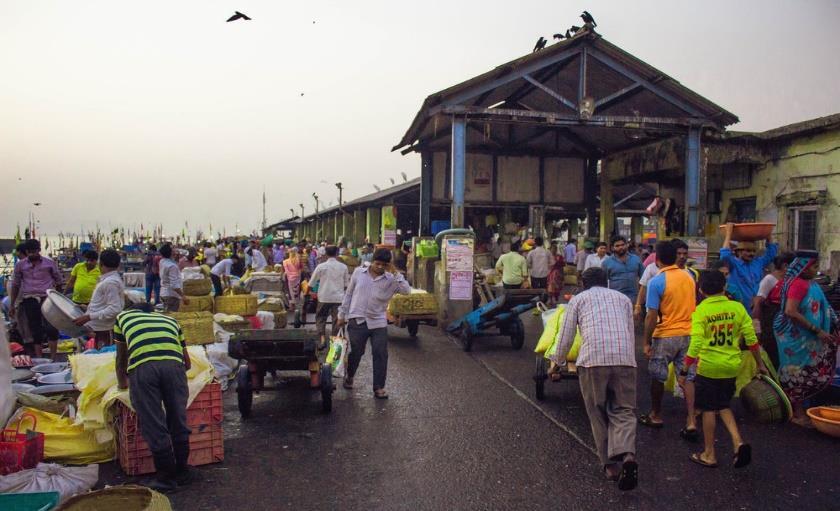
Figure 151- Elphinstone Estate, Horniman Circle Figure 150- Sasson Docks, Wet Dock, Colaba

Marina development will create interactions between tourists and locals which could be formed by a space that accommodates visually within the city.
PORT- The port is a very busy place. There are not just passengers arriving but there are also people waiting to board a ship. In addition to the footfall of people, there is also the hauling and offloading of cargo that needs to be done since cargo ships also form a major component in ports.
A port offers the following facilities:
Loading and unloading equipment for large cargo ships. Sufficient depth of water for the larger liners and sea going vessels. Connection to rail and road networks to transport cargo. Specialists in the field of container storage and customs facilities. A convenient stop for commercial shipping with repairs and refueling available.
HARBOR- A harbor is a body of water where ships, boats and barges can seek shelter from stormy weather or stored for future use. Ports are usually located in harbors and it is a facility for loading and unloading of vessels.
A harbor offers the following:
A place of safety for ships and other vessels. Jetties and mooring places. Recreational facilities for owners of yachts and moored boats. A harbor may include a port if it is large enough to house both harbor and port.
MARINA- The word Marina is used for inland wharves on rivers and canals that are used exclusively by non-industrial pleasure crafts such as canal narrow boats. Marina terminal is used only for people not for goods. Currently, many countries use marina terminal as entertainment place and landmarks. It is a dock or basin with moorings and supplies for yachts and small boats. A marina differs from a port, as it does not handle large passenger ships or cargo from freighters.
DOCK- Docks are enclosed areas for berthing the ships to keep them afloat at a uniform level to facilitate loading and unloading cargo. A dock is a marine structure for berthing of vessels for loading and unloading cargo and passengers. Docks are necessary for discharging of the cargo as ships require a number of days for discharging cargo, during which period they need a uniform water level. If ship is subjected to a vertical movement by the tides, great inconvenience will be felt in lifting the cargo from the ship and special arrangement will be needed for lifting the cargo.
Classification of Docks: Docks can be classified into following two categories: Wet docks & Dry docks.
Wet docks: Docks required for berthing of ships or vessels to facilitate the loading and unloading of passengers and cargo are called wet docks. These are also known as harbor docks. Dry docks: The docks used for repairs of ships are known as dry docks.
6.8 SITE PHOTOS
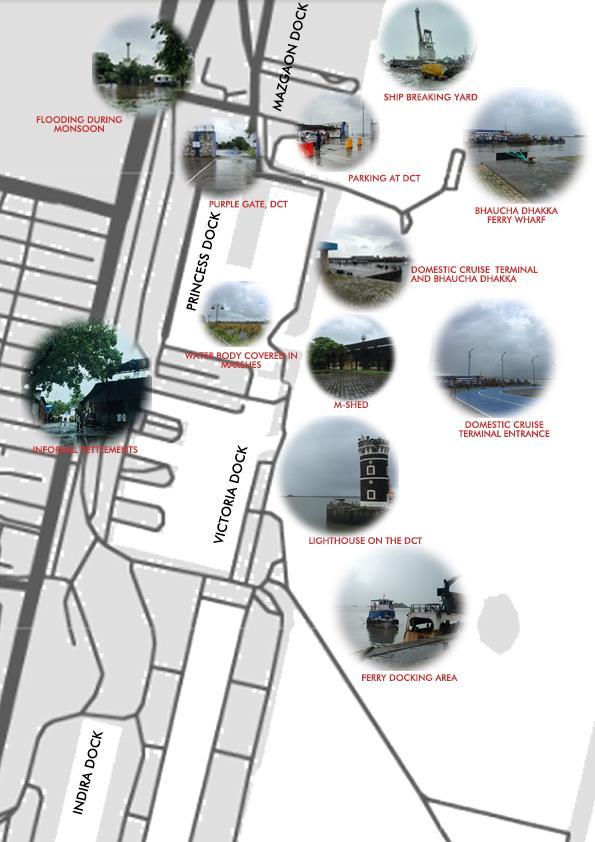
Figure 155- Site photographs taken by Author
6.9 SWOT ANALYSIS
S.W.O.T. analysis is a strategic planning approach for identifying project planning's Strengths, Weaknesses, Opportunities, and Threats. Its purpose is to define the project's goals and identify the internal and external elements that will help or hinder the achievement of those goals.
Strength Weakness Opportunities Threats
a. The site has historical ports and maritime history of the locality b. In close proximity to the RO-PAX
Terminal,
Domestic Cruise
Terminal (DCT) and ICT that guarantee the presence of people on the site c. Good connectivity by
Rail, Road and
Waterways d. The site is situated on eastern side which has lesser risk of flooding, being a low lying area a. High tide range that can affect the basin use from boats b. Proximity to old industrial port areas c. Application of international and national regulations that limit the tourist development along the shore a. Proximity to the tourist centre of the city, the Fort area b. Availability of numerous tourist resources along the shore and inside the city c. Lack of port structures for leisure boats along the shore d. Presence of leisure boats mooring in Mumbai e. Water commute for the people a. Gradual abandon and decommissioning of the industrial port b. Slums and encroached settlements in the vicinity. c. Climate changeMumbai falls on the coastline and is intersected by Arabian Sea.
SITE JUSTIFICATION
The piers at the water's edge are man-made and now unused. Converting it to a yacht harbour will allow for the most efficient use of water while preserving the natural coatline, resulting in less environmental harm. In comparison to Mumbai's west coast, the east coast is protected from high winds and currents, and it is not accessible to the general public. It would be possible to develop this surplus MbPT land in a cost-effective manner. The tree piers on the site are ideally suited for recreational uses since they absorb water between them, minimising the requirement for reclamation to build a marina harbour or quays. The existing site is prime land that is only used for marginal activities like ship breaking and recycling. The site would facilitate East-West connection between the water's edge and inland regions.
SITE HURDLES
The surrounding bunders have encroached into territories where a significant number of migrant labourers live in slums, posing a danger to the planned projects. • Illegal shipbreaking and storage of steel plates, as well as wood from chopped ships, persists. • Since the area is bordered by sea and land, security and defense remain top priorities. • Rising sea levels and oil leaks from ships would be dangerous to ships and would require special attention.
Approach for the redevelopment
The highlights of the Planning for the redevelopment area are as follows: • Focus on development of this area into Sea Transport & Tourism Hub
• Mixed Land use with a robust street network
• Plans for efficient mobility
• Makes accessible and active waterfront development
• Introduces landscape elements
• Reflects on cultural amenities and conserves heritage sites to retain their historic significance
• Develops infrastructure and social amenities
• Builds diverse districts
• Introduces standards for planned, cohesive and harmonious development
• Creates a memorable skyline and image of the city
• Supports sustainable development

7. DESIGN PROGRAMME
7.1 Elements of the programme 7.2 Relationship between Research and Design programme 7.3 Area Statement 7.4 Conclusion
7.1 ELEMENTS OF THE PROGRAMME
The elements for the design programme shall be oriented towards the following spaces-
1. Public Spaces, Boardwalks and Promenades
To increase social interaction at the waterfront and provide viewing decks. To create pedestrian and cyclist routes around the waterfront, for ease of walking. To connect the different areas of waterfront and establish connectivity of the water edge and inland spaces. To provide public spaces where people can unwind, contemplate, connect with local communities and find solace from the urban environment. To increase the socio-cultural value of the waterfront. To provide green spaces and vegetation as climatic barriers for the coastline.
2. Yacht Club
To provide a platform for professional sailors to enjoy the sport. To add to the recreational water activities in the city. To allow people who do not own boats, to sail using yacht club’s boats. To increase sea tourism and sports.
3. Retail Galleries
To draw larger number of locals as well as tourists to the waterfront. To provide the necessities required by yachtsmen who may be staying on their boats. To create source of revenue for the waterfront through commodity shops and services, tourist-oriented shopping, restaurants, cafes and eateries.
4. Exhibition Spaces and Pavilions
To provide a space for temporary exhibitions, fairs and pavilions. To serve as an open space or extensions of a park. To provide a space for local and international artists and traders to enjoy the waterfront pavilion.
5. Maritime Museum
To gather, keep, protect, investigate, and convey knowledge about Bombay's maritime heritage. To entertain as well as educate tourists about Bombay's maritime heritage (fishing, trade, shipping, defense, dockyards, transportation, and recreation) and current marine activities (fishing communities, navy, coast guard, port trust, recreational yachting and water transportation) To provide an observation tower will provide tourists with a vantage point view over the Mumbai harbour, port, and hinterland.
*Note- The design programme may be revised to include additional features during the design stage.
A waterfront is the zone where urban development meets the sea, and a waterfront region is regarded as a unique and precious resource.
Furthermore, the waterfront is defined as a location that integrates land and water and has a natural draw for visitors. In reality, the seaside and riverside are the most appealing water features for human habitation. In most nations, land adjacent to water is developed, before land adjacent to land. (Breen and Rigby, 1996)
The relationship between water and edge, requires the design to have multi-faceted integrated planning. The research and design have tried to integrate the following principles (Moretti, 2010) -
1. Protect water quality and the environment
2. Waterfronts are already a component of the urban fabric.
3. The historical identity is what gives the place its personality.
4. Mixed-use development is a focus.
5. Access to the general public is required.
6. Using a public-private collaboration to plan accelerates the process.
7. Revitalization is a constant process.
Eliel Saarinen
7.3 AREA STATEMENT


Additional spaces may include-
Water Sports Helipad Sky decks
*Note- The area statement is subjected to change as per design requirements.
7.4 CONCLUSION
Coastline is not only an external entity but an edge which suggests multiple existences within.
The thesis was prepared to begin a foundation of research and initiatory studies in improvement of form and space. Through the examination of this research it is clear that wateredges have always attracted human settlements. It is a combination of a manmade environment and the natural element, an interaction point between the city and water. The portlands of Mumbai, having historical significance offer the opportunity of renewal. The observations and interpretations of this thesis will revive the concepts of place-making, imageability and public spaces.
The contribution of the study to achieve on the eastern nautical territories, the portlands takes an architecture approach both locally and internationally. The study identified the special characteristics of architectural tactic in Mumbai. The architecture proposed within this thesis aims to merge the seemingly gap between land and water interaction for the tourists and locals in the city. It also means to serve such an architecture to the tangible needs that form the tourism and lifestyle of the city.
This idea of a consistent environment (melded between heritage and modernism) is reinforced specifically within building form and functionality as seen in the case studies. For this point of view, as seen in data collection chapter, each module acts as its own space within the city system and allows people to progress forward according to their own needs. In this sense, the architecture is flexible and sitespecific which will allow for greater feasibility in a variety of climate and user-groups. As a reflective thought, the author desires to pursue this project wholeheartedly into possible realization.
Loren Eiseley
LIST OF FIGURES
Figure 1- Poster, Source-Author .............................................................................................7 Figure 2- Portlands Infographic, Source-AuthorFigure 3- Poster, Source-Author ............7 Figure 4- View of Mumbai city, Source- Ujwal Puri photography ...................................15 Figure 5- Open Spaces Ratio of major cities, Source- Open Mumbai by P.K. Das (Das, 2012) ........................................................................................................................................17 Figure 6- - Eastern Waterfront’s Land Use Graph, Source- MbPT....................................19 Figure 7- Map of Major Neighborhoods,............................................................................19 Figure 8- Worli Sea Link with fishing boats, Source- Google ............................................21 Figure 9- The territories of waterside, waterfront and coastal development, Source (Jin, 1994)................................................................................................................................23 Figure 10 - Three related concepts in Japan’s third national development plan, Source (Jin, 1994)...................................................................................................................24 Figure 11- Marine drive at Nariman Point, Mumbai, Source - Holidify ...........................25 Figure 12- Singapore Marina Panorama ............................................................................26 Figure 13- Singapore Marina, Source- The Arup Journal: Issue 2012 ..............................27 Figure 14- - Singapore Marina Bay Sands Site Plans, Figure 15- Singapore Marina Site Plans,..............................................................................27 Figure 16- Dubai marina docking area ..............................................................................28 Figure 17- Plan of Dubai Marina and development of the region.................................28 Figure 18- Dubai Marina located at the Arabian Gulf shoreline ....................................29 Figure 19- Envisioned plan of Dubai Marina, Source- https://www.designbuildnetwork.com/projects/dubai-marina ................................................................................29 Figure 20- Kochi Marina and the docking areas ..............................................................30 Figure 21- Location of Kochi Marina, Source- Google Maps ..........................................30 Figure 22- Kochi Marina and the fishing nets Figure 23- Kochi Marina with traditional villas, Source- KITCO ........................................31 Figure 24- The five elements that define the city according to Lynch, Source: Author ..................................................................................................................................................32 Figure 25- Three principles of Imageability , Source: Author ...........................................33 Figure 26- The interaction between environment and observer leads to a cognitive map, Source: Author.............................................................................................................34 Figure 27- “To assemble or disperse”: Jan Gehl’s city planning principles. (Gehl, 2010) ..................................................................................................................................................34 Figure 28- What makes a great public space, Source: Project for Public Place .........35 Figure 29- Figure- Open Mumbai Plan Elements by P.K. Das, Source: P.K. Das, Open Mumbai Map .........................................................................................................................36 Figure 30 Timeline of Marina Development throughout history, Source- Asma Al Adhamy, 2014 ........................................................................................................................37 Figure 31- Imports percentage chart of Yacht in India, Source-Trend Economy ........37 Figure 32- Inshore sail boats racing on Sydney Harbour Figure 33- Luxury yachts in Mumbai; Gateway Charters .................................................38 Figure 34- Major destinations for Yachting in India, Source- Ace Global......................38 Figure 35- Royal Bombay Yacht Club in 1900’s Figure 36- Royal Bombay Yacht Club in 2000’s.................................................................39 Figure 37- Phases of waterfront interaction with the city, Source- Author ....................40 Figure 38- Little Island, New York City, Source- Archdaily ................................................41
Figure 40- The Canary Wharf in present times ...................................................................43 Figure 39- West India Docks and the Isle of Dogs, 1899 ...................................................43 Figure 41- Canary Wharf site plan Figure 42- Canary Wharf 3D site model..............................................................................44 Figure 43- A landscaped park at roof level is bounded on one side by the club’s restaurant terrace Source: Carlo Borlenghi .......................................................................45 Figure 44- Sketches of the Yacht Club by Norman Foster ...............................................45 Figure 45- Location Map of Yacht Club De Monaco, Europe........................................45 Figure 46- Site Plan of Yacht Club De Monaco.................................................................46 Figure 47- Site Section of Yacht Club De Monaco ...........................................................46 Figure 48- Section1 of Yacht Club Figure 49- Section2 of Yacht Club, Source- Archdaily .....................................................47 Figure 50- Deck of the Yacht Club De Monaco ...............................................................47 Figure 51- Images of Yacht Club De Monaco, Europe,...................................................47 Figure 52- Site plan of Yas Marina with the Ferrari World .................................................48 Figure 53- Yas Marina aerial view Figure 54- Yas Yacht Club and Marina...............................................................................48 Figure 55- Site plan of the Yas Marina ................................................................................48 Figure 56- Section of Yas Yacht Club..................................................................................49 Figure 57- Site section of Yas Yacht Club and Sailing club .............................................49 Figure 58- Floor Plans of Yas Yacht Club with Interior Spaces, Source- Archdaily........50 Figure 59- Site Showing Yacht Club Belo Horizonte in Pampulha...................................51 Figure 60- Sketch of Yacht Club Belo Horizonte................................................................51 Figure 61- Club Bela Horizonte.............................................................................................51 Figure 62- Sketch of Yacht Club Bela Horizonte................................................................52 Figure 63- Floor Plans of Yacht Club Belo Horizonte, Source- Designboom Figure 64- The structural columns ........................................................................................52 Figure 65- Club Bela Horizonte.............................................................................................52 Figure 66- The ramp...............................................................................................................52 Figure 67- Ramp leading to the structure ..........................................................................53 Figure 68- The V-shaped roof and swimming pool area..................................................53 Figure 69-The floor plans, Source- Archdaily......................................................................53 Figure 70- The cantilever functioning as a terrace ...........................................................53 Figure 71- Saint Feliu Yacht Club View ...............................................................................54 Figure 72- Site plan showing contours and docking areas,.............................................54 Figure 73- The level differences in the structure ................................................................55 Figure 74- Site plan showing the Ground floor plan .........................................................55 Figure 75- The cantilever walkways.....................................................................................55 Figure 76- Cantilevered walkway........................................................................................55 Figure 77- Site sections ..........................................................................................................55 Figure 78- Site sections showing the contour levels and heights....................................55 Figure 79- The walkways bridges connecting the park Figure 80- Site Plan of Little Island........................................................................................56 Figure 81- The different microclimatic regions on the Little Island, Source- Archdaily 56 Figure 82- Section1 showing the various levels..................................................................57 Figure 83- The piers and soil beds........................................................................................57 Figure 84- Section2 showing the walkways........................................................................57 Figure 85- The orientation of the site best suited to tackle winds and sea currents ....57
Figure 86- The unused port piers which were used for creating the public park .........57 Figure 87- The Blur building and the connecting walkways, highlighting the mist around the structure .............................................................................................................58 Figure 88- The plan of the Blur building, Source- Diller Scofidio+Ricardo ......................58 Figure 89- The regulation of wind and water in the structure Figure 90- The mechanism of mist production ..................................................................59 Figure 91- The Louvre Museum, Abu Dhabi, Source- Archdaily......................................60 Figure 92- Section of Museum spaces ................................................................................61 Figure 93- The scale of the Louvre Museum.......................................................................61 Figure 94- The Louvre surrounded by water.......................................................................61 Figure 95- Site plan of the Louvre Museum, Abu Dhabi...................................................61 Figure 96- The effect of sunlight and the reflection created inside ...............................62 Figure 97- The effect of Sunlight inside the museum ........................................................62 Figure 98- Natural lighting from the dome.........................................................................62 Figure 99- The layers of steel roofing...................................................................................62 Figure 100-The yacht club viewed from across the harbor, Source: Carlo Borlenghi .63 Figure 101- The Yas Marina Yacht Club and the docking area, Source- Archdaily ....63 Figure 102- The Yacht Club at Belo Horizonte with distinctive roof ................................63 Figure 103- Aerial view of Mumbai Harbour, Source- Google ........................................67 Figure 104- Mumbai waves crashing during High tides, Source- India today...............69 Figure 105- Map showing coastal cities of India and their demographics ...................70 Figure 106- Sponge city diagram ........................................................................................71 Figure 107- Definition of coastal sub-zones, adapted from the Shore Protection Manual, Source-coastalwiki.org..........................................................................................72 Figure 108- Coastal Erosion protection methods ..............................................................72 Figure 109- Map highlighting the existing and upcoming infrastructures on the coastline of Mumbai, Source-Author..................................................................................73 Figure 110- Coastal Regulation Zone Notification, 2018 ..................................................76 Figure 111- Map showing the coastal regulation zones, Source-CZMP.........................76 Figure 112- The proposed planning by APLI ......................................................................77 Figure 113- The proposed planning by HCP, Source- HCP ..............................................77 Figure 114- The master plan for Hafeez Contractor’s proposal, Source-The guardian ..................................................................................................................................................77 Figure 115- Mumbai Harbour nocturnal view, Source- Google......................................79 Figure 116- ‘Island City’ Evolution. 1670, Original Seven Islands, Source- Noel Murphy ..................................................................................................................................................81 Figure 117- ‘Island City’ Evolution. 1970-2019, Source- Noel Murphy.............................82 Figure 118- Demographic Data of Mumbai City: Census 2011, Source- (LSE, 2015)....83 Figure 119- History of Mumbai, Source- Shourya Jain.......................................................84 Figure 120- Infographic Urban Cross Section: Density to Open Space, SourceMumbai: Shift..........................................................................................................................86 Figure 121- Existing Bus and Train Network (left) / Proposed East/West RBT System (right) Source- Mumbai: Shift ...............................................................................................86 Figure 122- TDR Transfer Strategy. Source- Mumbai: Shift ................................................87 Figure 123- Mumbai Dockyards, Source MbPT..................................................................88 Figure 124- The development of Mumbai; Source MbPT.................................................89 Figure 125- Mumbai Harbour Map, Source MbPT .............................................................89 Figure 126- Salient features of Portland development proposal ....................................90
Figure 127- Portlands Land use flow chart, Source- MbPT ...............................................90 Figure 128- Environmental Framework Strategies, Source- Orange Li ...........................91 Figure 129- Mumbai Port evolution, Source- the Port of Bombay (Kamath, 2000).......92 Figure 130- MbPT area development over the years, Source- Hindustan times ..........93 Figure 131-Land use map of Eastern Waterfront area, Source- MbPT...........................95 Figure 132- Eastern Waterfront areas, Source- MbPT........................................................96 Figure 133- Maps of selected sites, Source- Author, Google maps ...............................97 Figure 134- Map showing the selected Site, Source- MbPT, Graphic-Author ...............98 Figure 135- Site selection matrix, Source- Author ..............................................................99 Figure 136- DCPR Map according to 2034 ......................................................................100 Figure 137- Bhaucha Dhakka at sunset, Source- Kaval Patel .......................................101 Figure 138- Satellite view of the Site, Source- Google Earth..........................................103 Figure 139- Development Plan of Princess and Victoria Docks, Source- DP Remarks ................................................................................................................................................105 Figure 140- Development of site over the years, Source- Google Earth .....................105 Figure 141- Flow chart of Site selection criteria, Source- Author...................................106 Figure 142- Proposed land use zones, MbPT....................................................................106 Figure 143-Mumbai and the various Landmarks on the Easternwaterfront ................107 Figure 144- Wind variation table........................................................................................108 Figure 145- Wind Rose diagram.........................................................................................108 Figure 146- Table showing Tide levels ...............................................................................109 Figure 147- Map showing sea currents affecting Mumbai ............................................109 Figure 148- Map showing City linkages ............................................................................110 Figure 149- Mapping of the Eastern waterfront area.....................................................111 Figure 150- Darukhana, Ship breaking yard ....................................................................112 Figure 151- Sasson Docks, Wet Dock, Colaba.................................................................112 Figure 152- Elphinstone Estate, Horniman Circle .............................................................112 Figure 153- Mumbai Port Trust ............................................................................................112 Figure 154- JNPT, Navi Mumbai .........................................................................................112 Figure 155- Site photographs taken by Author................................................................114 Figure 156- Ferry boats at Mumbai Harbour, Source- Google......................................117
