


Riverton City is pleased to present to you this year’s Annual Drinking Water Quality Report. This report is designed to inform you about the quality of the water and services the city delivers to you each day. The city’s constant goal is to provide you with a safe and dependable supply of drinking water. Riverton City’s water is purchased wholesale from Jordan Valley Water Conservancy District and is distributed through the city’s culinary water system. Efforts are continually being made to ensure our water is clean, safe, and of the highest quality.
Drinking water, including bottled water, may reasonably be expected to contain at least small amounts of some contaminants. The presence of contaminants does not necessarily indicate that water poses a health risk. More information about contaminants and potential health effects can be obtained by calling the Environmental Protection Agency’s (EPA) Safe Drinking Water Hotline at 800-426-4791.
The sources of drinking water (both tap water and bottled water) include rivers, lakes, streams, ponds, reservoirs, springs, and wells. As water travels over the surface of the land or through the ground, it dissolves naturally occurring minerals and, in some cases, radioactive material, and can pick up substances resulting from the presence of animals or from human activity: microbial contaminants, such as viruses and bacteria, that may come from sewage treatment plants, septic systems, agricultural livestock operations, and wildlife; inorganic contaminants, such as salts and metals, which can be naturally occurring or result from urban storm water runoff, industrial, or domestic wastewater discharges, oil and gas production, mining, or farming; pesticides and herbicides, which may come from a variety of sources such as agriculture, urban storm water runoff, and residential uses; organic chemical contaminants, including synthetic and volatile organic chemicals, which are by-products of industrial processes and petroleum production, and can also come from gas stations, urban storm water runoff, and septic systems; and radioactive contaminants, which can be naturally occurring or be the result of oil and gas production and mining activities. In order to ensure that tap water is safe to drink, the EPA prescribes regulations that limit the amount of certain contaminants in water provided by public water systems. Food and Drug Administration (FDA) regulations establish limits for contaminants in bottled water which must provide the same protection for public health.
Some people may be more vulnerable to contaminants in drinking water than the general population. Immune compromised persons such as persons with cancer undergoing chemotherapy, persons who have undergone organ transplants, people with HIV/ AIDS or other immune system disorders, some elderly, and infants can be particularly at risk of infections. These people should seek advice about drinking water from their health care providers. EPA/CDC guidelines on appropriate means to lessen the risk of infection by cryptosporidium and other microbial contaminants are available from the Safe Drinking Water Hotline at 800-426-4791.
If present, elevated levels of lead can cause serious health problems, especially for pregnant women and young children. Lead in drinking water is primarily from materials and components associated with service lines and home plumbing. Riverton City is responsible for providing high quality drinking water but cannot control the variety of materials used in plumbing components. When your water has been sitting for several hours, you can minimize the potential for lead exposure by flushing your tap for thirty seconds to two minutes before using water for drinking or cooking. If you are concerned about lead in your water, you may wish to have your water tested. Information on lead in drinking water, testing methods, and steps you can take to minimize exposure is available from the Safe Drinking Water Hotline at epa.gov/safewater/lead or 800-426-4791. Testing can be provided by Riverton City for a fee.
Drinking water, including bottled water, may reasonably be expected to contain at least small amounts of contaminants. The presence of contaminants does not necessarily indicate that water poses a health risk. More information can be obtained by calling Environmental Protection Agency’s Safe Drinking Water Hotline at 800-426-4791.
We invite you to learn more about opportunities for participation in decisions that affects the quality of your drinking water. Visit rivertonutah.gov/water for information, detailed water reports and upcoming projects for both culinary and secondary water.

The table on the next page lists all of the parameters in the drinking water detected by Jordan Valley Water Conservancy District or its suppliers in the drinking water during the calendar year of this report. The presence of these parameters in the water does not necessarily indicate that the water poses a health risk. Unless otherwise noted, the data presented in this table is from testing done in the calendar year of this report. For certain parameters, the EPA and/or the State of Utah requires monitoring at a frequency less than once per year because the concentrations do not change frequently.
Riverton City is dedicated to providing our residents and customers with safe, clean drinking water. Maintaining a Backflow Prevention Program is an essential key to accomplishing this goal.
The city and its residents share a joint responsibility to ensure all areas of the water distribution system are adequately protected. The city will provide a safe, adequate water supply to the residents who in turn will maintain their plumbing systems in compliance with state and local ordinances, requirements, codes and policies.
Backflow incidents can seriously affect the quality and safety of the drinking water. Backflow is the reverse flow of contaminated water or other substances from a user’s water system back into the public drinking water system. This can occur if your plumbing system is physically connected (also called a cross-connection) to any source of contamination or pollution. Common examples of possible cross-connections include landscape sprinkling systems, hose attachments for utility sinks, and garden hoses. Backflow prevention assemblies provide the public water system with protection against contamination or pollution. Riverton City’s Water Department randomly performs assessments of every residential sprinkler irrigation system to determine compliance with the above
mentioned requirements. You can email Riverton with your backflow questions anytime at backflow@riverton utah.gov
Riverton is committed to finding and implementing ways to help minimize its water footprint. Training and educating on more water friendly choices for landscaping, more efficient ways to water, updating home or business with water saving fixtures. By utilizing programs that are offered by Jordan Valley Water Conservancy District and Salt Lake County, Riverton and it’s residence can offset some of the cost of becoming more efficient and water conscientious.
Survey’s where mail out to residents with homes built in 1989 and prior and then again a second time to residents who did not complete the survey the first time. If you still haven’t completed your survey please take afew minutes to do so. The survey is very important and the information is being required by the state of Utah and the EPA to be gathered. Riverton Water has also resorted to going door to door to those that have not completed their surveys which is using resources that could be put to other uses. If you did not recieve a survey in the mail and your home was built in 1989 or prior you can go online to rivertonutah.gov/culinary-water-pipe For more information or help call 801-208-3142 or email leadcopper@rivertonutah.gov
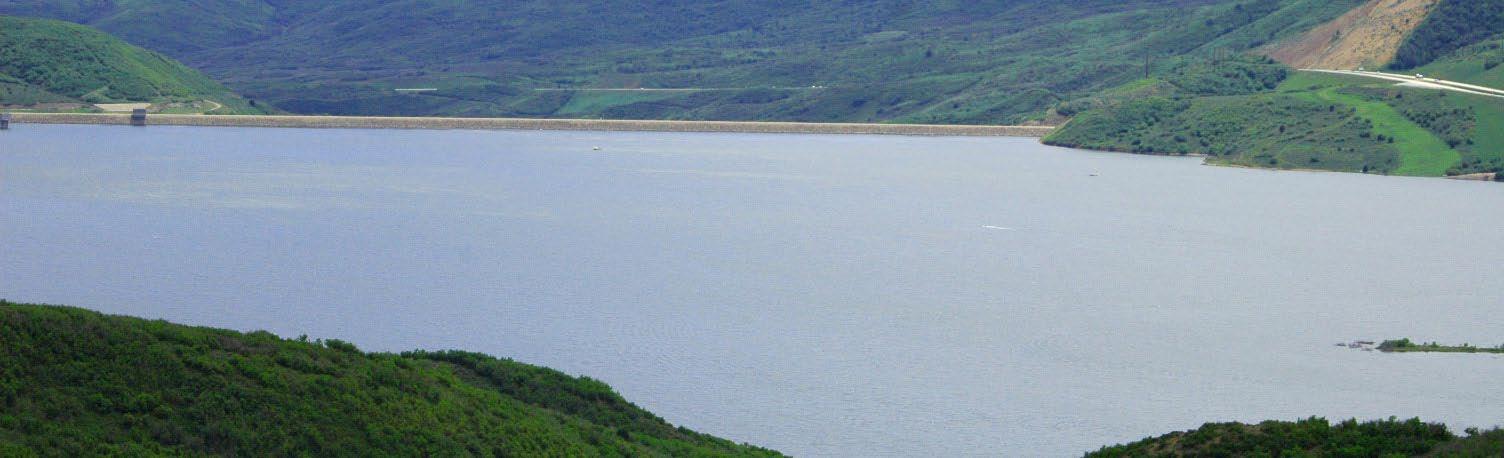
Riverton purchases all of the drinking water from Jordan Valley Water Conservancy District (JVWCD) located in Bluffdale. Whose main water sources include Deer Creek and Jordenelle reservoirs, as well as the Provo River watershed, and some ground water sources/wells. In 2023 JVWCD delivered over 1.78 billion gallons of water to Riverton residents and businesses, an increase of 150 million gallons from 2022.
RIVERTON CITY WATER QUALITY DATA
Consumer Confidence Report Report: 2023 Riverton City Water Quality Data
TTHM's Range of Samples
Contaminant
Asbestos
By-product of drinking water disinfection. Avg. in High Avg. colum can be from different sample locations
Comments
Sampling is done every 9yrs
90th Percentile Lead 90th Percentile Copper 0.0032 mg/L
Sampling done every 3yrs. Lead & Copper violation is determined by the 90th percentile result. Corrosion of household plumbing system, erosion of naturally occurring deposits contribute.
Hardness samples are taken once a month at multiple locations for a monthly average.
PFAS are a group of synthetic chemicals used in a wide range of consumer products and industrial applications.
Lithium naturally occurring metal that may concentrate in brine water; Lithium salt can be found in pharmaceuticals, electrochemical cells and batteries to name a few products.
Consumer Confidence Report Data - UCMR 5 2023
Report: UCMR Appendix
The table below lists all of the parameters in the drinking water detected by Jordan Valley Water Conservancy District or its suppliers in the drinking water during the calendar year of this report for the Unregulated Contaminant Monitoring Rule. The presence of these parameters in the water does not necessarily indicate that the water poses a health risk. Unless otherwise noted, the data presented in this table is from testing done in the calendar year of this report. For certain parameters, EPA and/or the State requires monitoring at a frequency less than once per year because the concentrations do not change frequently.
MCLMCLG Violation
Unregulated Parameters
Lithium,Totalug/L2.816NDURNENo2023 perfluorobutanoicacid(PFBA)ug/LNDNDNDURNENo2023 perfluoro-3-methoxypropanoicacid(PFMPA)ug/LNDNDNDURNENo2023 perfluoropentanoicacid(PFPeA)ug/LNDNDNDURNENo2023 perfluorobutanesulfonicacid(PFBS)ug/LNDNDNDURNENo2023 perfluoro-4-methoxybutanoicacid(PFMBA)ug/LNDNDNDURNENo2023 perfluoro(2-ethoxyethane)sulfonicacid(PFEESA)ug/LNDNDNDURNENo2023 nonafluoro-3,6-dioxaheptanoicacid(NFDHA)ug/LNDNDNDURNENo2023 1H,1H,2H,2H-perfluorohexanesulfonicacid
(4:2FTS)ug/LNDNDNDURNENo2023 perfluorohexanoicacid(PFHxA)ug/LNDNDNDURNENo2023 perfluoropentanesulfonicacid(PFPeS)ug/LNDNDNDURNENo2023 hexafluoropropyleneoxidedimeracid(HFPODA)ug/LNDNDNDURNENo2023 perfluoroheptanoicacid(PFHpA)ug/LNDNDNDURNENo2023 perfluorohexanesulfonicacid(PFHxS)ug/LNDNDNDURNENo2023 4,8-dioxa-3H-perfluorononanoicacid(ADONA)ug/LNDNDNDURNENo2023 1H,1H,2H,2H-perfluorooctanesulfonicacid (6:2FTS)ug/LNDNDNDURNENo2023 perfluoroheptanesulfonicacid(PFHpS)ug/LNDNDNDURNENo2023 perfluorooctanoicacid(PFOA)ug/LNDNDNDURNENo2023 perfluorononanoicacid(PFNA)ug/LNDNDNDURNENo2023 perfluorooctanesulfonicacid(PFOS)ug/LNDNDNDURNENo2023 9-chlorohexadecafluoro-3-oxanonane-1-sulfonicacid (9Cl-PF3ONS)ug/LNDNDNDURNENo2023 perfluorodecanoicacid(PFDA)ug/LNDNDNDURNENo2023 1H,1H,2H,2H-perfluorodecanesulfonicacid (8:2FTS)ug/LNDNDNDURNENo2023 perfluoroundecanoicacid(PFUnA)ug/LNDNDNDURNENo2023 11-chloroeicosafluoro-3-oxaundecane-1-sulfonicacid (11Cl-PF3OUdS)ug/LNDNDNDURNENo2023 perfluorododecanoicacid(PFDoA)ug/LNDNDNDURNENo2023 n-methylperfluorooctanesulfonamidoaceticacid (NMeFOSAA)ug/LNDNDNDURNENo2023 N-ethylperfluorooctanesulfonamidoaceticacid (NEtFOSAA)ug/LNDNDNDURNENo2023 perfluorotridecanoicacid(PFTrDA)ug/LNDNDNDURNENo2023 perfluorotetradecanoicacid(PFTA)ug/LNDNDNDURNENo2023
The Unregulated Contaminant Monitoring Rule (UCMR) is a monitoring program mandated by EPA. It requires public water systems to monitor various sites every three (3) years for different parameters selected by EPA. This rule collects occurance data on parameters that EPA is considering for regulation. Sometimes EPA includes parameters that already have an MCL but they would like to know the occurance of it at significantly lower levels than the current analytical method allows. These numbers represent samples taken during the monitoring period which began in 2023 and will conclude in 2025.
1/cm: One / centimeter
AL: Action Level
CU: Color Unit
Cysts/1L: Cysts per 1 liter
HAA5s: Five Haloacetic Acids
HPC: Heterotrophic Plate Count
mg/L: milligrams per liter
MCL: Maximum Contaminant Level
MCLG: Maximum Contaminant Level Goal
MFL: Millions of Fibers per Liter
MPN/mL: most probable number per milileter
MRL: Minimum Reporting Level
NA: Not Applicable
ND: None Detected
NE: Not Established
ng/L: nanograms per liter
NTU: Nephelometric Turbidity Unit
Oocysts/1L: Oocysts per 1 liter
pg/L: picograms per liter
pCi/L: picocuries per liter
PCBs: Polychlorinated Biphenyls
SS: Secondary Standard
SOCs: Synthetic Organic Chemicals
TON: Threshold Odor Unit
TT: Treatment Technique
TTHM: Total Trihalomethanes
UR: Unregulated
ug/L: micrograms per liter
umhos/cm: micro ohms per centimeter
VOCs: Volatile Organic Compounds
Consumer Confidence Report Data 2023
Report: C
The table below lists all of the parameters in the drinking water detected by Jordan Valley Water Conservancy District or its suppliers in the drinking water during the calendar year of this report. The presence of these parameters in the water does not necessarily indicate that the water poses a health risk. Unless otherwise noted, the data presented in this table is from testing done in the calendar year of this report. For certain parameters, EPA and/or the State requires monitoring at a frequency less than once per year because the concentrations do not change frequently.
PRIMARY INORGANICS
Antimonyug/LNDNDND6.006.00No2023
Arsenicug/L1.34.3ND10.00.0No2023
Asbestosug/LNDNDND7.07.0No2021
Bariumug/L50.5104.0ND20002000No2023
Berylliumug/LNDNDND44No2023
Cadmiumug/LNDNDND5.005.00No2023
Copperug/L1.338.0NDNENENo2023
Chromiumug/L0.409.4ND100.0100.0No2023
Cyanide,Freeug/L0.903.7ND200.0200.0No2023
Fluorideug/L0.430.88ND4.04.0No2023
Leadug/LNDNDNDNENENo2023
Mercuryug/LNDNDND2.002.00No2023
Nickelug/L0.213.5NDNENENo2023
Nitrateug/L0.672.3ND10.010.0No2023
Nitriteug/LNDNDND1.01.0No2023
Seleniumug/L0.452.4ND50.050.0No2023
Sodiumug/L23.274.211.7NENENo2023
Sulfateug/L59.4118.013.51000NENo2023
Thalliumug/L0.000020.0002ND2.00.5No2023
TDSug/L292.4652.028.02000NENo2023
Turbidity(groundwatersources)ug/L0.120.410.015.0NENo2023
Turbidity(surfacewatersources)ug/L0.040.840.020.3TTNo2023
LowestMonthly%MeetingTTug/L100%(TreatmentTechniquerequirementappliesonlytotreatedsurfacewatersources)
SECONDARY INORGANICS - Aesthetic Standards
Aluminumug/L2.850.0NDSS=50-200NENo2023
Chloridemg/L49.8161.017.2SS=250NENo2023
ColorCU4.210.00.12SS=15NENo2022
Ironug/L15.2313.0NDSS=300NENo2023
Manganeseug/L2.434.0NDSS=50NENo2023
OdorTONNDNDNDSS=3NENo2022
pH7.68.46.8SS=6.5-8.5NENo2023
Silverug/LNDNDNDSS=100NENo2023
Zincug/L0.081.3NDSS=5000NENo2023
UNREGULATED PARAMETERS - monitoring not required
Alkalinity,Bicarbonatemg/L161.4225.0107.0URNENo2023
Alkalinity,Carbonatemg/LNDNDNDURNENo2023
Alkalinity,Hydroxidemg/LNDNDNDURNENo2023
Alkalinity,Total(CaCo3)mg/L112.0225.014.0URNENo2023
Ammoniamg/L0.300.300.30URNENo2018
Bromideug/LNDNDNDURNENo2021
Boronug/L35.039.031.0URNENo2018
Calciummg/L45.674.932.3URNENo2023
ChemicalOxygenDemandmg/LNDNDNDURNENo2014
Chloropicrinug/LNDNDNDURNENo2014
Cobaltmg/LNDNDNDURNENo2022
Conductanceumhos/cm452.31100.033.8URNENo2023
Cyanide,Totalug/L0.62.0NDURNENo2023
Dioxinpg/LNDNDNDURNENo2009
Geosminng/L3.012.3NDURNENo2023
Hardness,Calciummg/L116.4186.012.0URNENo2023
Hardness,Totalmg/L189.3357.075.6URNENo2023
ChromiumVImg/LNDNDNDURNENo2011
Magnesiummg/L16.741.3NDURNENo2023
Molybdenumug/LNDNDNDURNENo2022
- Chart continued on the next page -
Oil&Greasemg/LNDNDNDURNENo2016
Orthophosphatesug/L0.0190.22NDURNENo2023
Potassiummg/L2.410.9NDURNENo2023
Silica(SiliconDioxide)mg/LNDNDNDURNENo2020
Bromideug/LNDNDNDURNENo2021
Boronug/L35.039.031.0URNENo2018
Calciummg/L45.674.932.3URNENo2023
ChemicalOxygenDemandmg/LNDNDNDURNENo2014
Chloropicrinug/LNDNDNDURNENo2014
Cobaltmg/LNDNDNDURNENo2022
Conductanceumhos/cm452.31100.033.8URNENo2023
Cyanide,Totalug/L0.62.0NDURNENo2023
Dioxinpg/LNDNDNDURNENo2009
Geosminng/L3.012.3NDURNENo2023
Hardness,Calciummg/L116.4186.012.0URNENo2023
Hardness,Totalmg/L189.3357.075.6URNENo2023
ChromiumVImg/LNDNDNDURNENo2011
Consumer Confidence Report Data 2023 - Continued from previous pageMCLMCLG Violation
PRIMARY INORGANICS
Magnesiummg/L16.741.3NDURNENo2023
Molybdenumug/LNDNDNDURNENo2022
Antimonyug/LNDNDND6.006.00No2023
Oil&Greasemg/LNDNDNDURNENo2016
Arsenicug/L1.34.3ND10.00.0No2023
AsbestosMFLNDNDND7.07.0No2021
Orthophosphatesug/L0.0190.22NDURNENo2023
Bariumug/L50.5104.0ND20002000No2023
Berylliumug/LNDNDND44No2023
Potassiummg/L2.410.9NDURNENo2023
Cadmiumug/LNDNDND5.005.00No2023
Silica(SiliconDioxide)mg/LNDNDNDURNENo2020
Copperug/L1.338.0NDNENENo2023
TSS(TotalSuspendedSolids)mg/L0.44.0NDURNENo2023
Chromiumug/L0.409.4ND100.0100.0No2023
Turbidity(distributionsystem)NTU0.300.90.06URNENo2023
Vanadiumug/L1.43.3NDURNENo2022
Cyanide,Freeug/L0.903.7ND200.0200.0No2023
Fluoridemg/L0.430.88ND4.04.0No2023
VOCs
Chloroformug/L7.427.9NDURNENo2023
Leadug/LNDNDNDNENENo2023
Dibromochloromethaneug/L1.15.1NDURNENo2023
Mercuryug/LNDNDND2.002.00No2023
Nickelug/L0.213.5NDNENENo2023
Bromodichloromethaneug/L2.66.8NDURNENo2023
Nitratemg/L0.672.3ND10.010.0No2023
Bromoformug/LNDNDNDURNENo2023
Nitritemg/LNDNDND1.01.0No2023
AllOtherParametersug/LNDNDNDVariousVariousNo2023
PESTICIDES/PCBs/SOCs
Seleniumug/L0.452.4ND50.050.0No2023
Bis(2ethylhexyl)phthalateug/LNDNDND6.00.0No2023
Sodiummg/L23.274.211.7NENENo2023
AllOtherParametersug/LVariousVariousNo2023
Sulfatemg/L59.4118.013.51000NENo2023
RADIOLOGICAL
Thalliumug/L0.000020.0002ND2.00.5No2023
Radium226pCi/L0.461.30.05NENENo2023
TDSmg/L292.4652.028.02000NENo2023
Turbidity(groundwatersources)NTU0.120.410.015.0NENo2023
Radium228pCi/L0.281.3-0.30NENENo2023
Turbidity(surfacewatersources)NTU0.040.840.020.3TTNo2023
Gross-AlphapCi/L1.63.60.5015.0NENo2023
LowestMonthly%MeetingTT%100%(TreatmentTechniquerequirementappliesonlytotreatedsurfacewatersources)
Gross-BetapCi/L3.511.00.950.0NENo2023
SECONDARY INORGANICS - Aesthetic Standards
Uraniumug/L0.0040.0040.00430.0NENo2023
Aluminumug/L2.850.0NDSS=50-200NENo2023
RadonpCi/LNDNDNDNENENo2020
DISINFECTANTS / DISINFECTION BY-PRODUCTS
Chloridemg/L49.8161.017.2SS=250NENo2023 ColorCU4.210.00.12SS=15NENo2022
Chlorinemg/L0.771.50.014.0NENo2023
Ironug/L15.2313.0NDSS=300NENo2023
TTHMsug/L21.266.3ND80.0NENo2023
Manganeseug/L2.434.0NDSS=50NENo2023
HAA5sug/L17.565.1ND60.0NENo2023
OdorTONNDNDNDSS=3NENo2022 pH7.68.46.8SS=6.5-8.5NENo2023
HAA6ug/L53.070.932.3URNENo2023
Silverug/LNDNDNDSS=100NENo2023
HighestAnnualLocationWideAvg.ug/L
= 45.6 ug/L, HAA5s = 28.8 ug/L
Zincug/L0.081.3NDSS=5000NENo2023
Bromateug/LNDNDND10.0NENo2023
UNREGULATED PARAMETERS - monitoring not required
ChlorineDioxideug/L0.0030.04ND800NENo2023
Alkalinity,Bicarbonatemg/L161.4225.0107.0URNENo2023
Chloritemg/L0.380.620.11.000.80No2023
Alkalinity,Carbonatemg/LNDNDNDURNENo2023
ORGANIC MATERIAL
Alkalinity,Hydroxidemg/LNDNDNDURNENo2023
TotalOrganicCarbonmg/L2.02.9NDTTNENo2023
Alkalinity,Total(CaCo3)mg/L112.0225.014.0URNENo2023
Ammoniamg/L0.300.300.30URNENo2018
DissolvedOrganicCarbonmg/L2.22.71.8TTNENo2023 UV-2541/cm0.0250.0400.016URNENo2023
Bromideug/LNDNDNDURNENo2021
PROTOZOA (sampled at source water)
Boronug/L35.039.031.0URNENo2018
CryptosporidiumOocysts/1LNDNDNDTT0.00No2017
Calciummg/L45.674.932.3URNENo2023
GiardiaCysts/1L1.57.0NDTT0.00No2017
ChemicalOxygenDemandmg/LNDNDNDURNENo2014
Chloropicrinug/LNDNDNDURNENo2014
Cobaltmg/LNDNDNDURNENo2022
Conductanceumhos/cm452.31100.033.8URNENo2023
Cyanide,Totalug/L0.62.0NDURNENo2023
Dioxinpg/LNDNDNDURNENo2009
Bromodichloromethaneug/L2.66.8NDURNENo2023
Bromoformug/LNDNDNDURNENo2023
AllOtherParametersug/LNDNDNDVariousVariousNo2023
Bis(2ethylhexyl)phthalateug/LNDNDND6.00.0No2023 AllOtherParametersug/LVariousVariousNo2023

2023 Water Consumer Confidence Report Spanish (Espanol): Este
ELECTED OFFICIALS
Trent Staggs Mayor
Andy Pierucci City Council – District 1
Troy McDougal City Council – District 2
Tawnee McCay City Council – District 3
Tish Buroker City Council – District 4
Spencer Haymond City Council – District 5
WATER DEPARTMENT
Cary Necaise Public Works Director
Stacie Olson Assistant Public Works Director
Kal McDonald Water Manager
Darcy Lowry Assistant Water Manager
PUBLIC WORKS DEPARTMENT | WATER DIVISION 12526 S 4150 W | Riverton, Utah 84096 | 801-208-3162
rivertonutah.gov/water