9.1 Appendix B - Mapping Layers
Mapping Layers
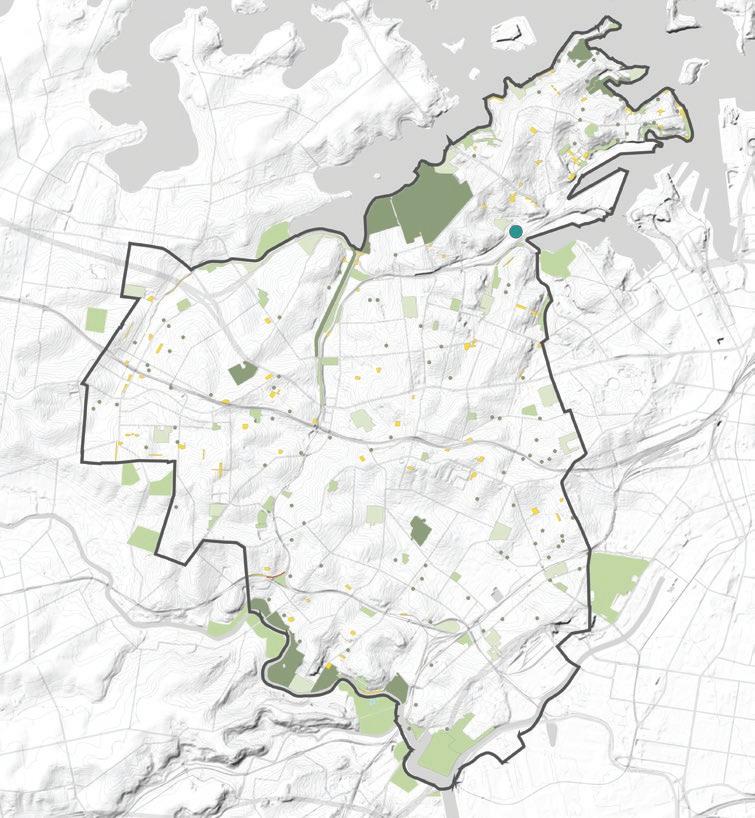
LOCAL CONTEXT
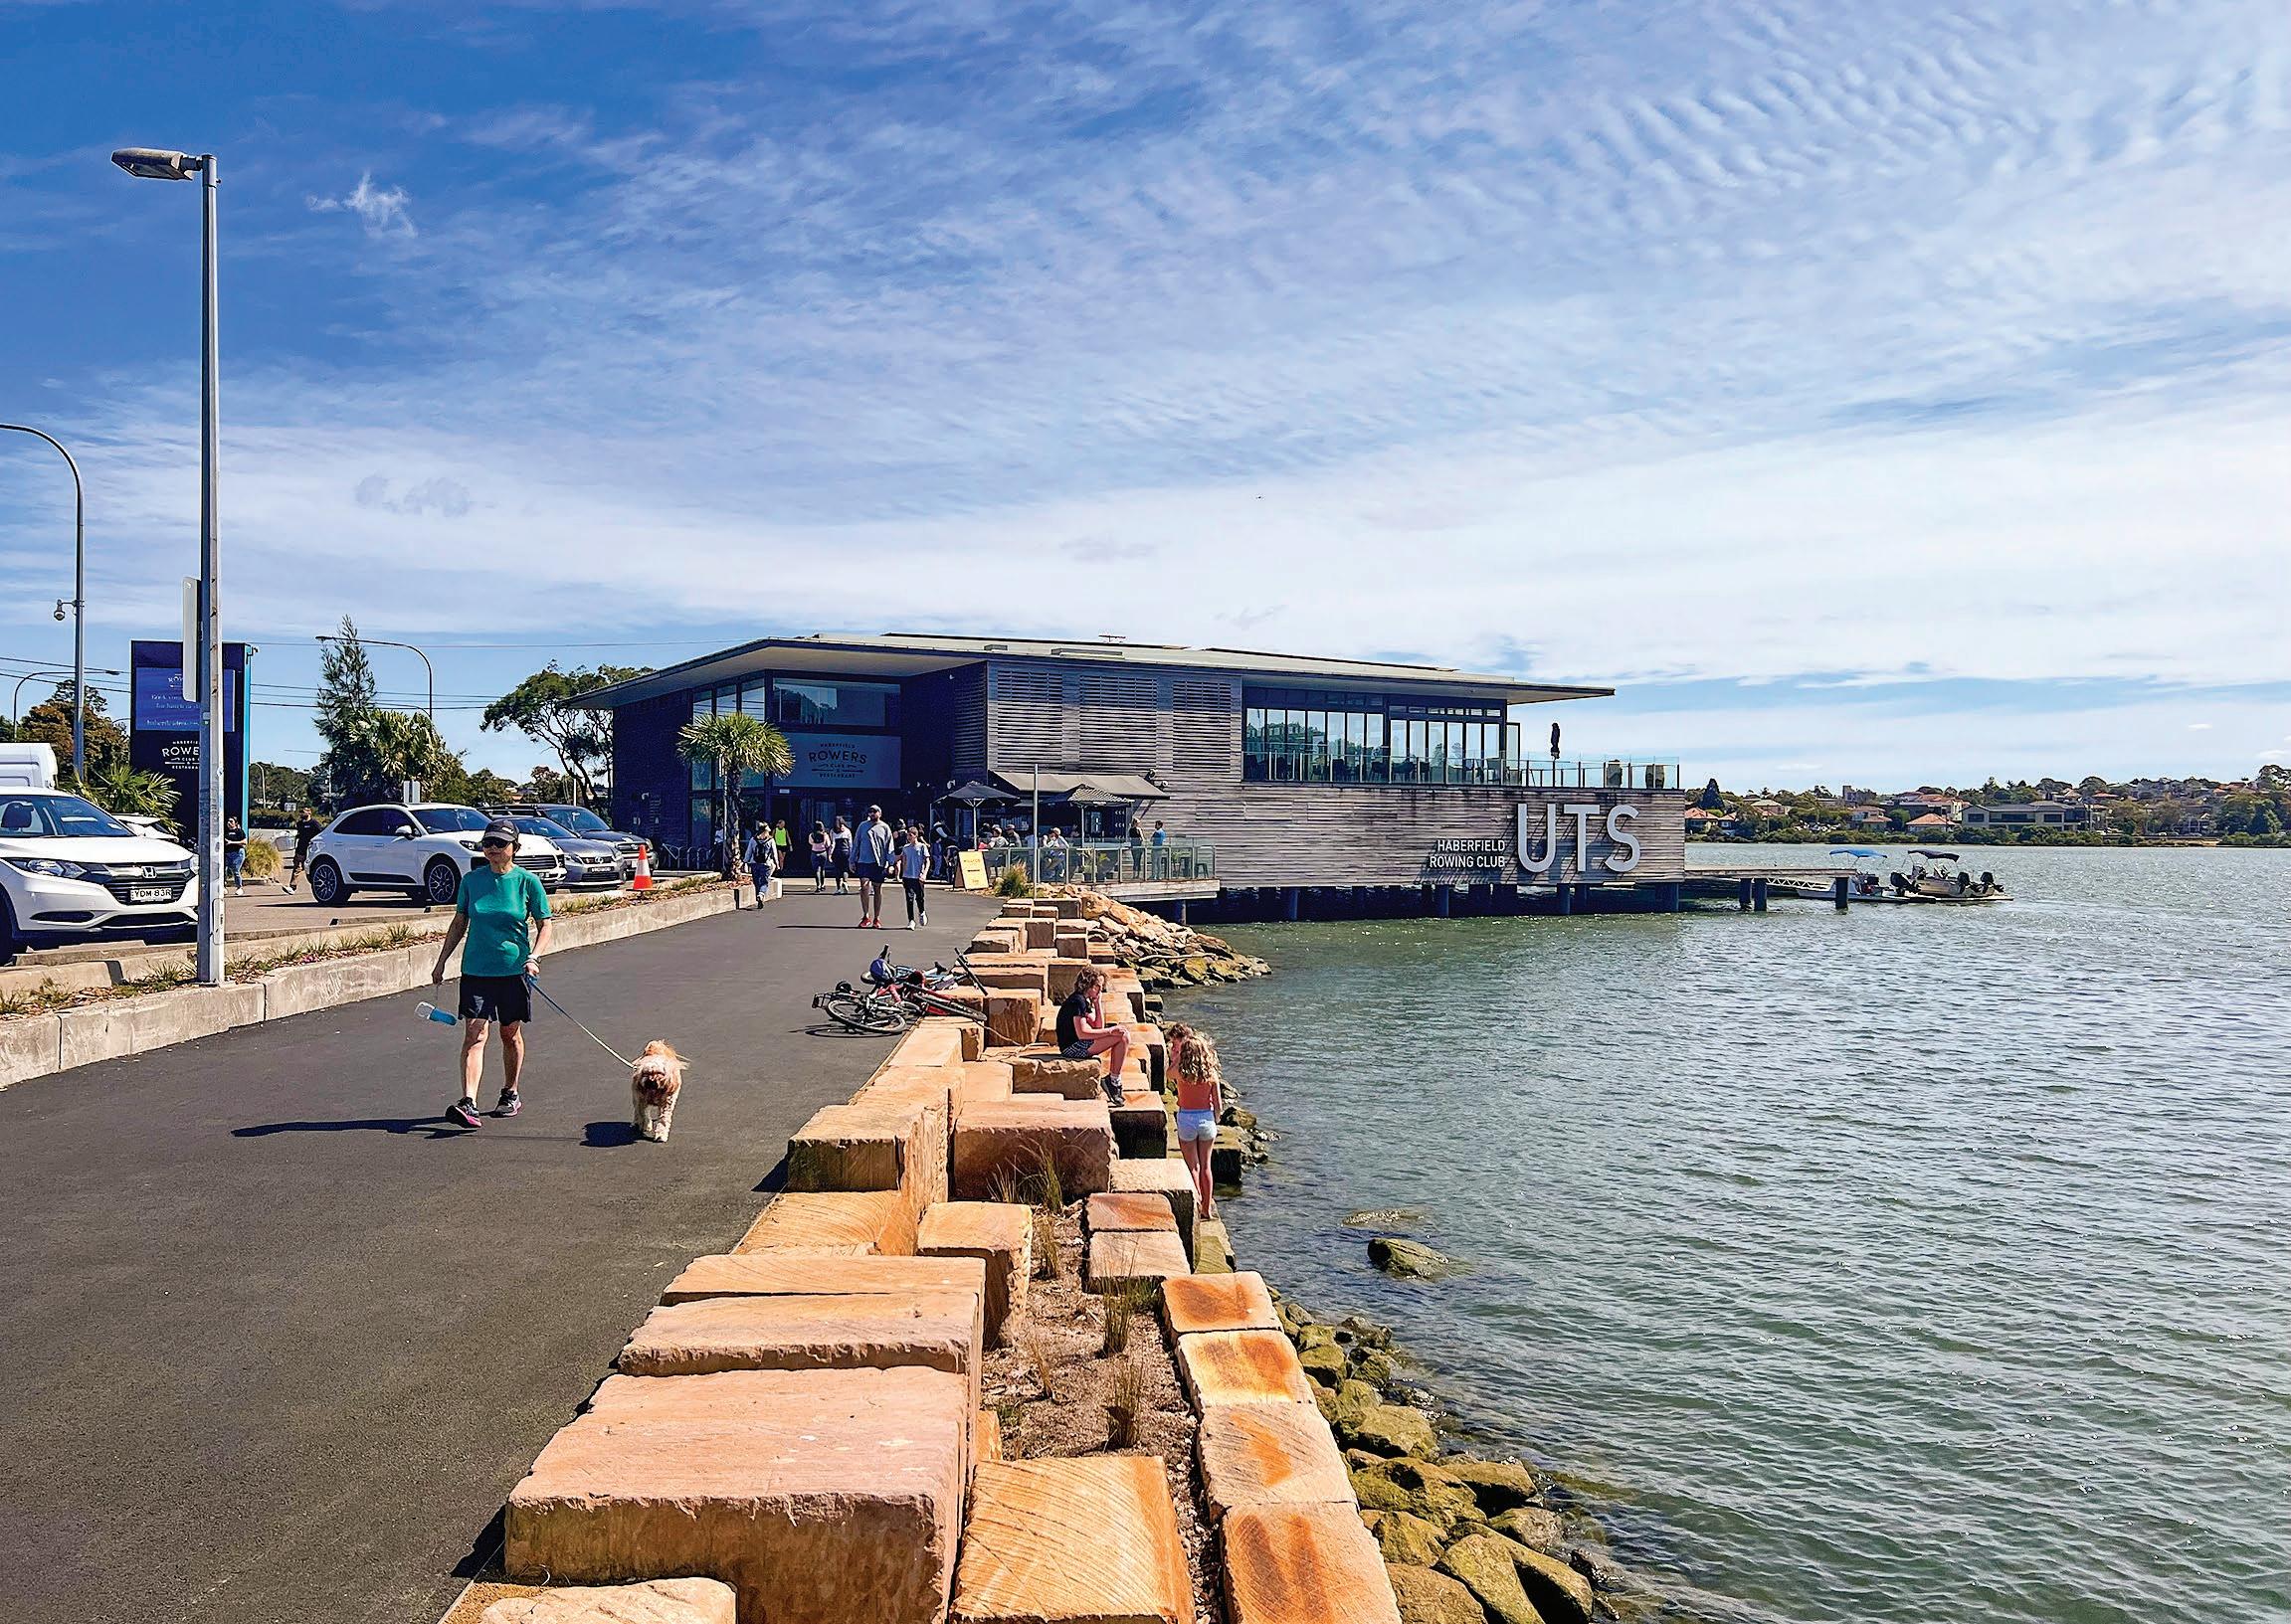
The Inner West borders with the Sydney Harbour and is located within close proximity to key destinations.
The local area has a prominent transport infrastructure network, with plans to extend the Sydney metro network.
The local area has numerous State significant projects running through the Inner West, providing an opportunity to apply the Blue-Green Grid to new projects.
Legend
Inner West LGA Boundary
Parks
Water bodies
State significant projects
Train Line
Train Station
Light Rail
Light Rail Station
Under construction Metro line
Under construction Metro Station
University
Hospital
Shopping & Eating
Sports & Entertainment
Airport
Inner West Blue-Green Grid Strategy 2023 103
PrincesHighway Princess
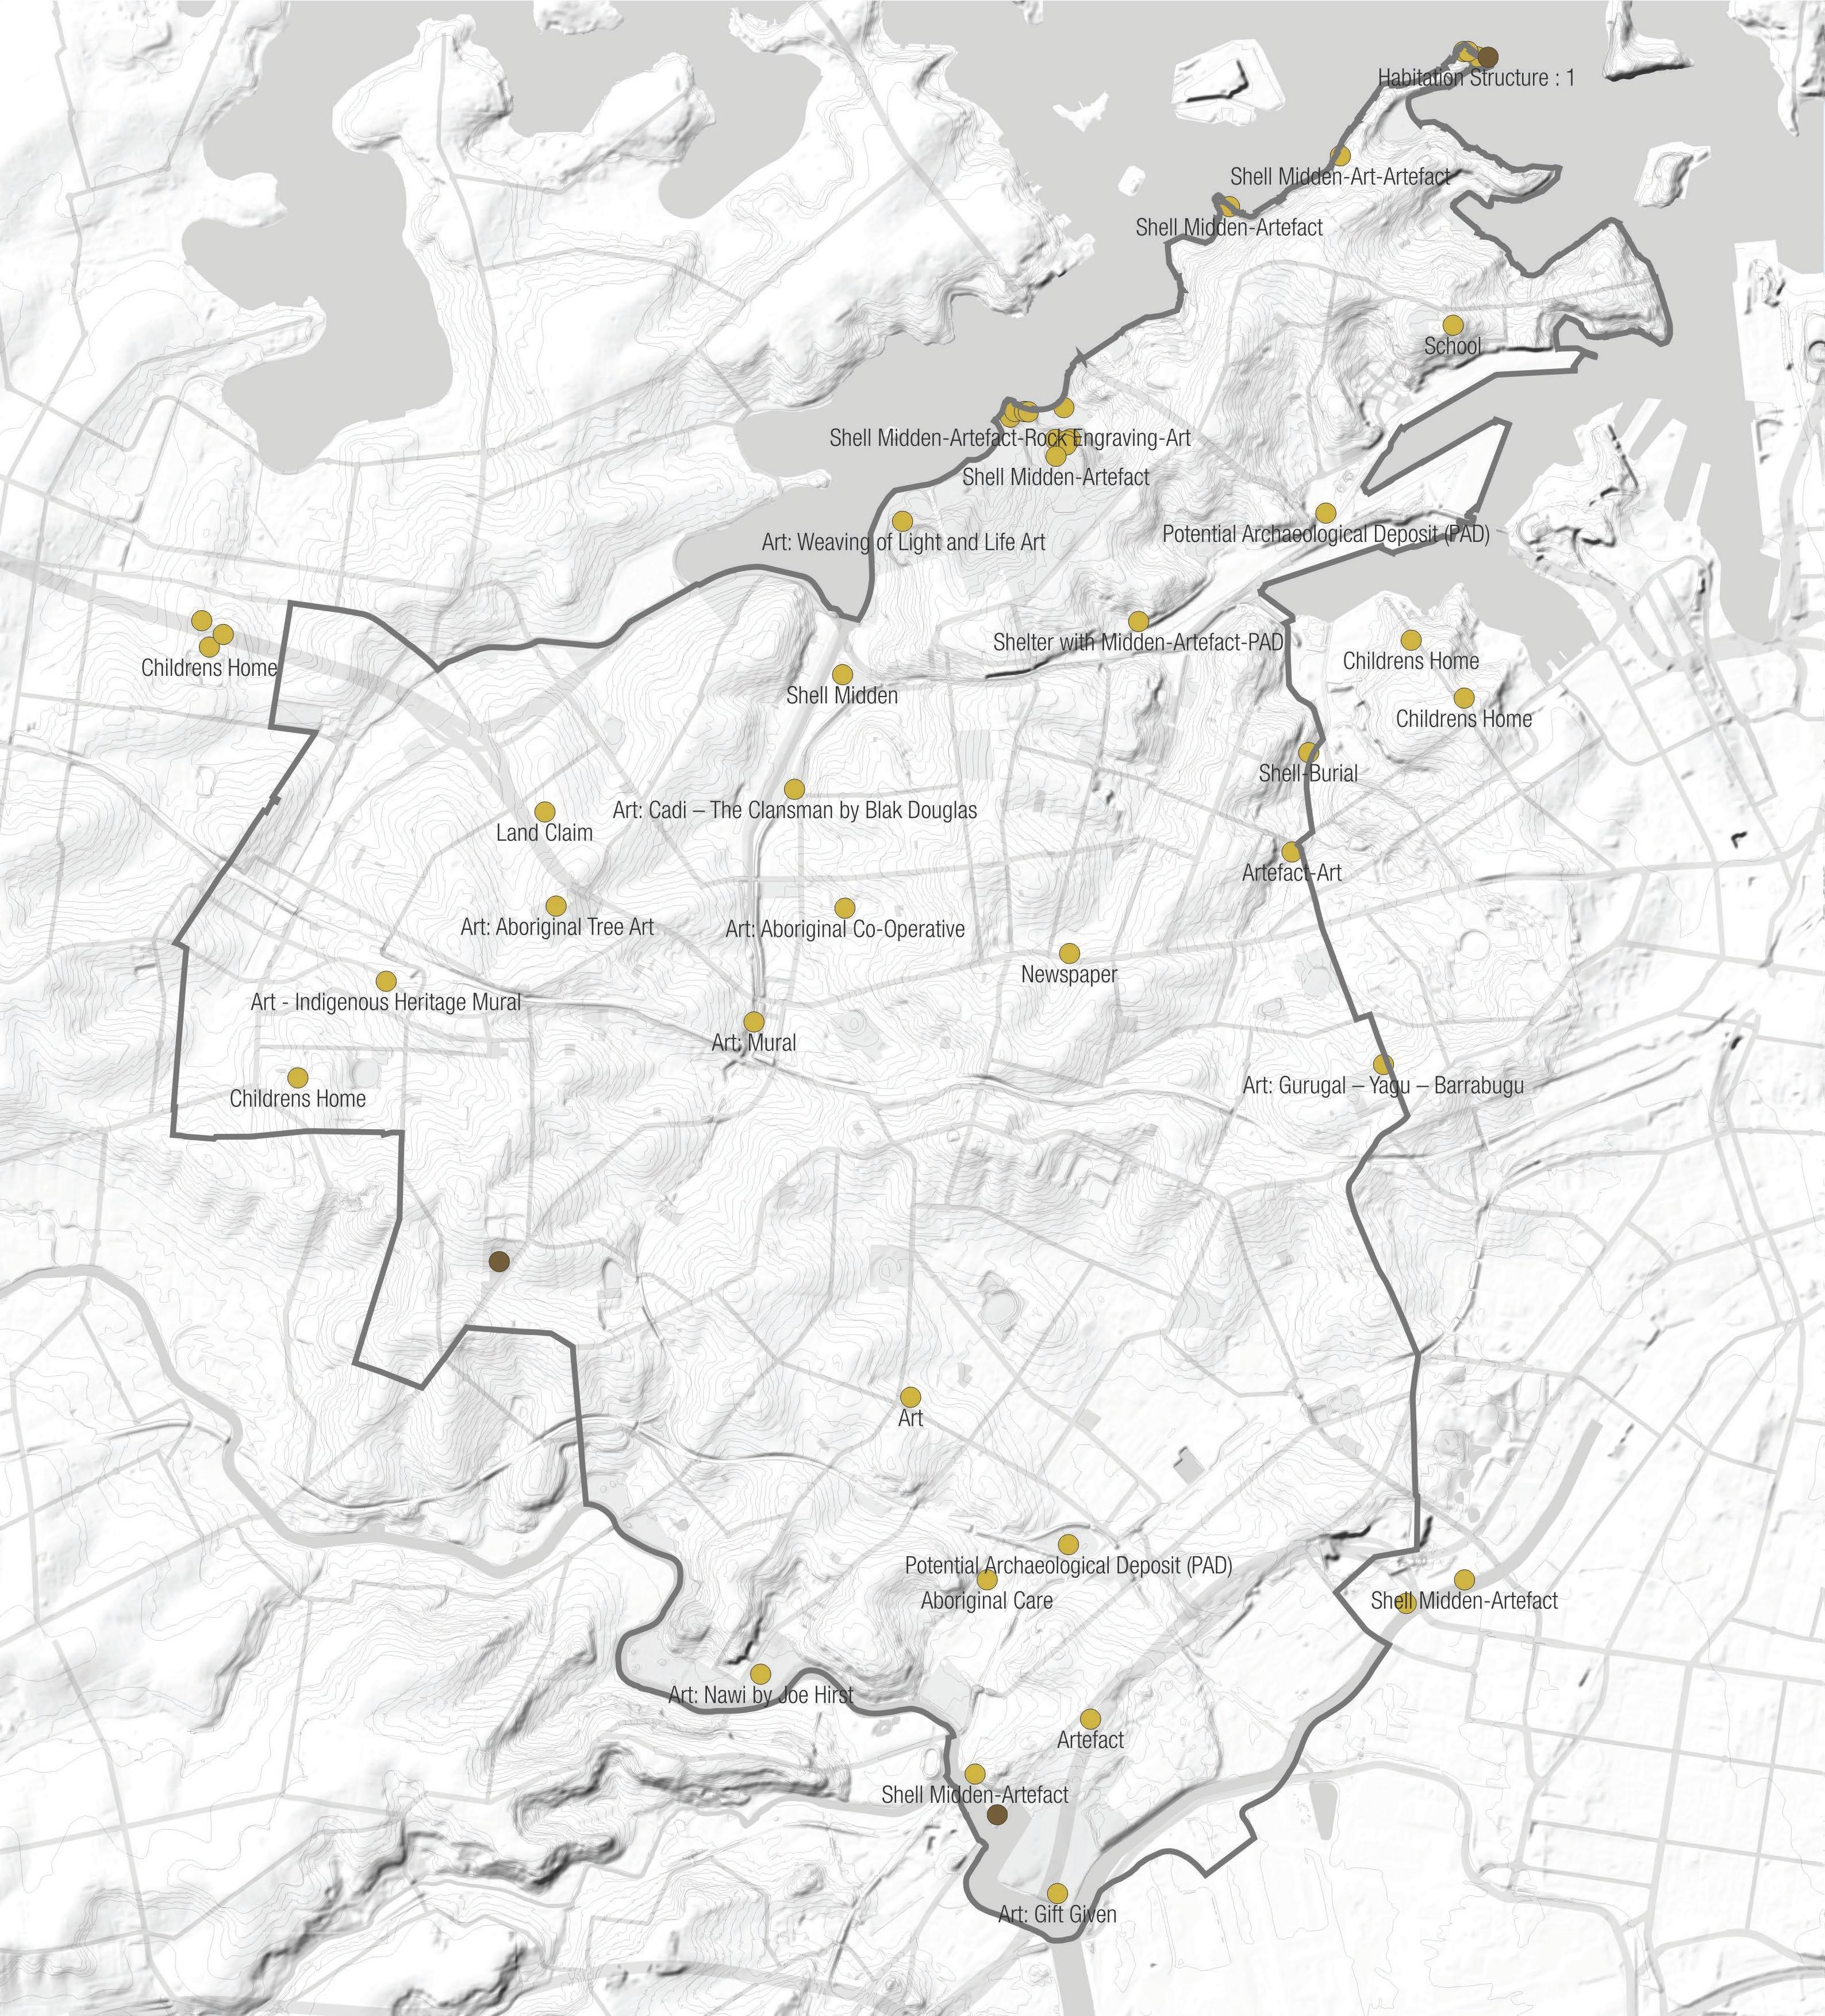
Mapping Layers
Indigenous Place Points
The ATSIACH Grid will incorporate indigenous significant places, both new and heritage, for accessibility, education and protection.
Map source: Shapefile provided by Inner West Council.
Legend
Inner West LGA Boundary
Indigenous Place Points
Additional identified Place Points
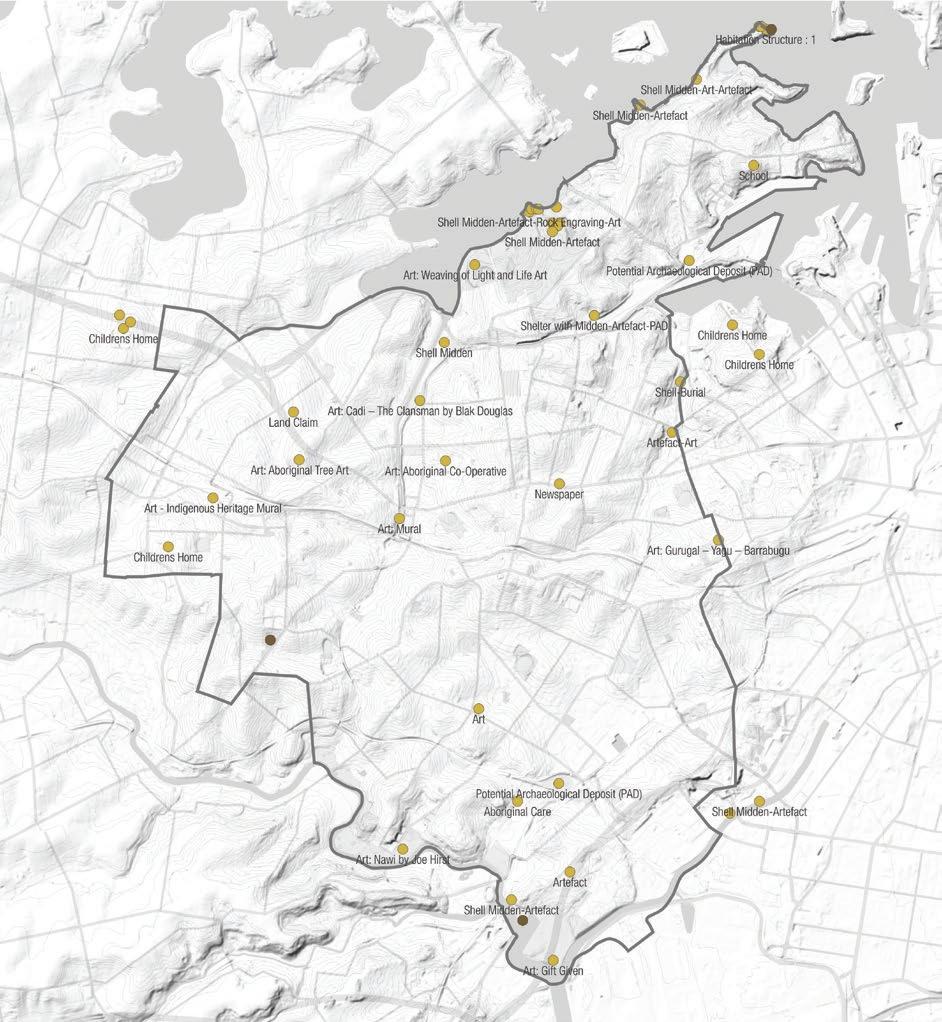
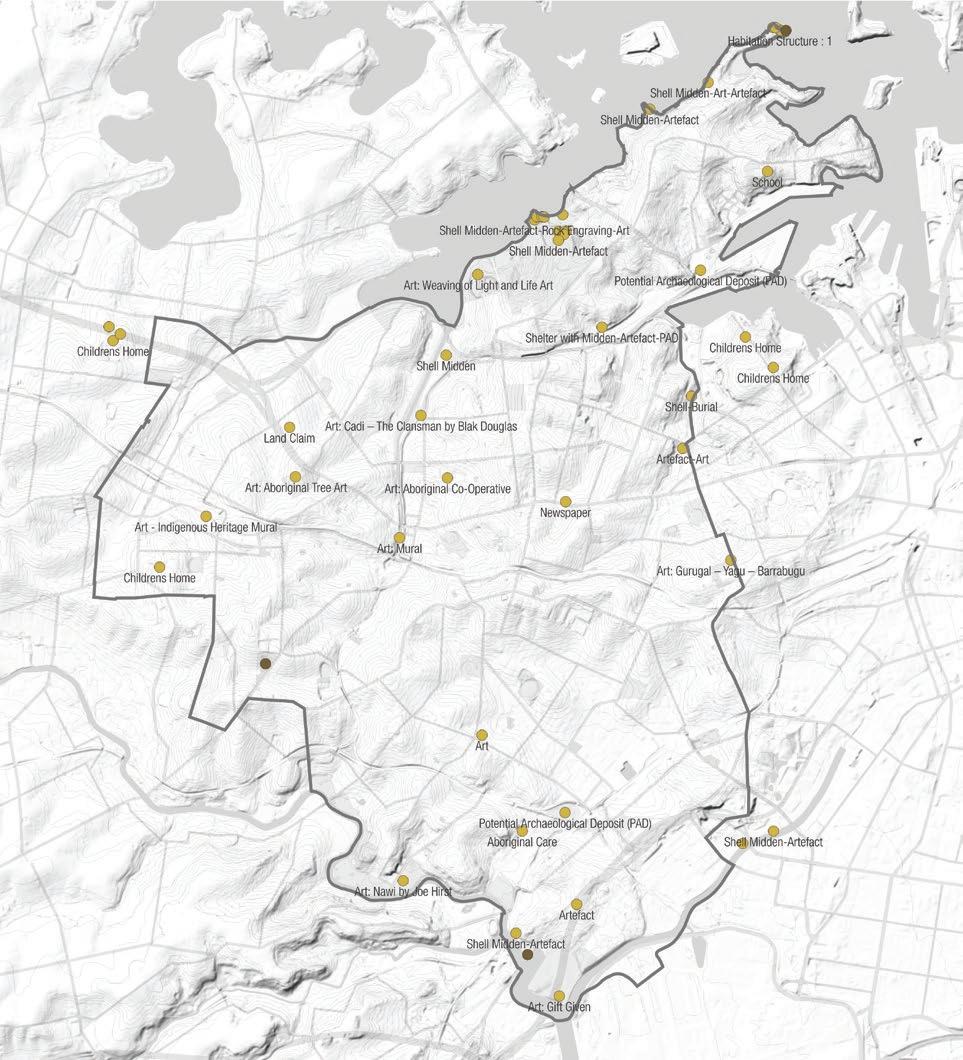
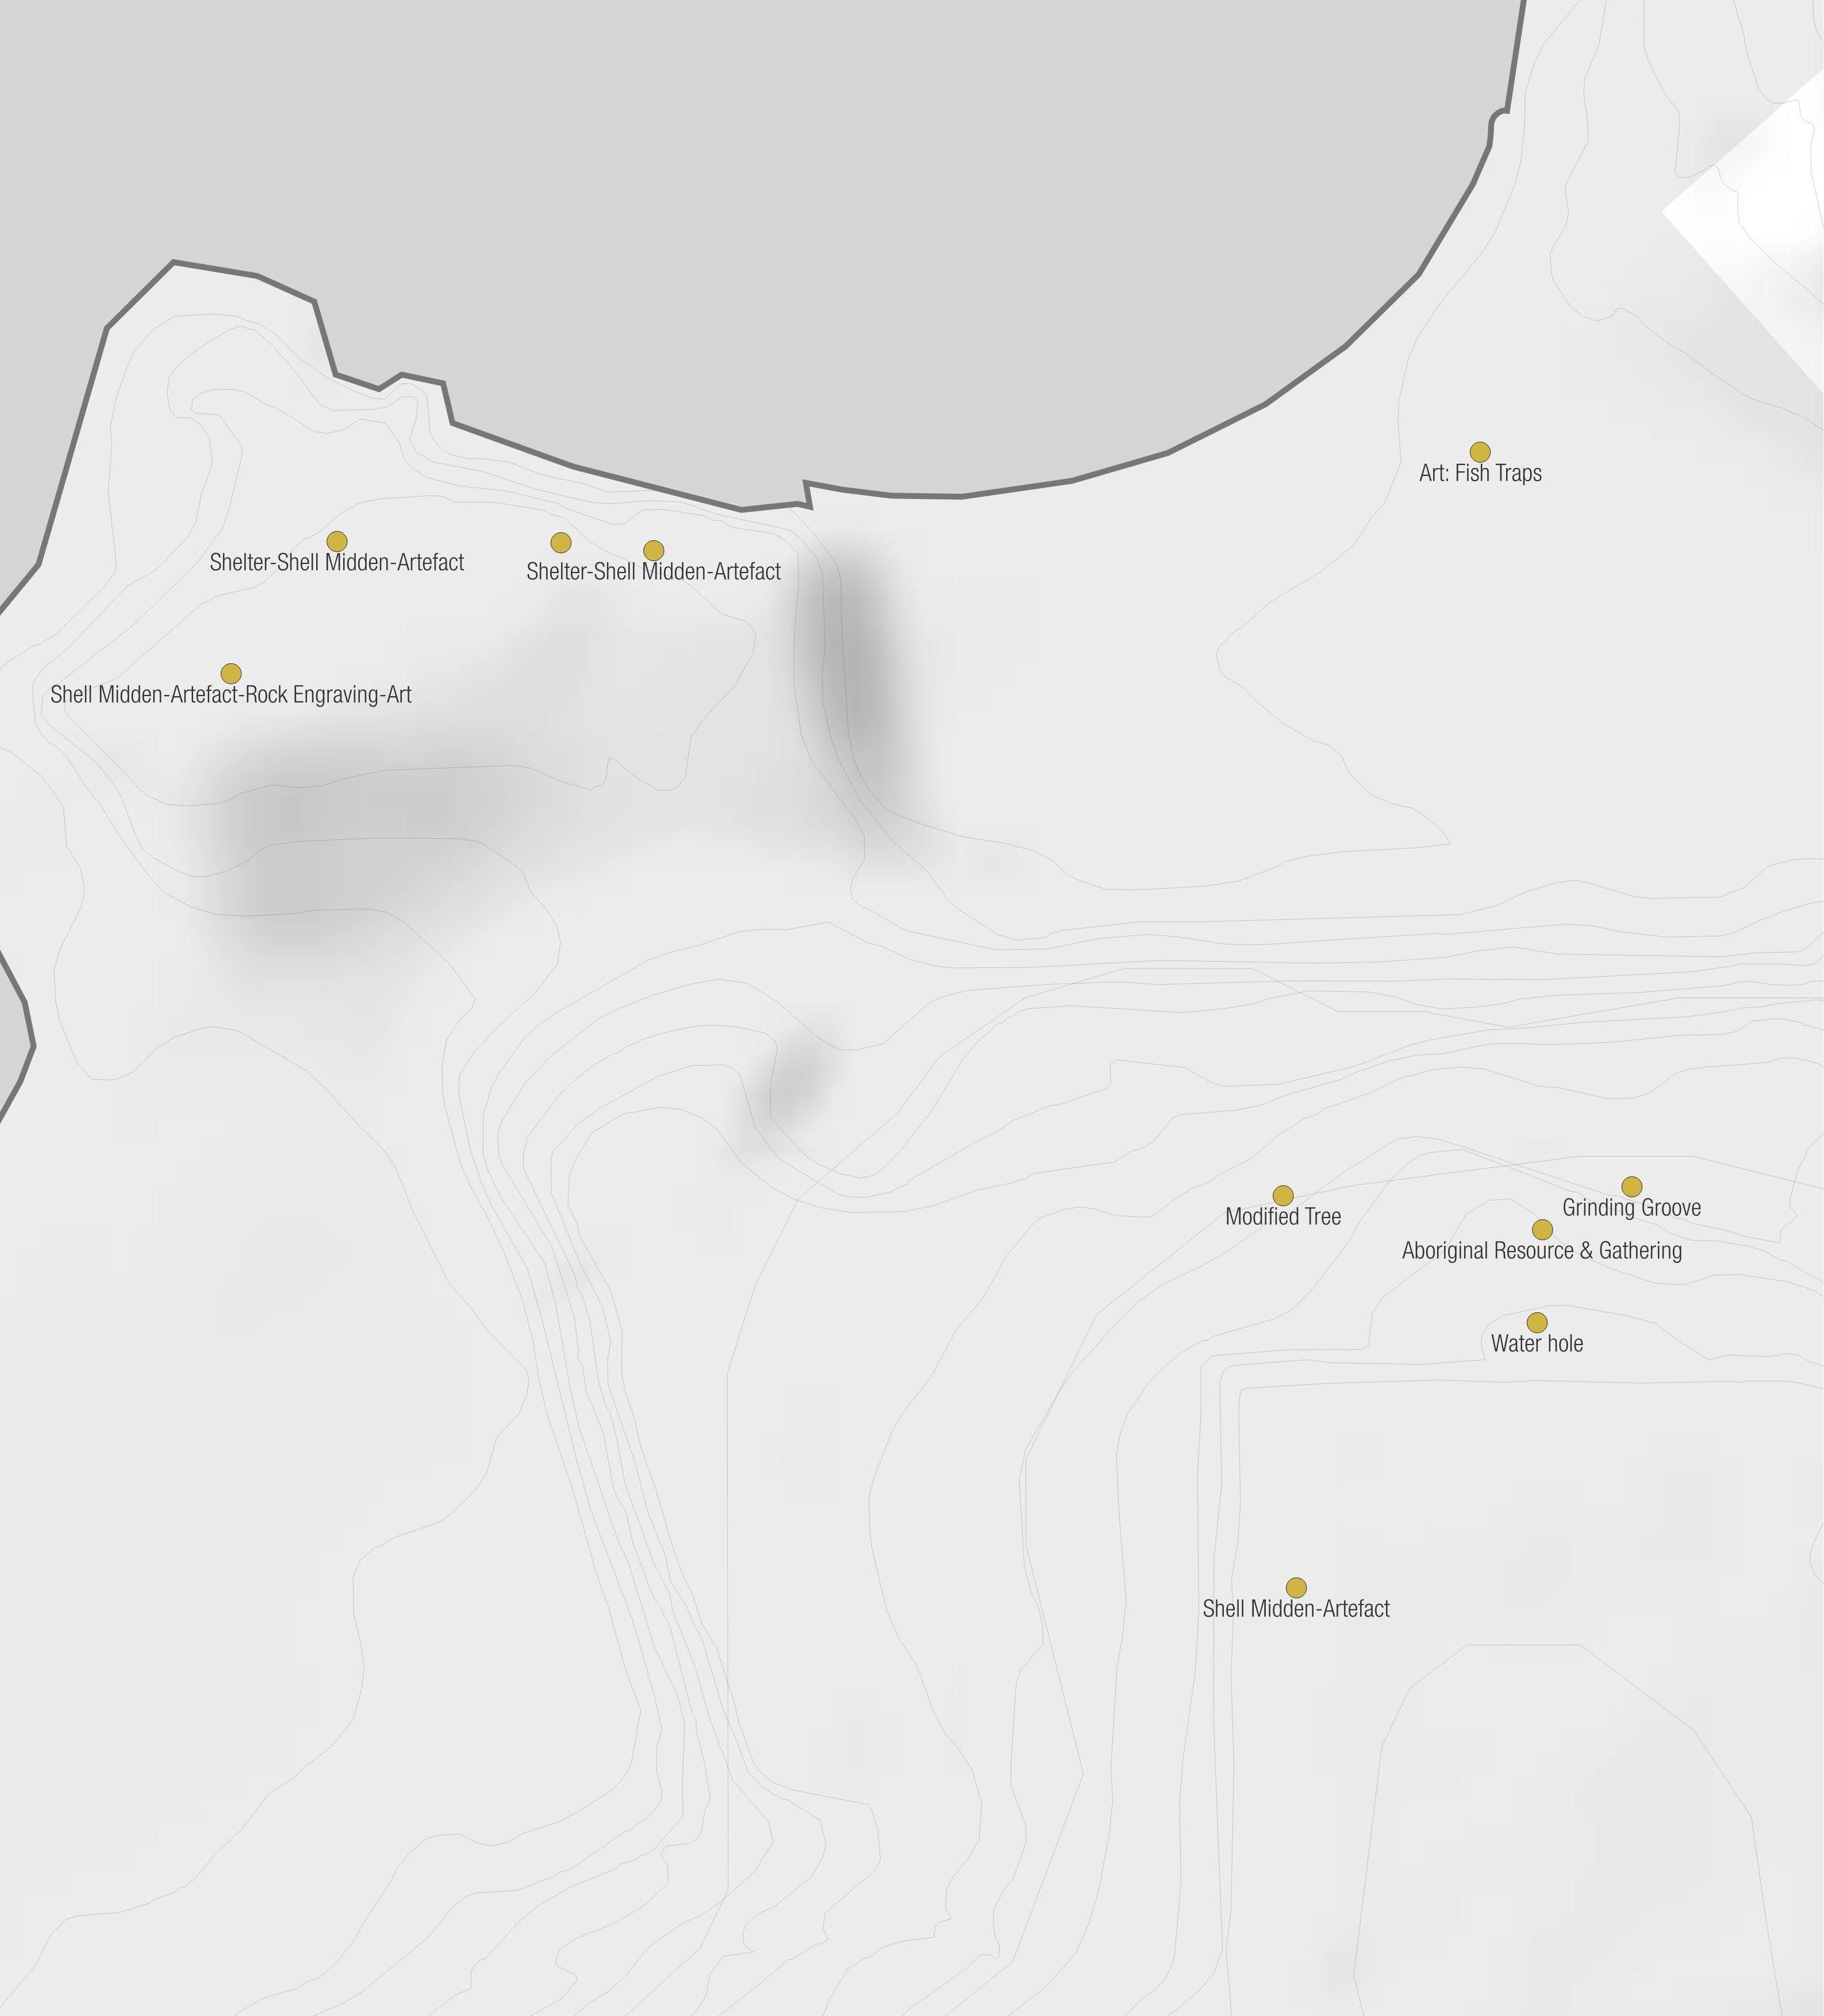
Zoom in area of the map
0 25 50m
Inner West Blue-Green Grid Strategy 2023 105
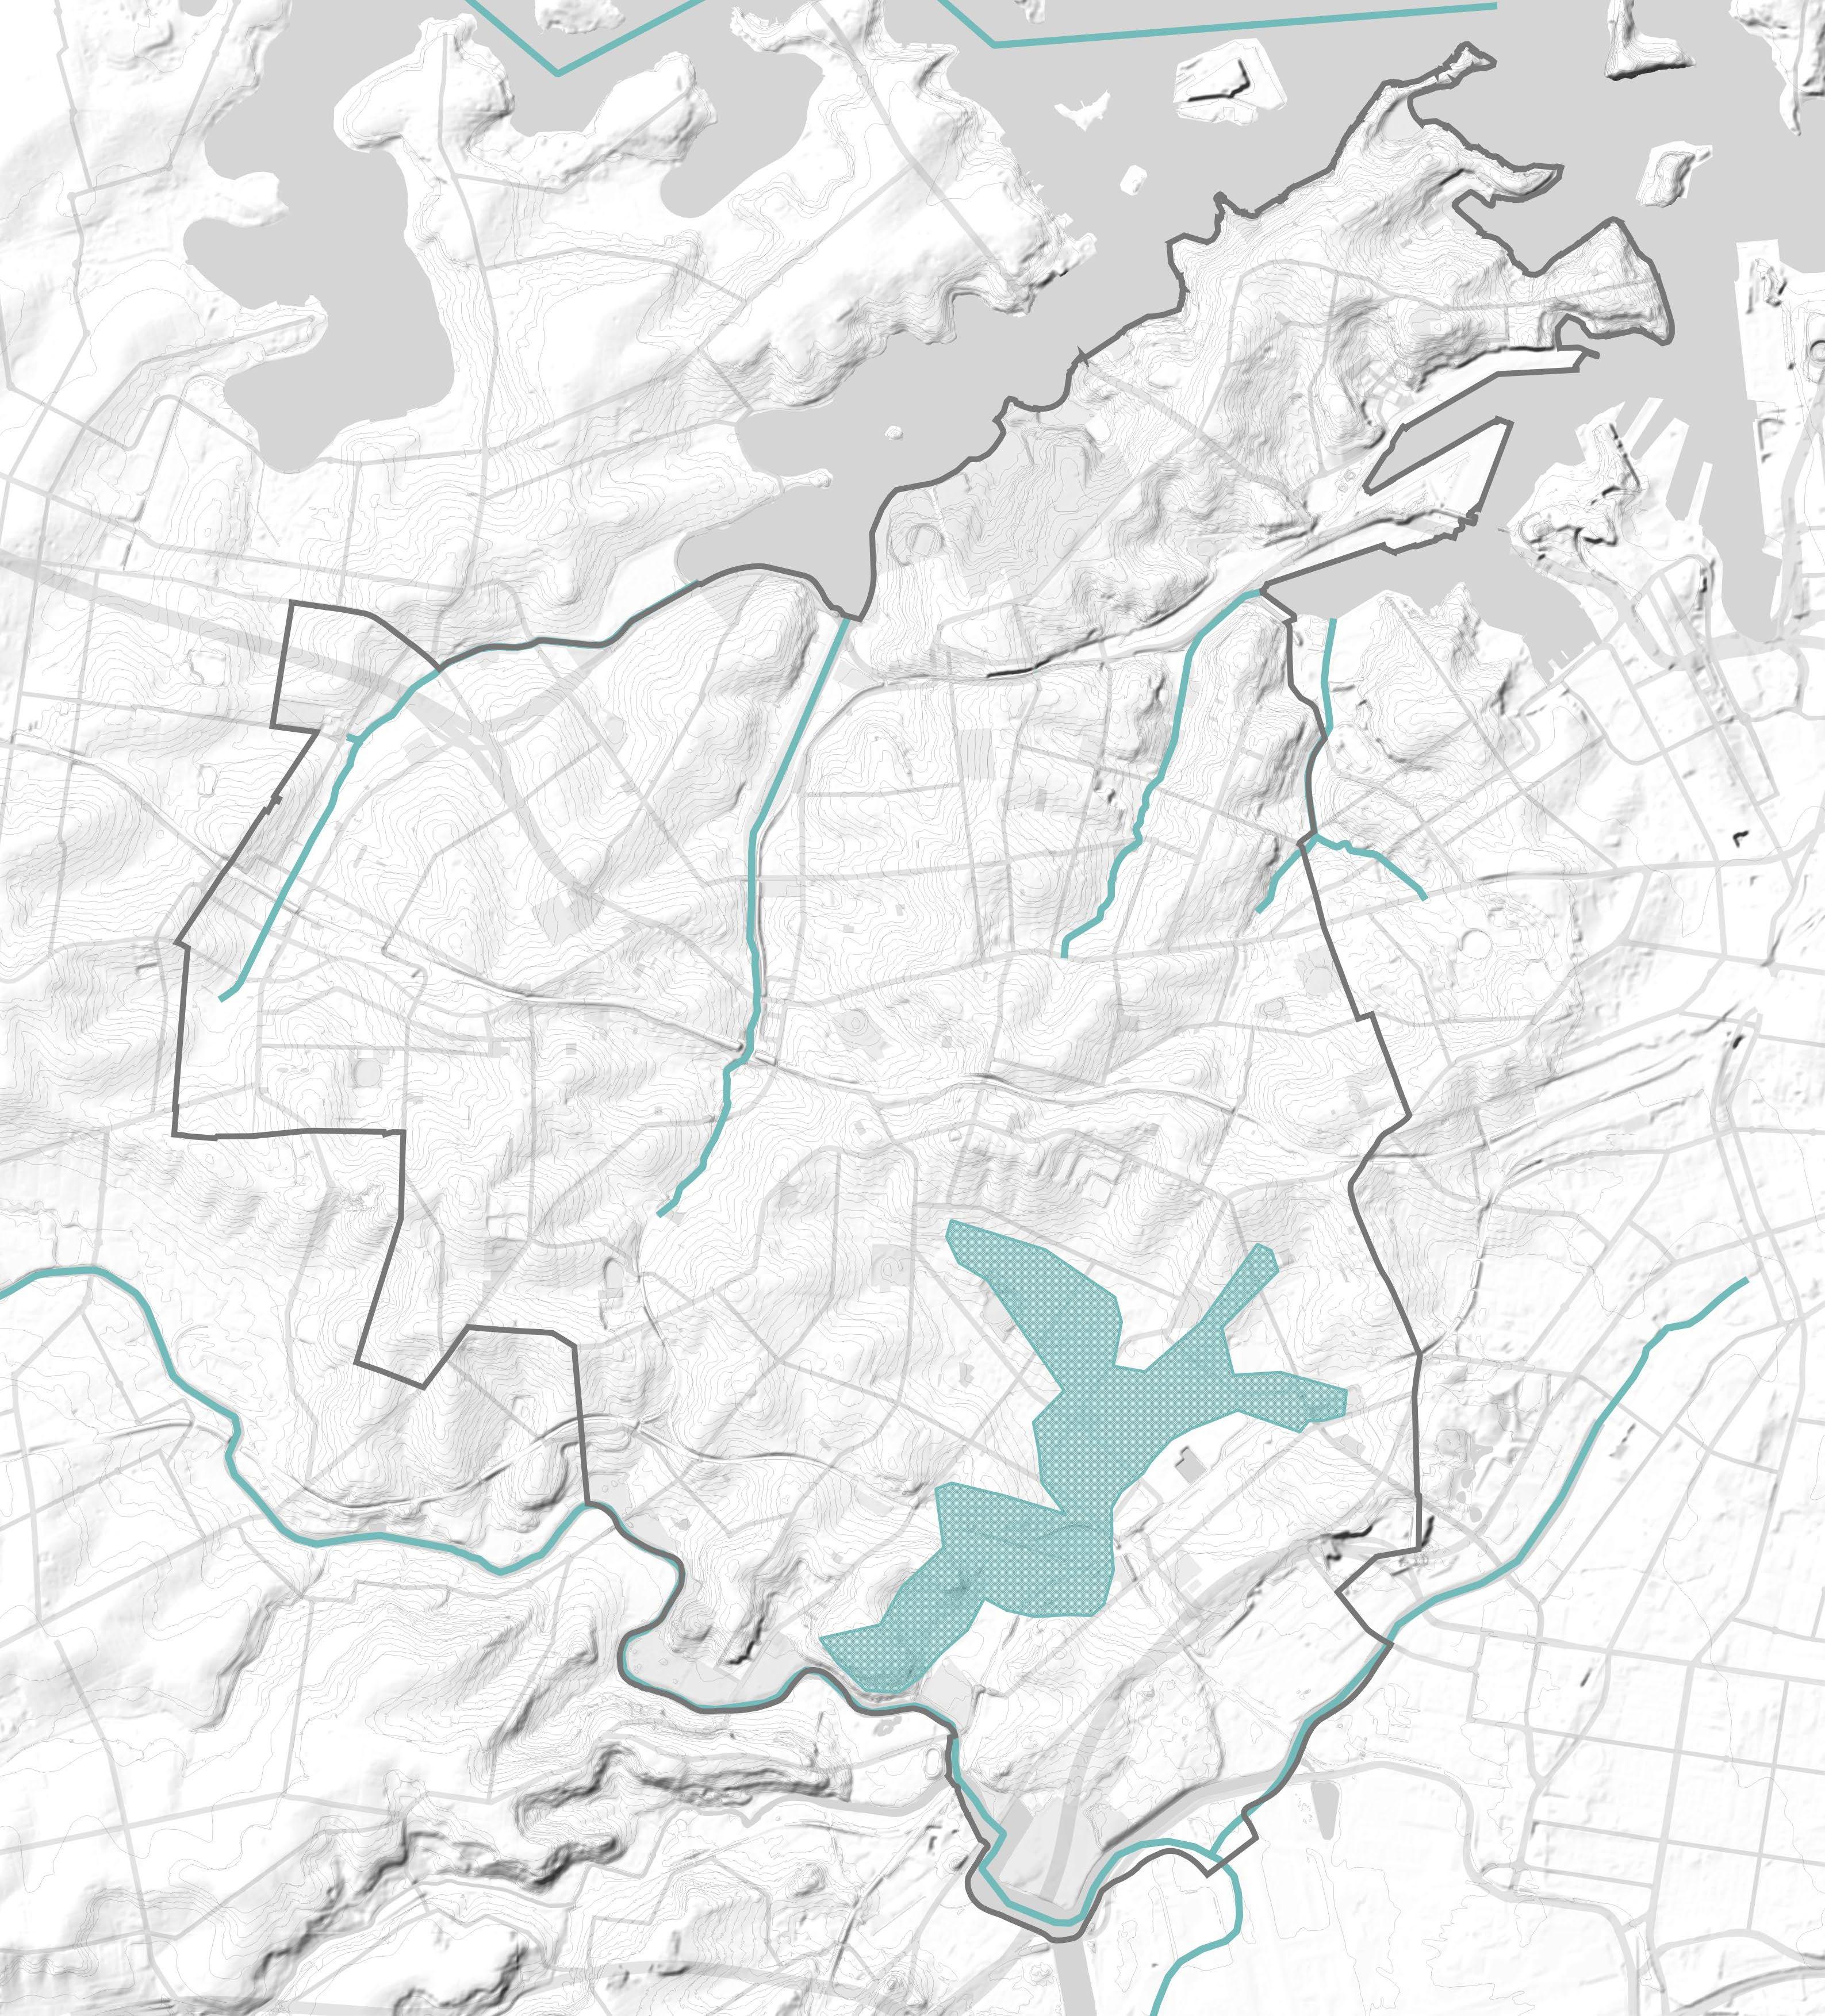
Mapping Layers
Indigenous Historical Hydrological Places
Understanding significant hydrology systems once used by the local Gadigal and Wangal peoples signals places to restore, protect and enhance.
Map source: Shapefile provided by Inner West Council.
Legend
Inner West LGA Boundary
Significant waterways
Gumbramorra Swamp
Mapping Layers
The ARSIACH Grid will be enhanced by going through and past significant art venues to expose locals to art and culture in the Inner West.
Map source: Shapefile provided by Inner West Council.
Art Venues Legend
Inner West LGA Boundary
Art Venues
Inner West Blue-Green Grid Strategy 2023 107
Mapping Layers
Heritage Indigenous Land Area
The ATSIACH Grid will acknowledge local indigenous land areas.
Map source: Shapefile provided by Inner West Council.
Legend
Inner West LGA Boundary
Kangaroo
Ground - Patyegarang
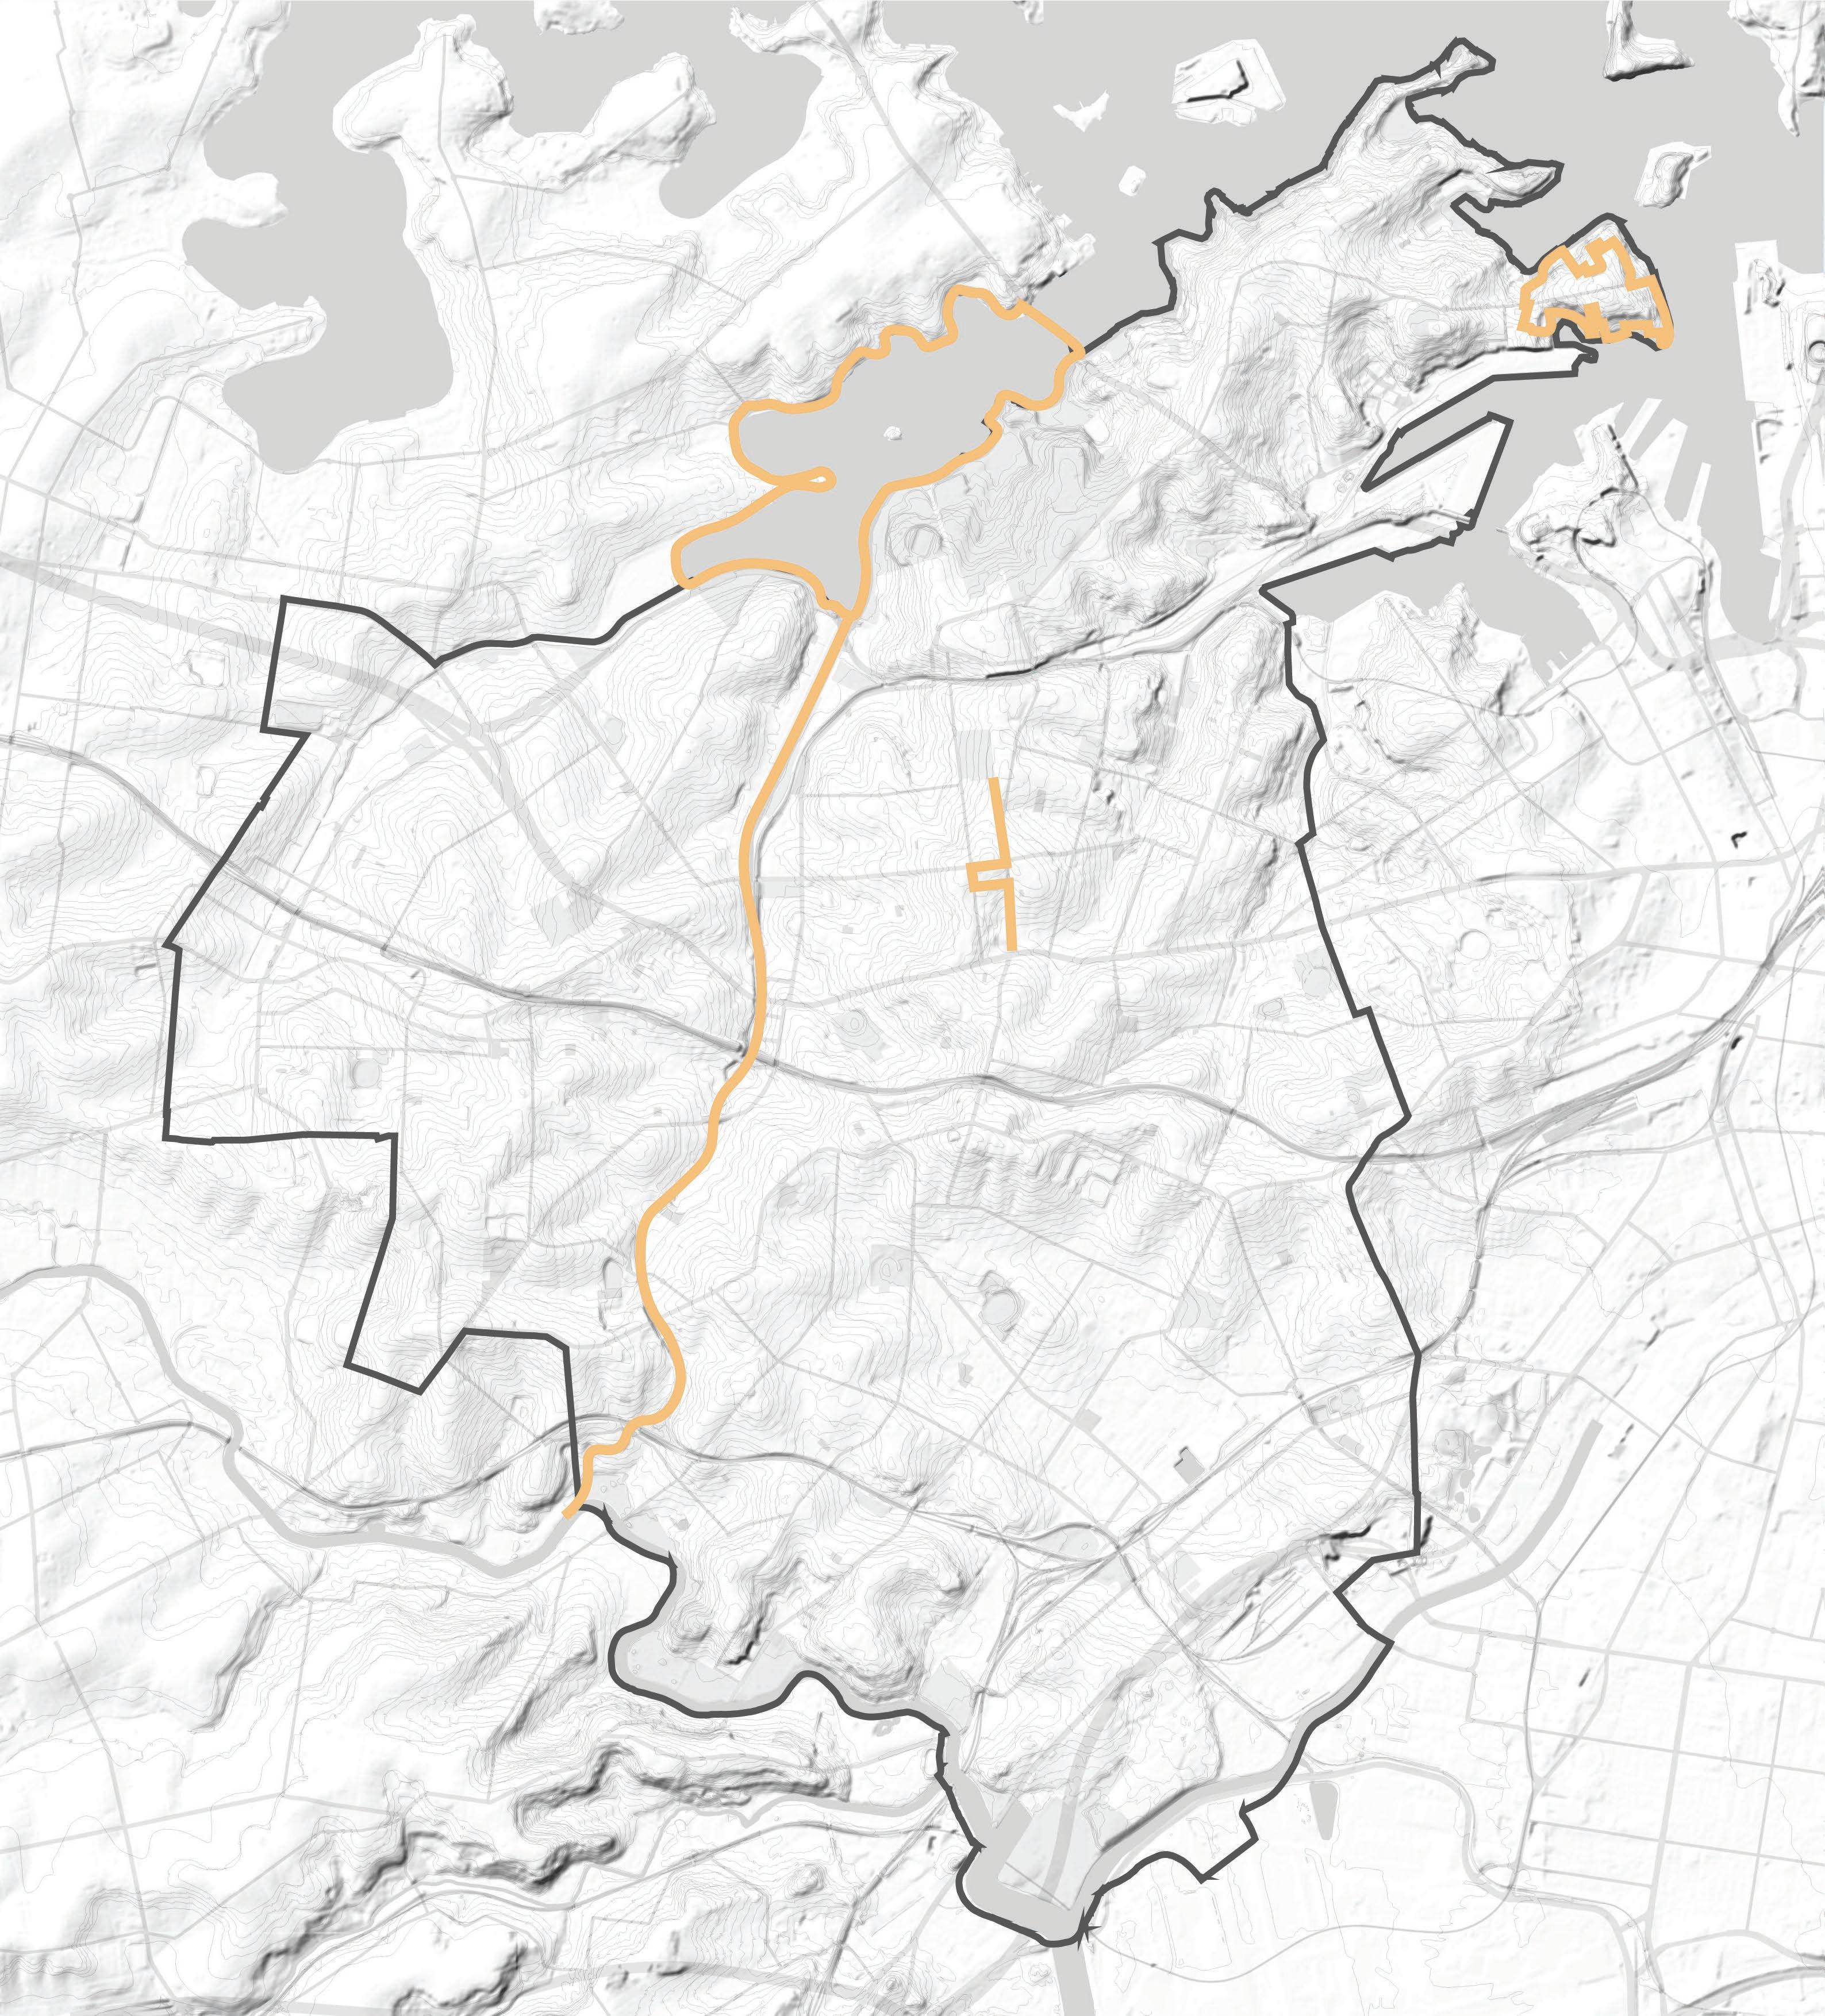
Mapping Layers
Tom Uren Trail
The Tom Uren Trail is an important route that connects significant places in the Inner West. It should be connected to the Blue-Green Grid as its historical and heritage significance.
Map source: https://www.innerwest.nsw.gov.au/explore/ libraries/community-history/our-history/self-guidedheritage-walks/tom-uren-trail
Legend
Inner West LGA Boundary
Tom Uren Trail
Inner West Blue-Green Grid Strategy 2023 109
Mapping Layers
Heritage
Key heritage areas can both contribute to the BlueGreen Grid and be protected by it.
The design can include strategies to celebrate heritage items through displaying and educating.
Map Source: Shapefile Provided by Inner West Council.

Legend
Inner West LGA Boundary
Conservation Area - General
Item - General
Item - Archaeological
Item- Landscape
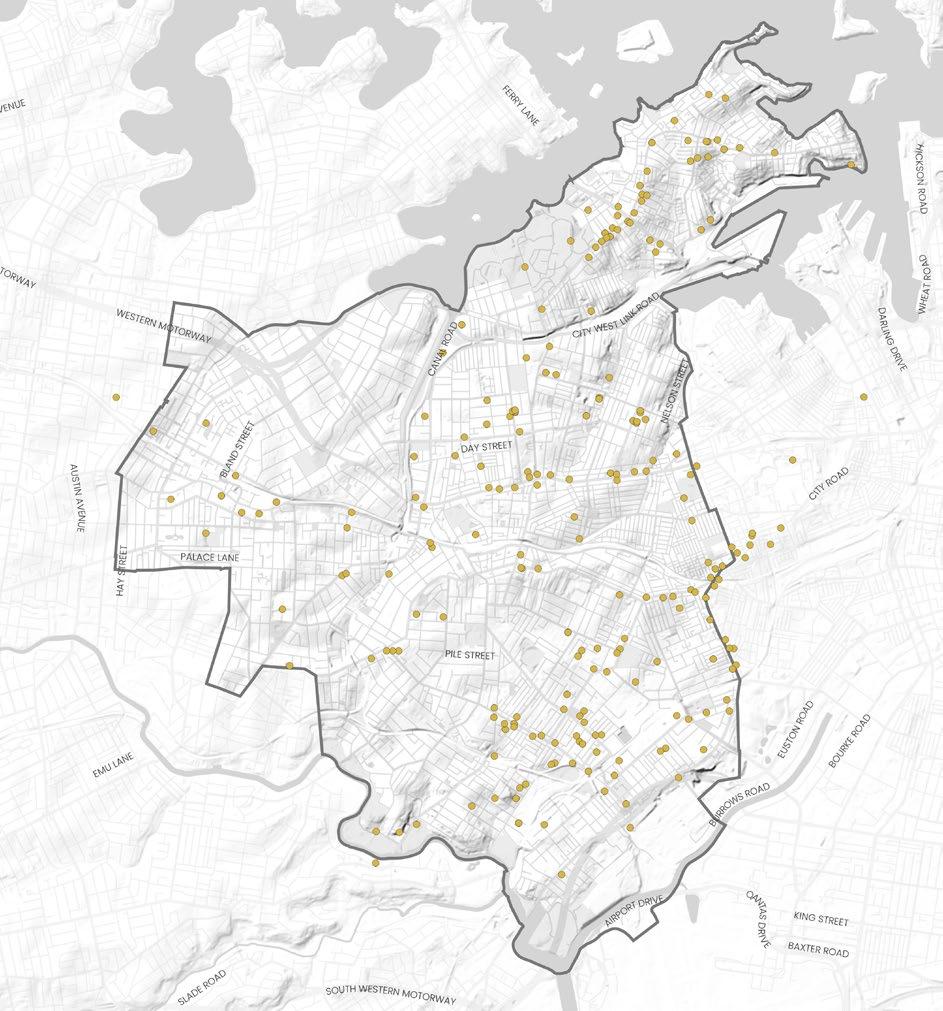
Mapping Layers
Public Art
The ARSIACH Grid will be enhanced by exposing pubic art along the Blue-Green Grid to enhance art and culture.
Map Source: Inner West Council.
Legend
Identified Public Art
Inner West Blue-Green Grid Strategy 2023 111
Mapping Layers
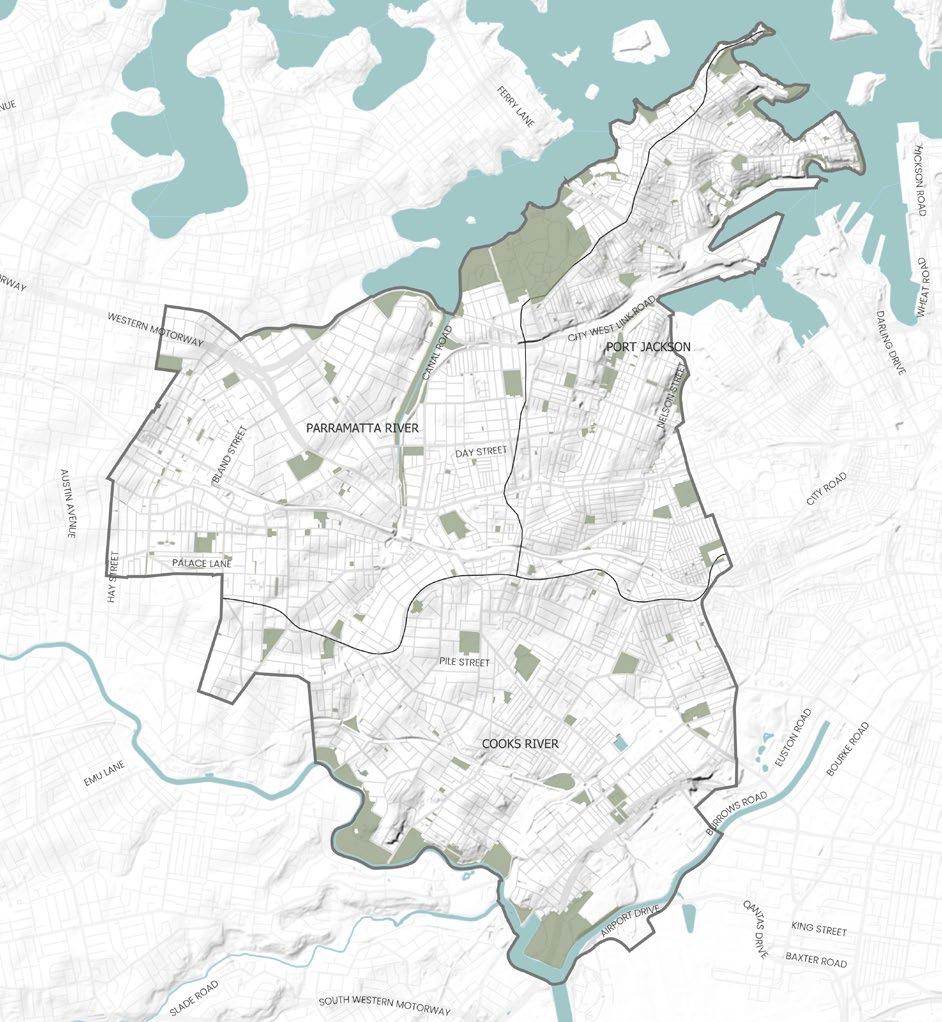
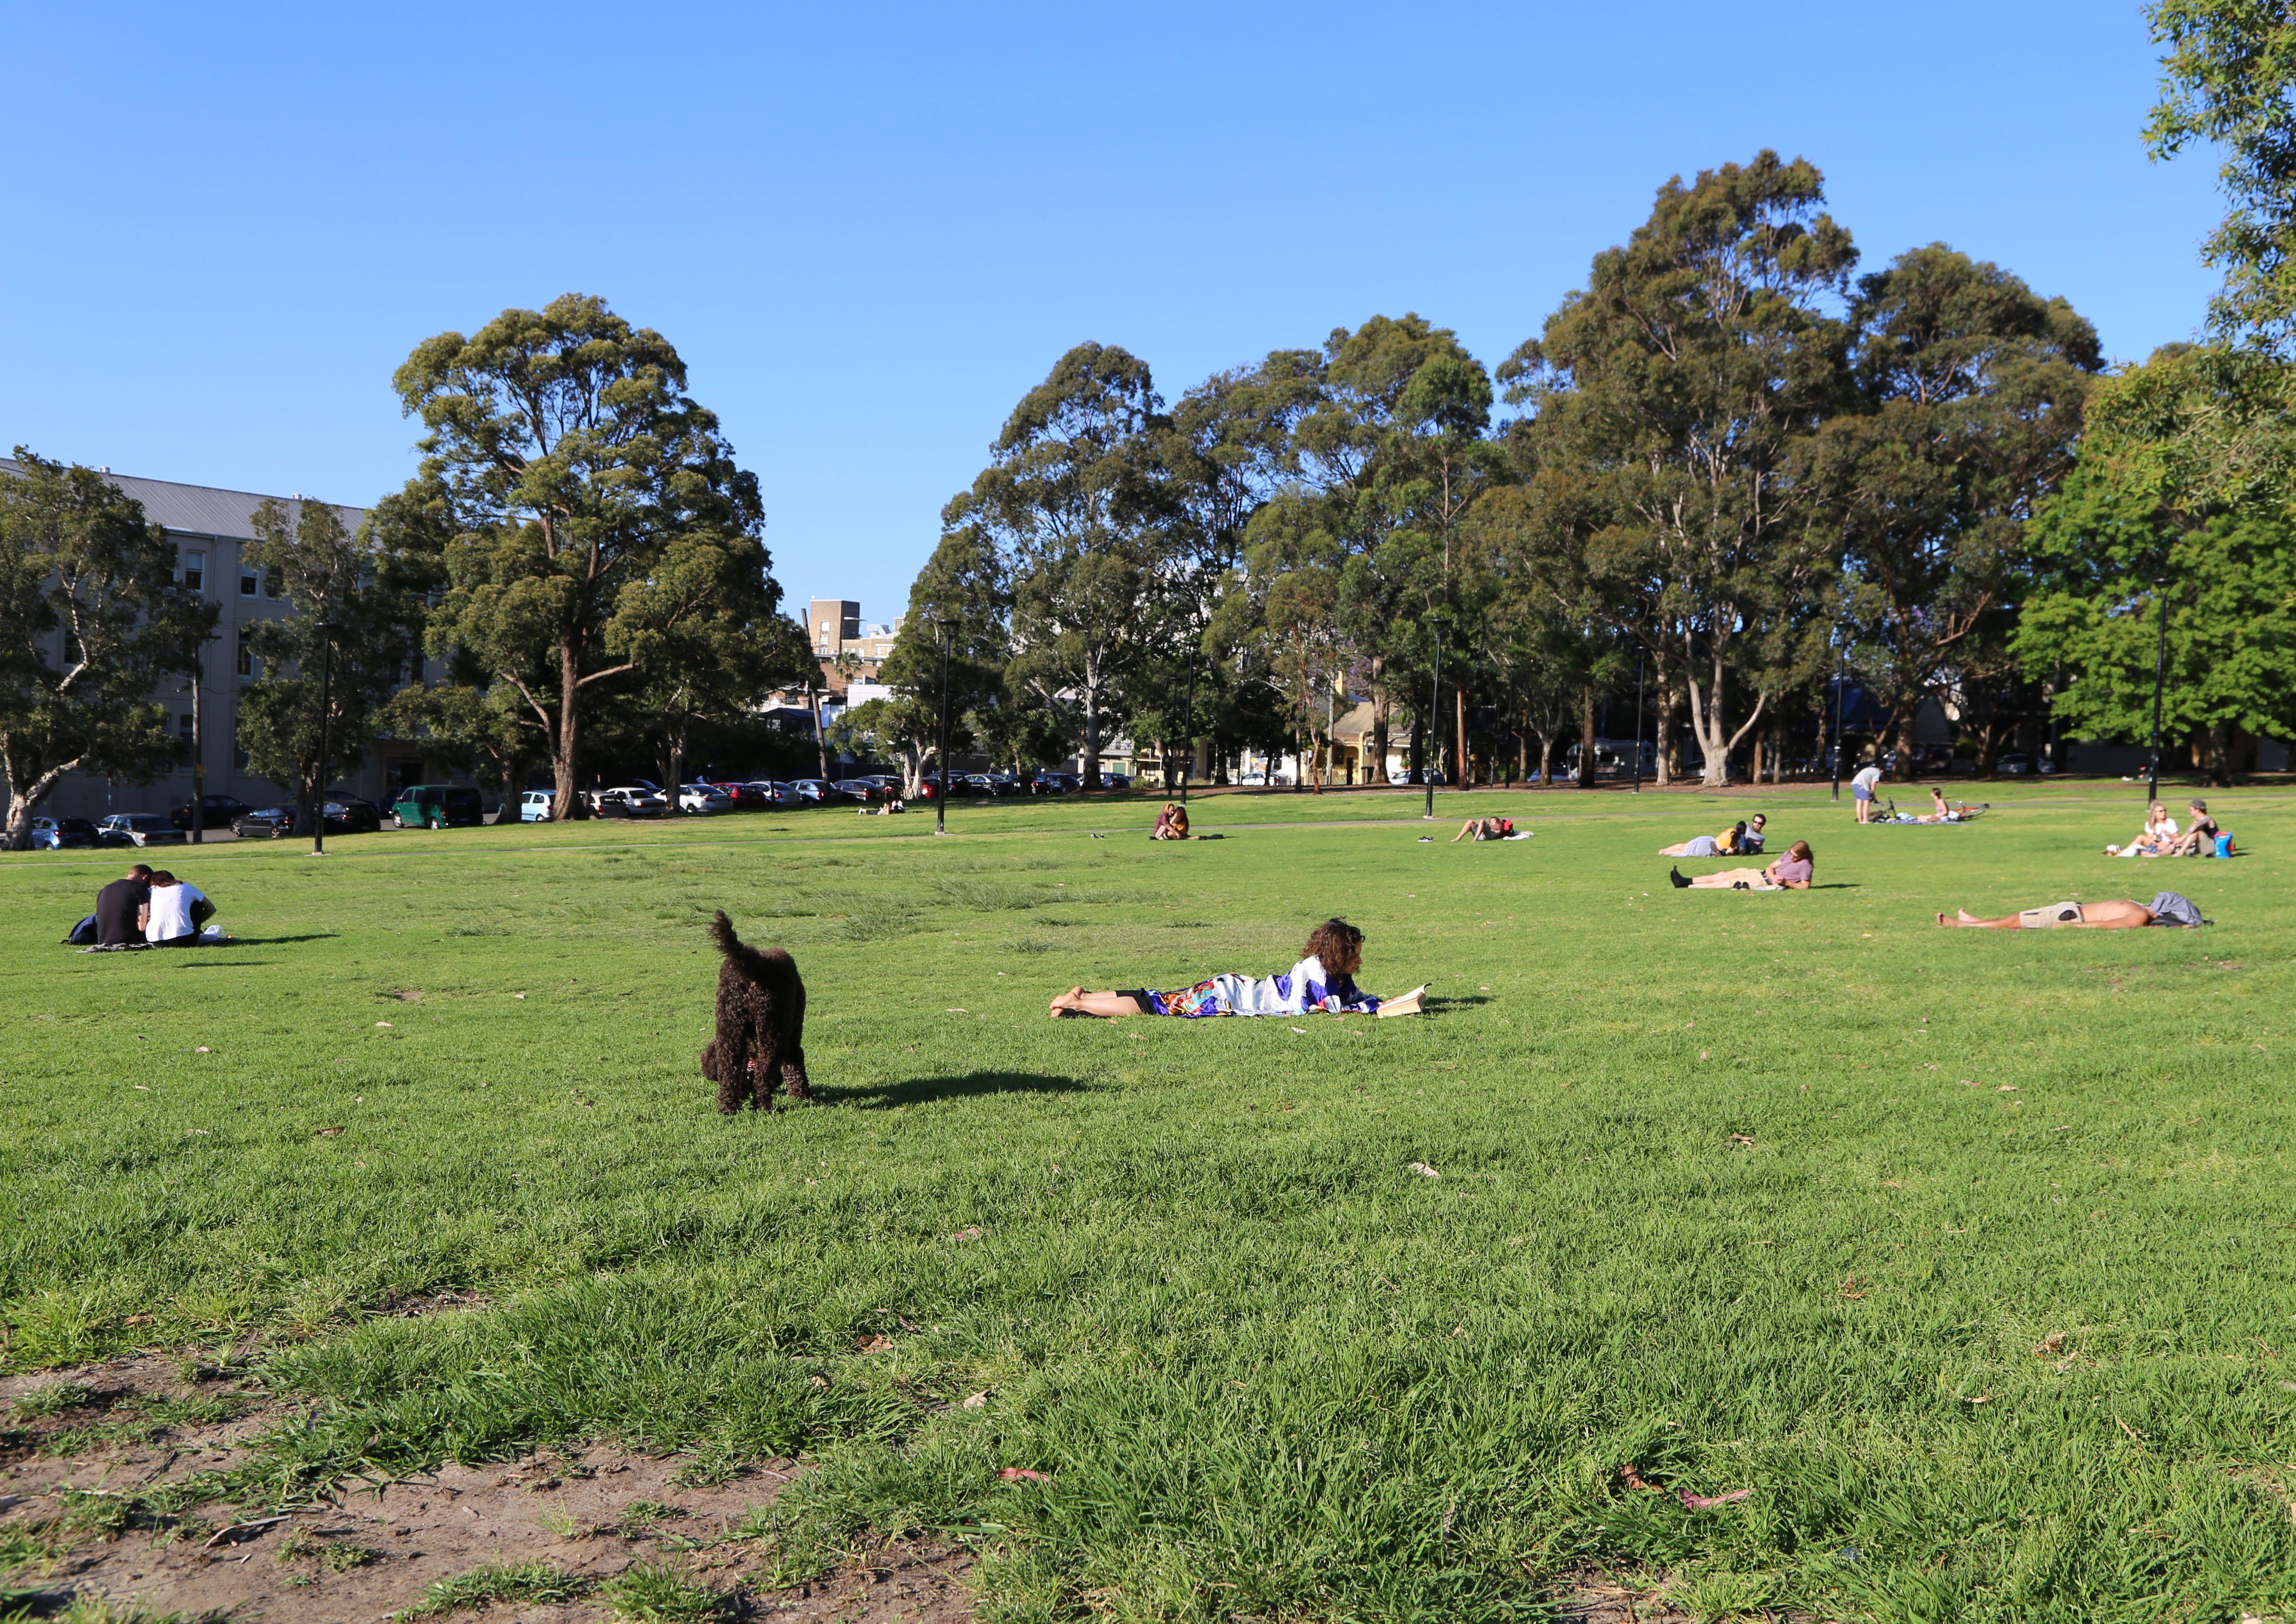
Open Spaces Network
The Blue-Green Grid will link parks and open spaces to provide loops and routes for people to follow, enhancing access to a diversity of recreational open spaces.
Legend
Inner West LGA Boundary
Regional Parks (5ha+)
District Park (2ha to 5ha)
Level 1 Local Parks (0.5ha to 2 ha)
Level 2 Local Parks (0.1ha to 0.5ha)
Pocket Parks (less than 0.1ha)
Map source: Recreational Needs Study, Inner West Council.
Mapping Layers
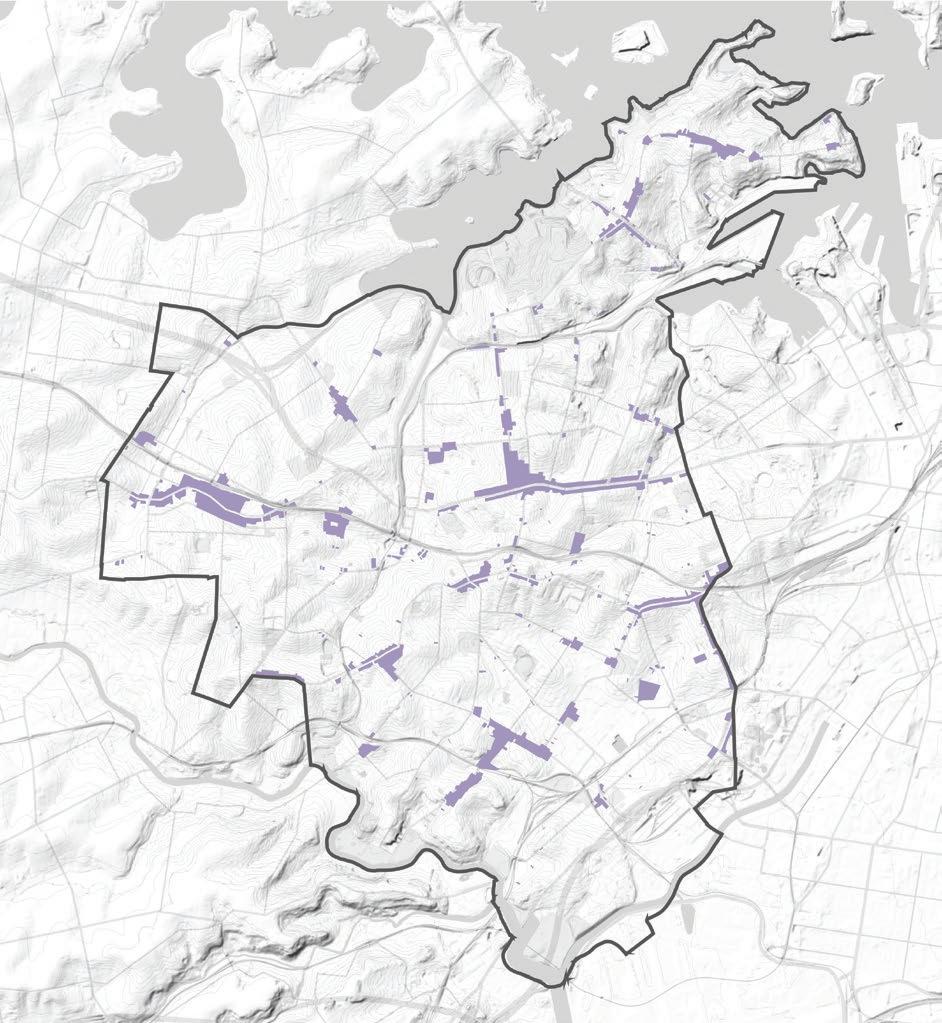
Activity Centres
Key town centres and schools are natural anchors for neighbourhoods. They represent areas of high movement and recreation activities, and should comprise part of the Blue-Green Grid as places that require good accessibility and public amenity.
Map source: Inner West Council.
Inner West Blue-Green Grid Strategy 2023 113
Inner West LGA Boundary Schools
Town Centres
Legend
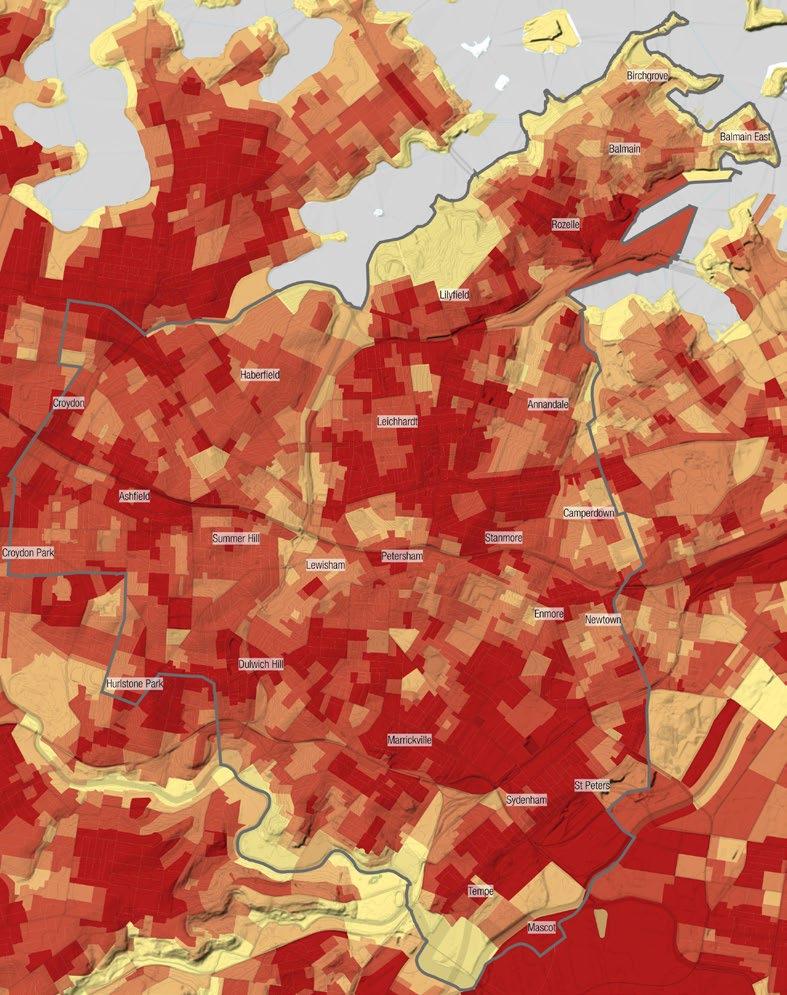
Mapping Layers
Population Density
High density areas would be prioritised, reflecting areas to have the largest amount of people to benefit from the Blue-Green Grid.
Map source: https://atlas.id.com.au/inner-west/maps/ population-density
Legend
Inner West LGA Boundary
0 people
5.43 to 4766.66 people
4766.67 to 7569.96 people
7569.97 to 11457.72 people
11457.73 to 21863.34 people
21863.35 to 41765.70 people
Mapping Layers
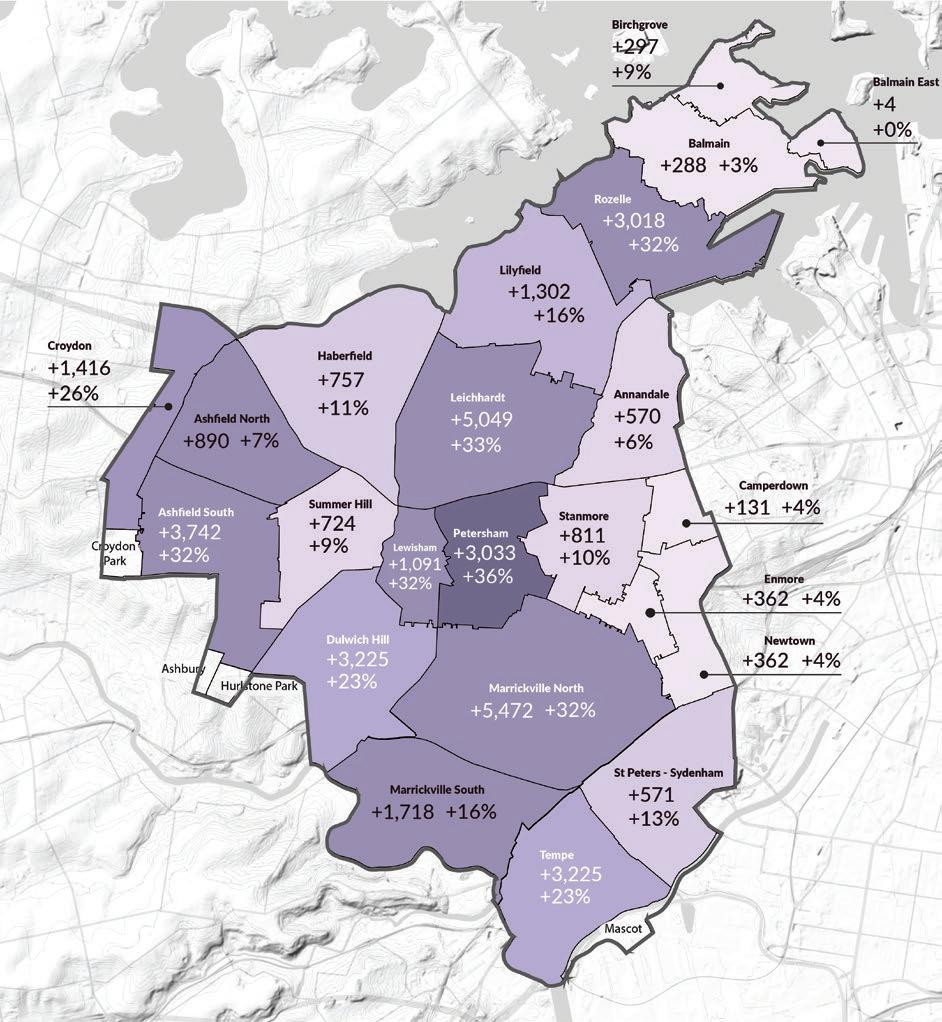
Projected Population
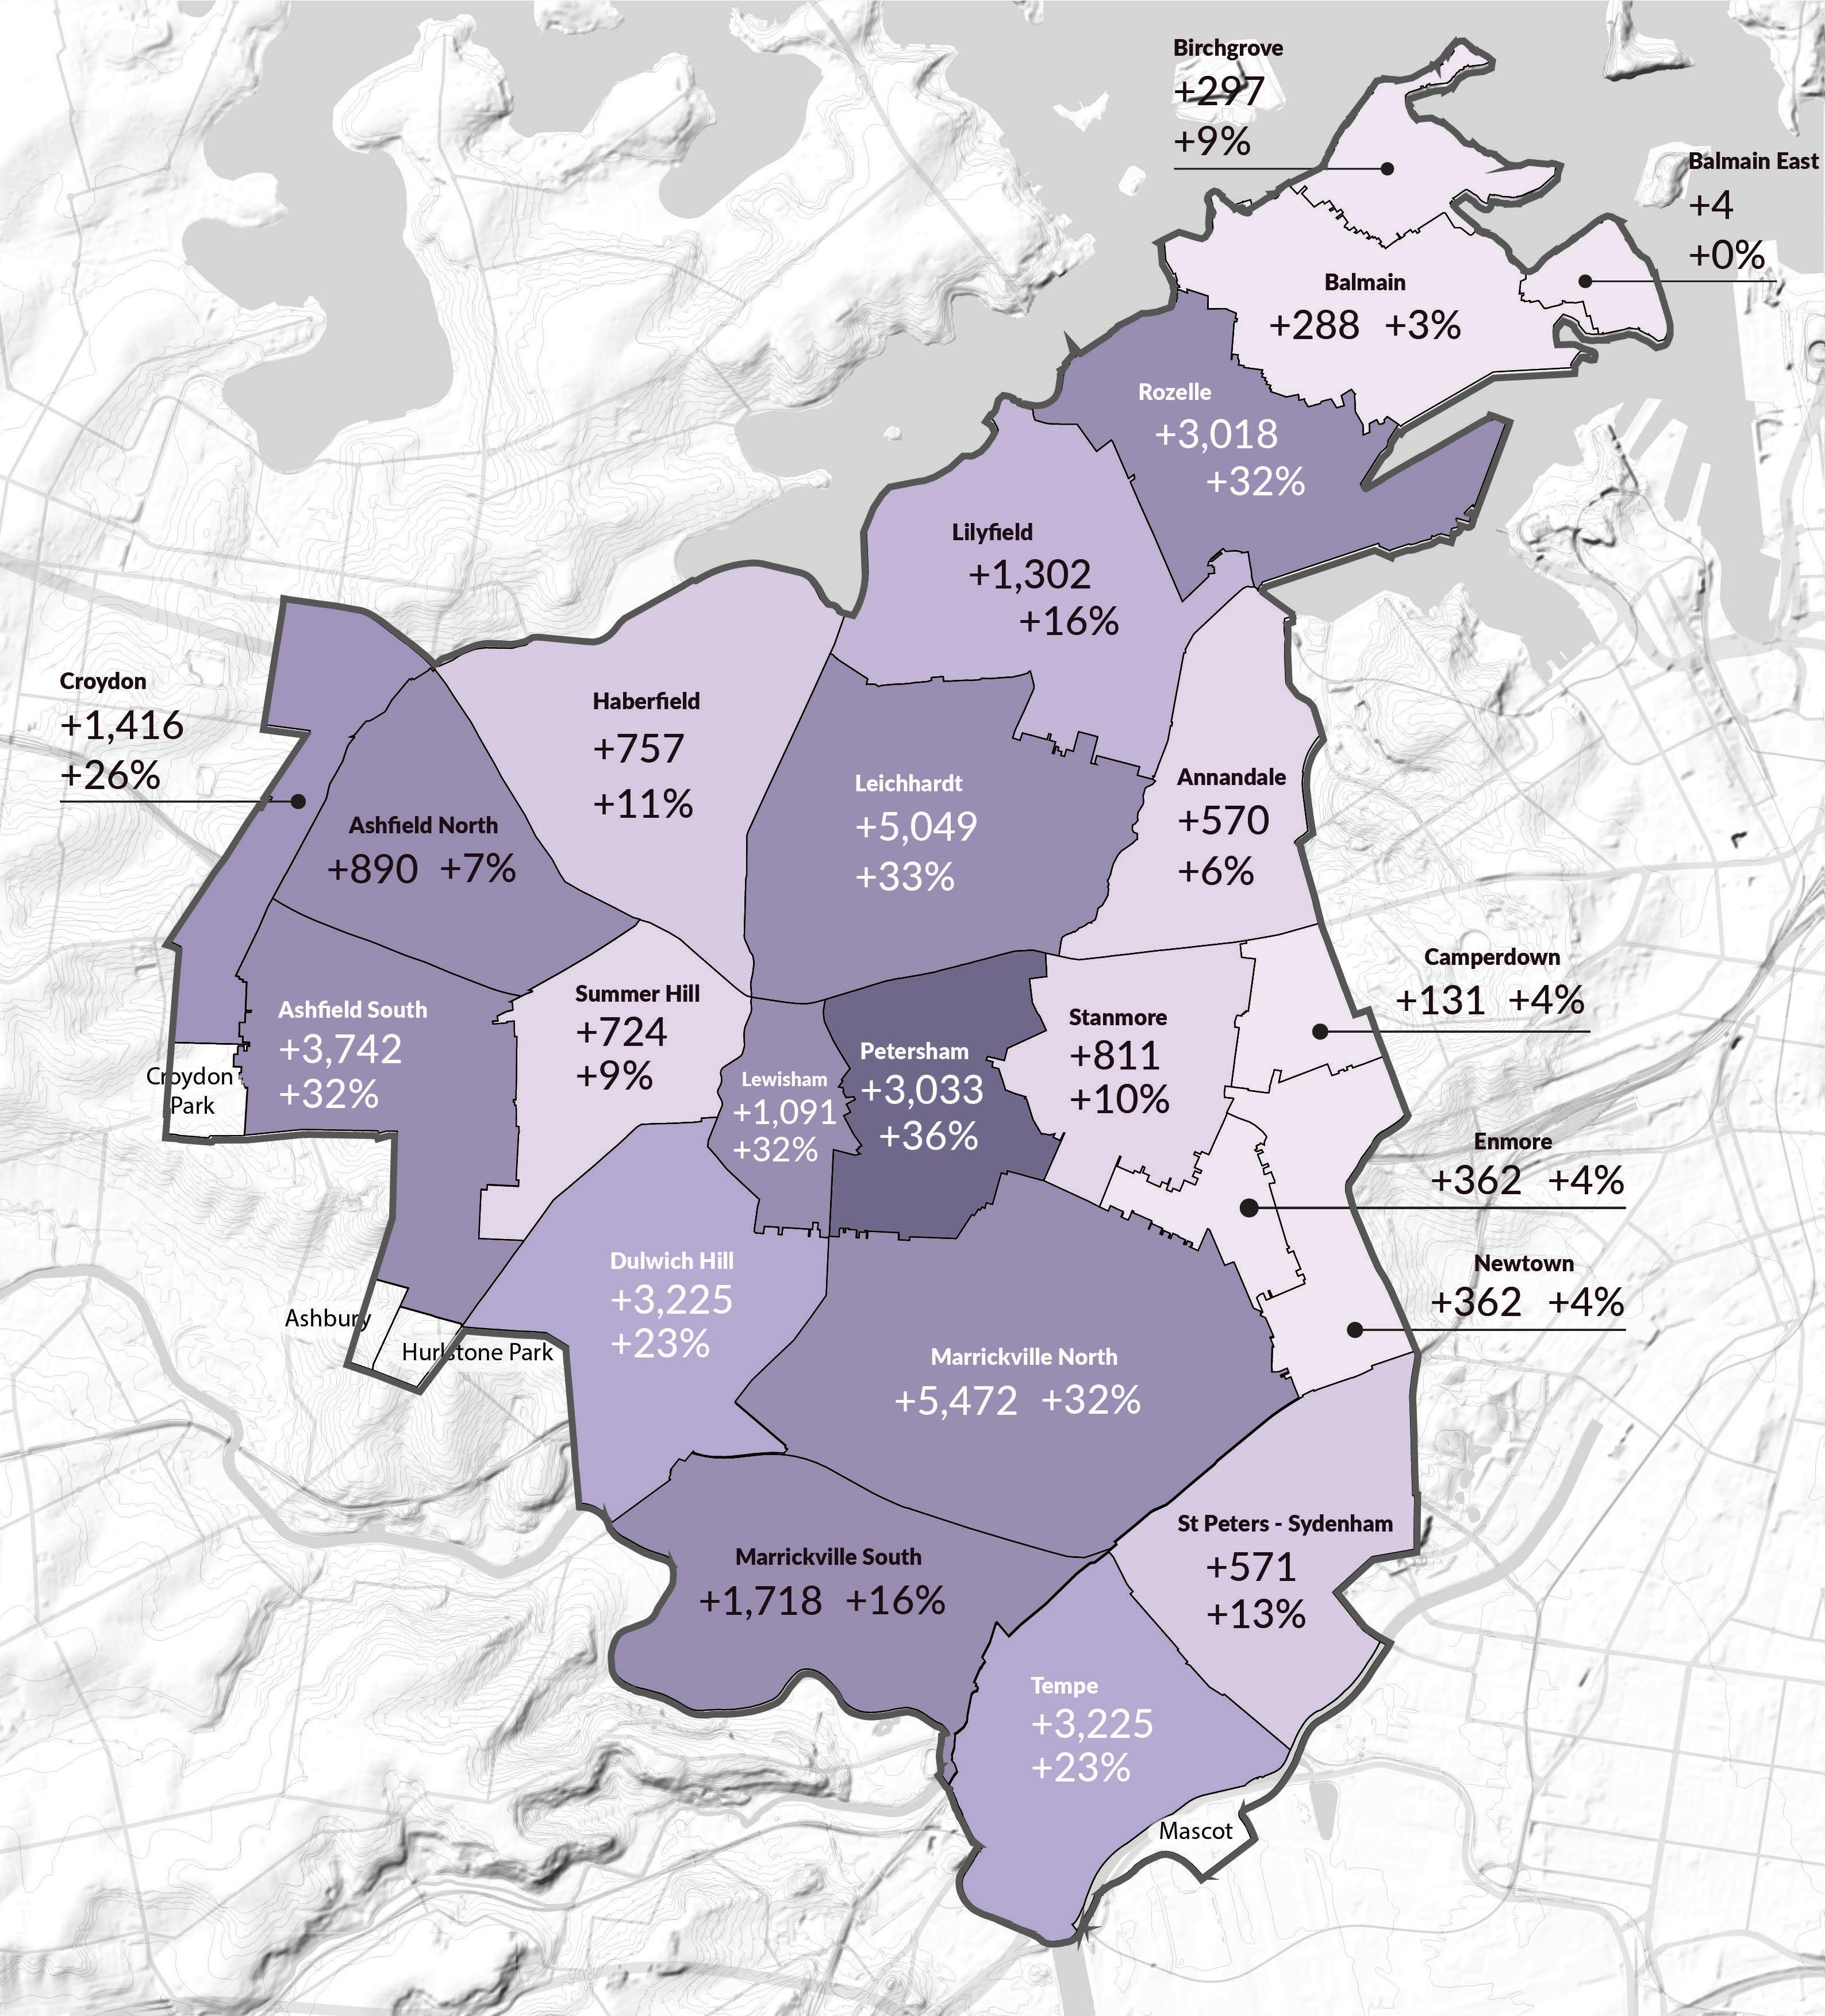
High density areas would be prioritised, reflecting areas to have the largest amount of people to benefit from the Blue-Green Grid.
Map source: Inner West Council
Inner West Blue-Green Grid Strategy 2023 115
Legend
Inner West LGA Boundary 35-40% 30-35% 25-30% 20-25% 15-20% 10-15% 5-10% 0-5%
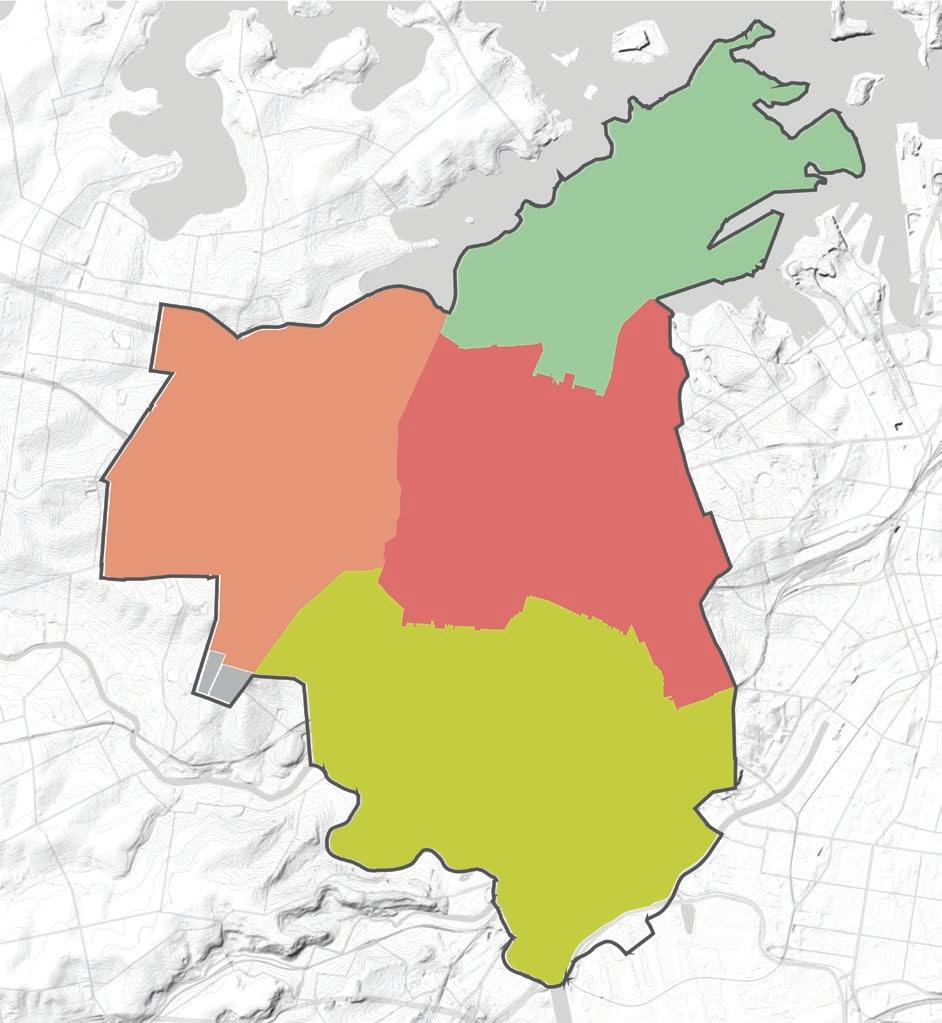
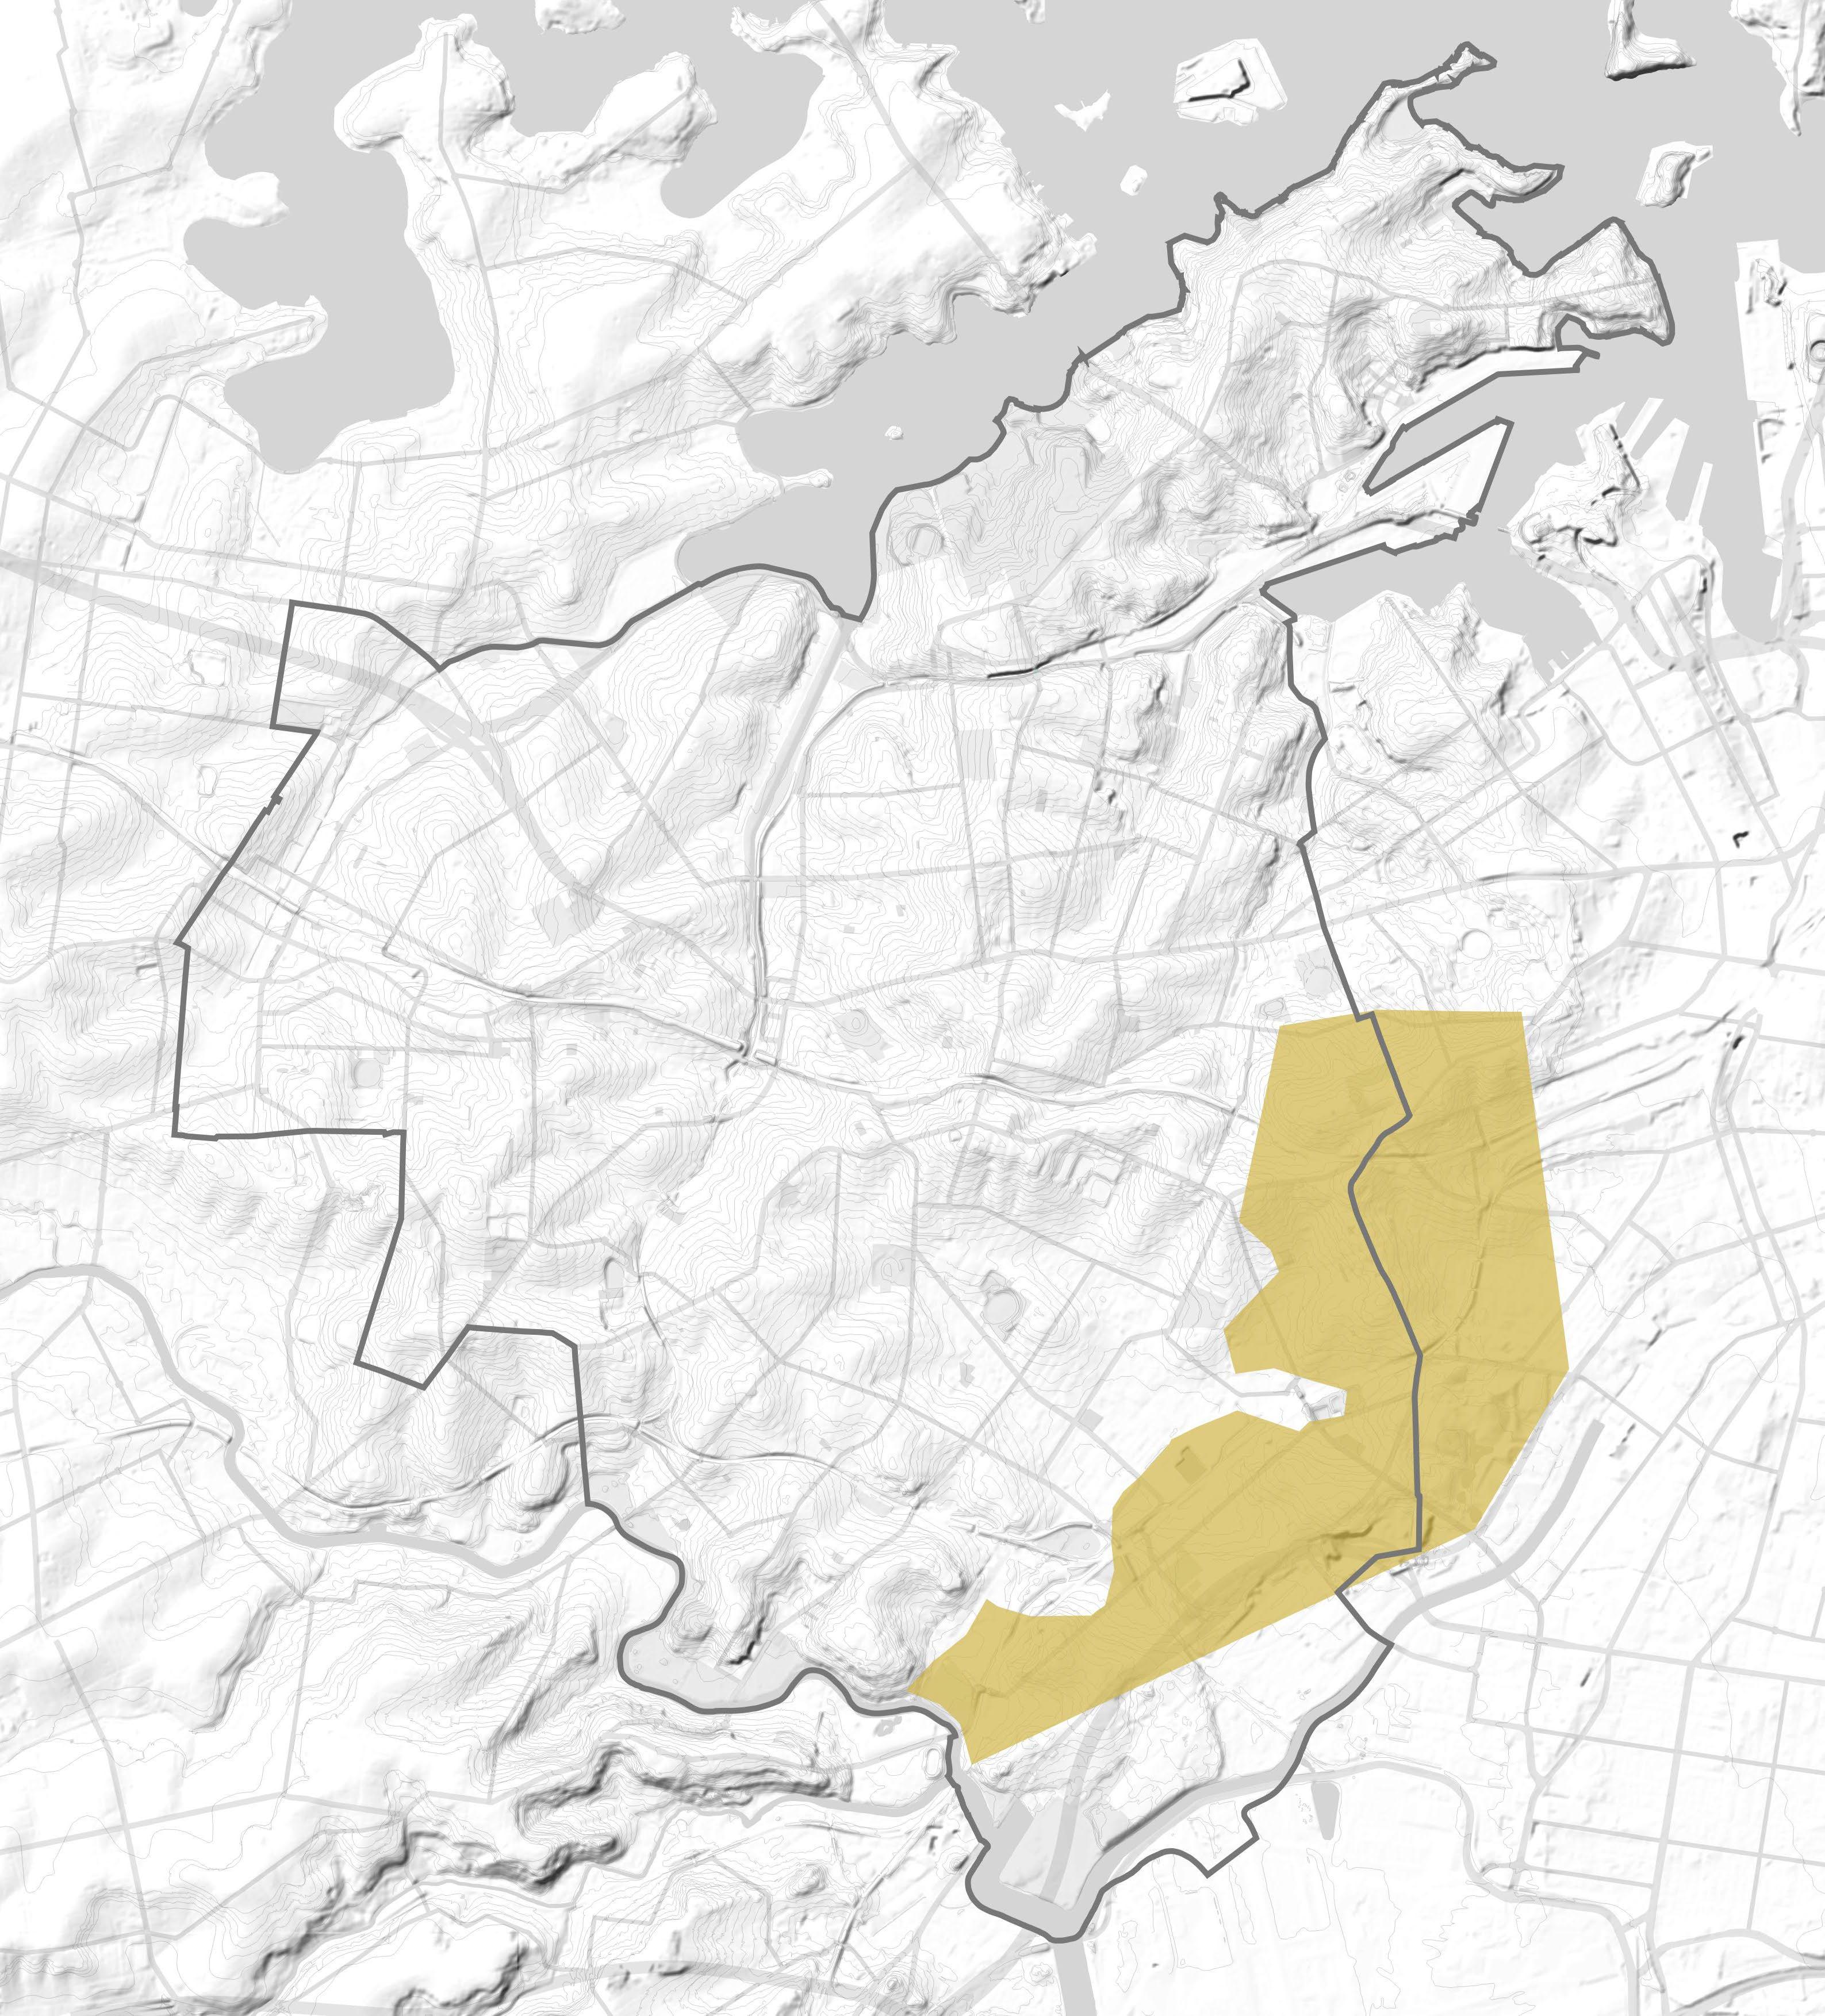
Mapping Layers Provision of Open Space
The map indicates provision of green open space per person. The map shows a decline in open space per person, indicating a loss of open space and a rise in population. The East and West catchments are of particular concern, with a particularly low amount of open space available per person. The Blue-Green Grid can contribute to recreational needs within areas that lack open space and better connect people to the open space that does exist to them.
Map source: Recreational Needs Study, Inner West Council.
Legend
Inner West LGA Boundary
Catchment 1 - North
Catchment 2 - West
Catchment 3 - East
Catchment 4 - South
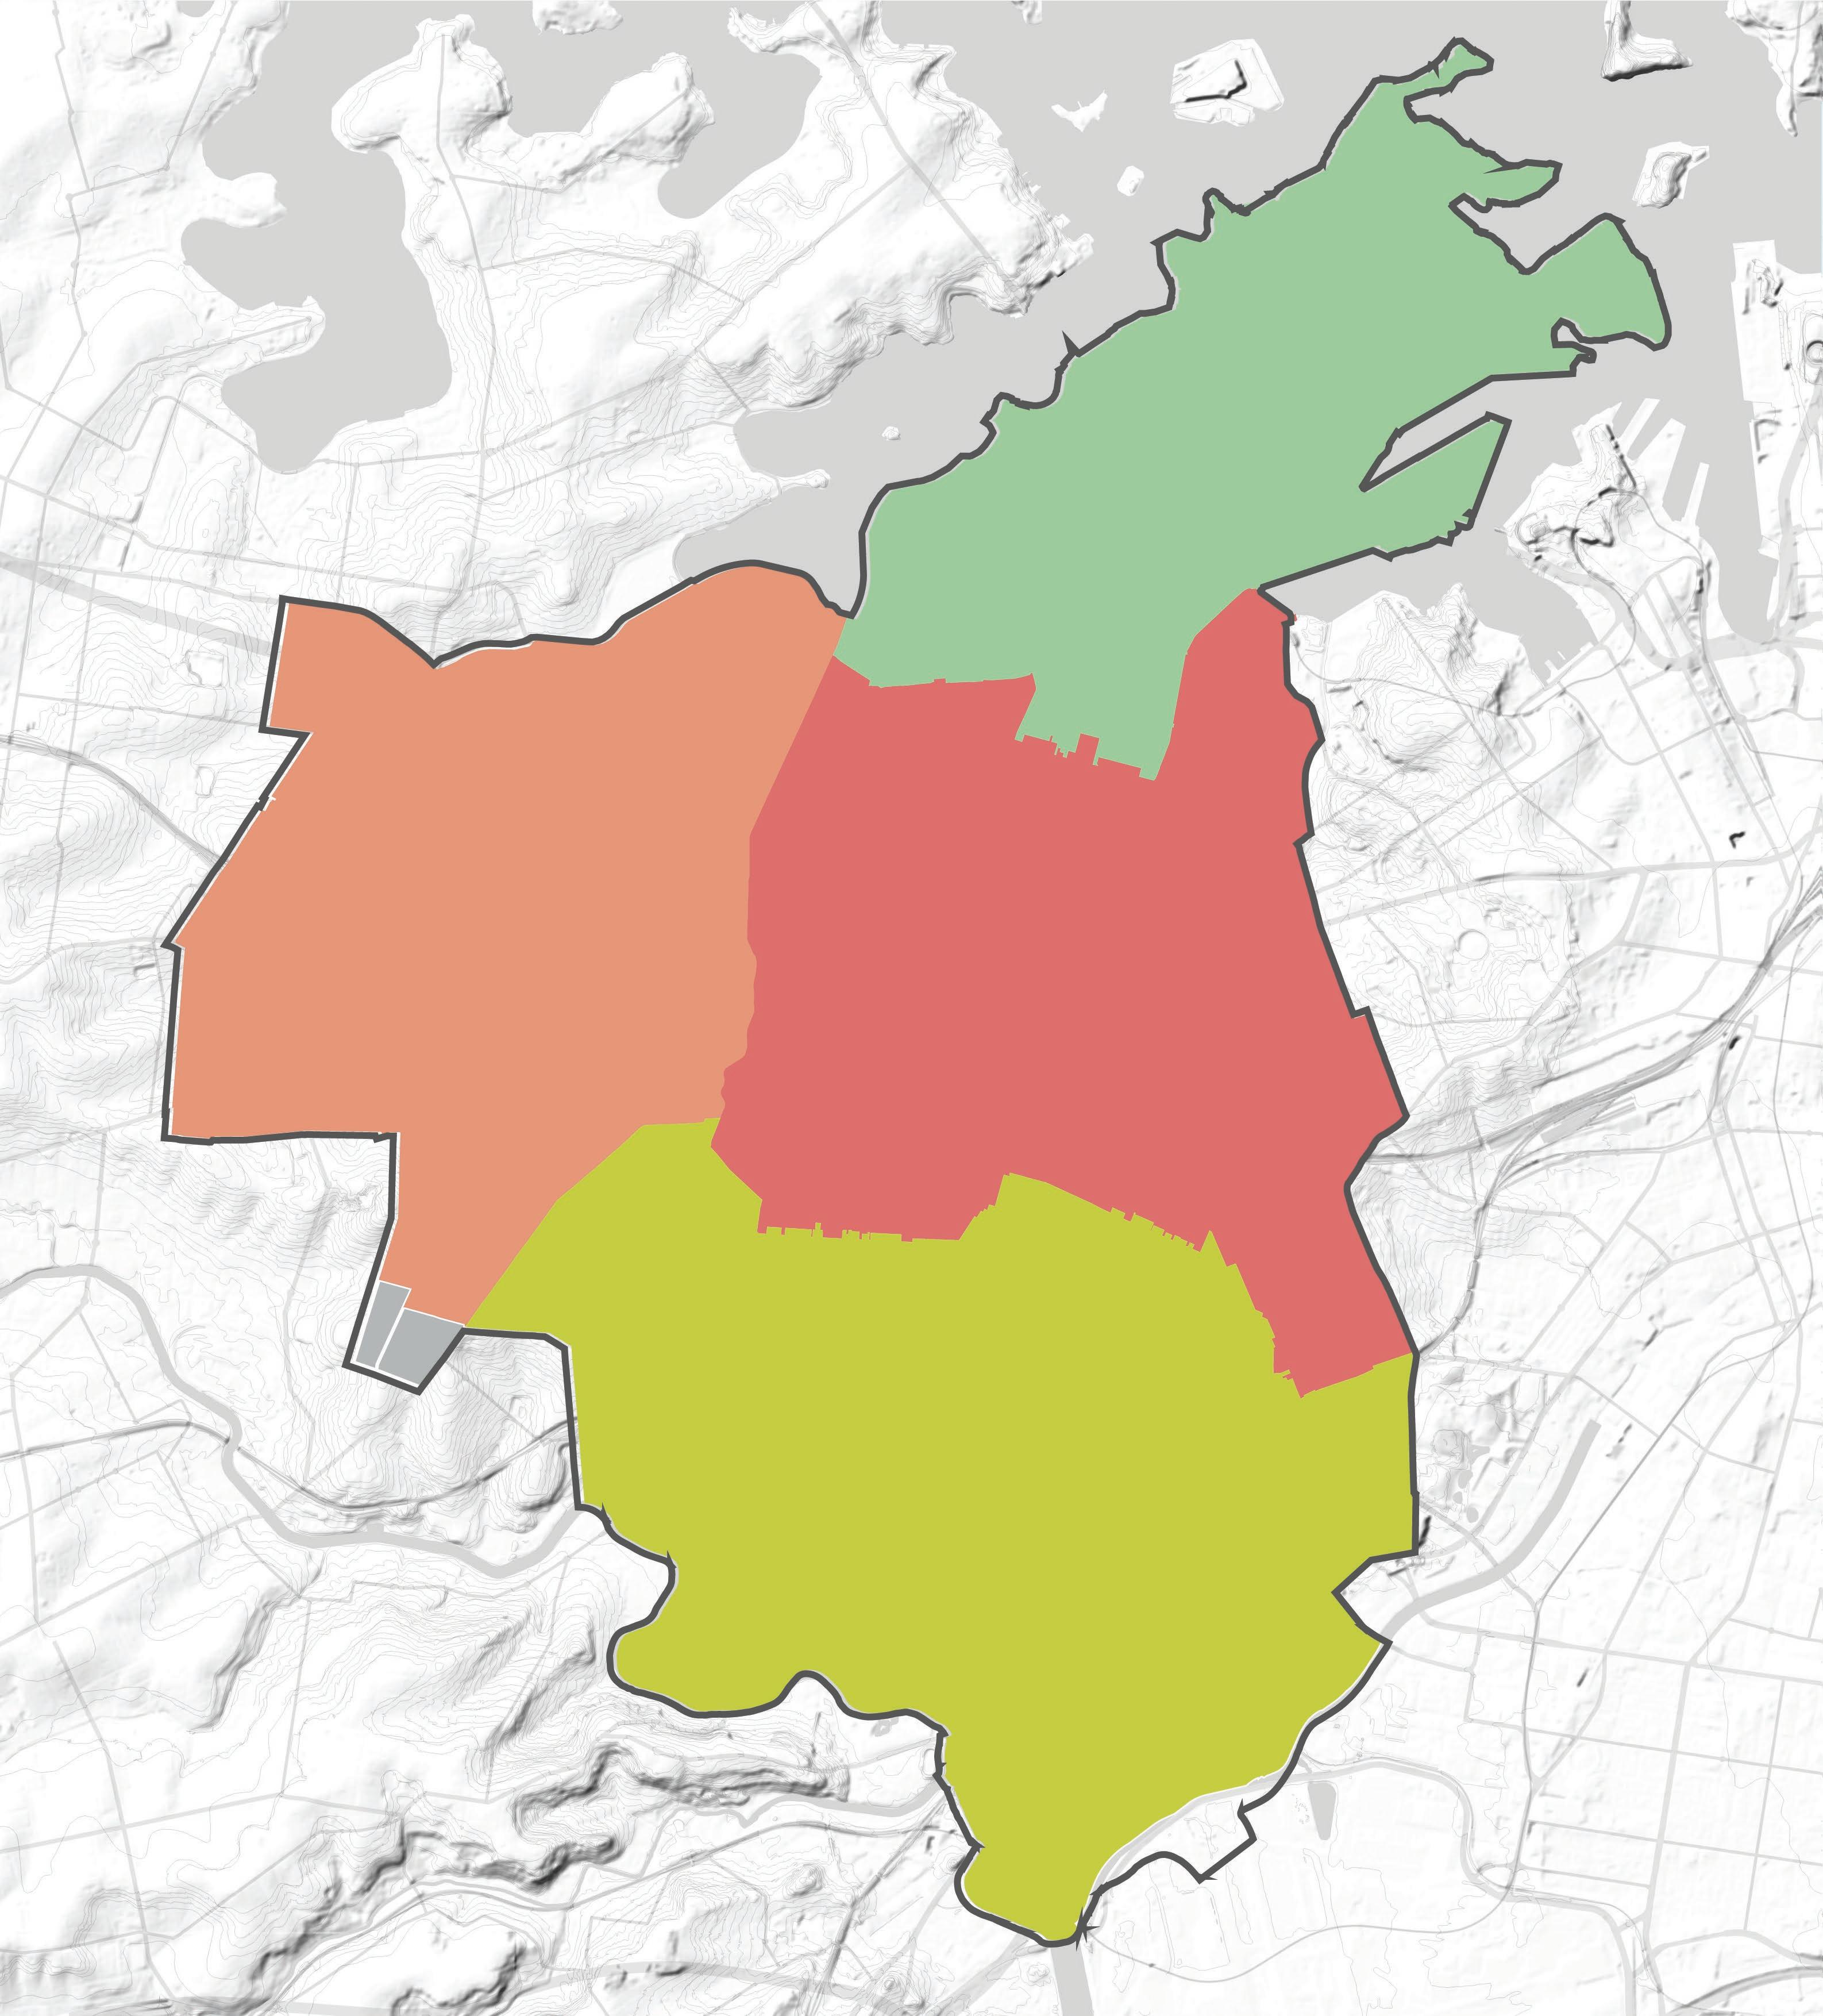
6.4 m2 16.9 m2 8.7 m2 32.5 m2
Mapping Layers
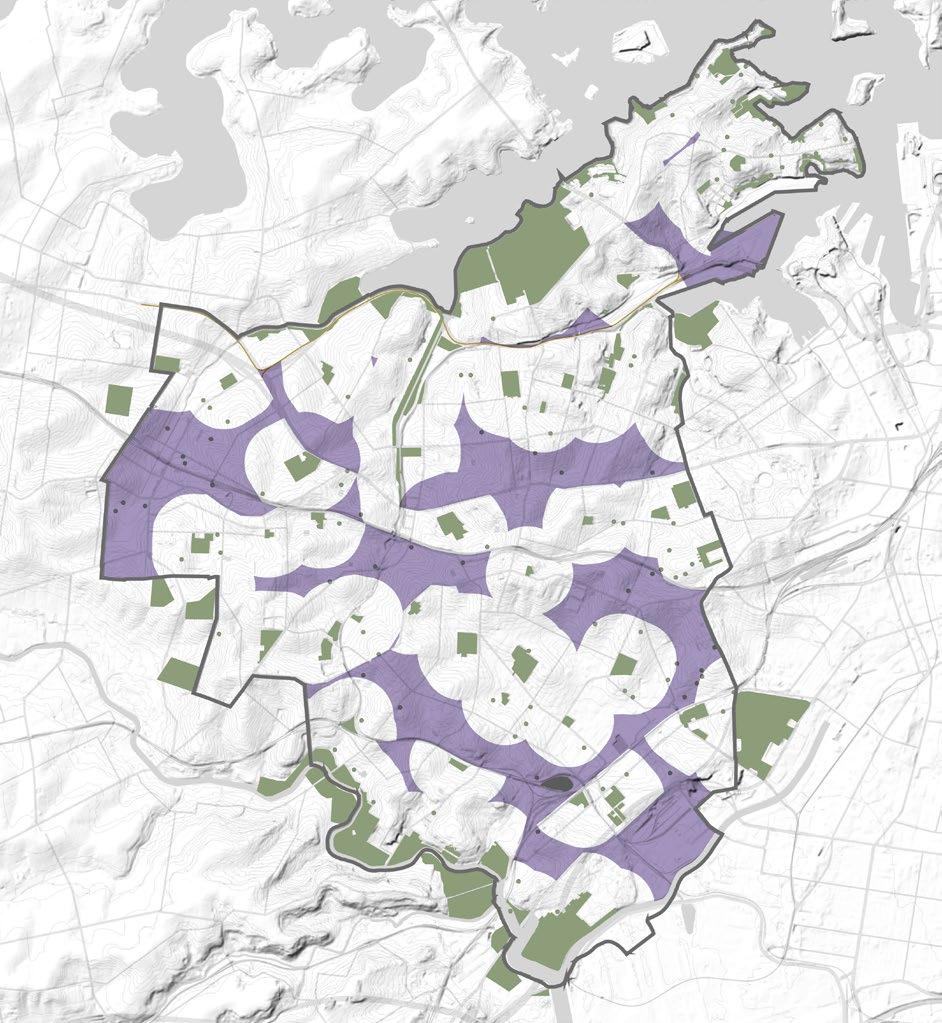
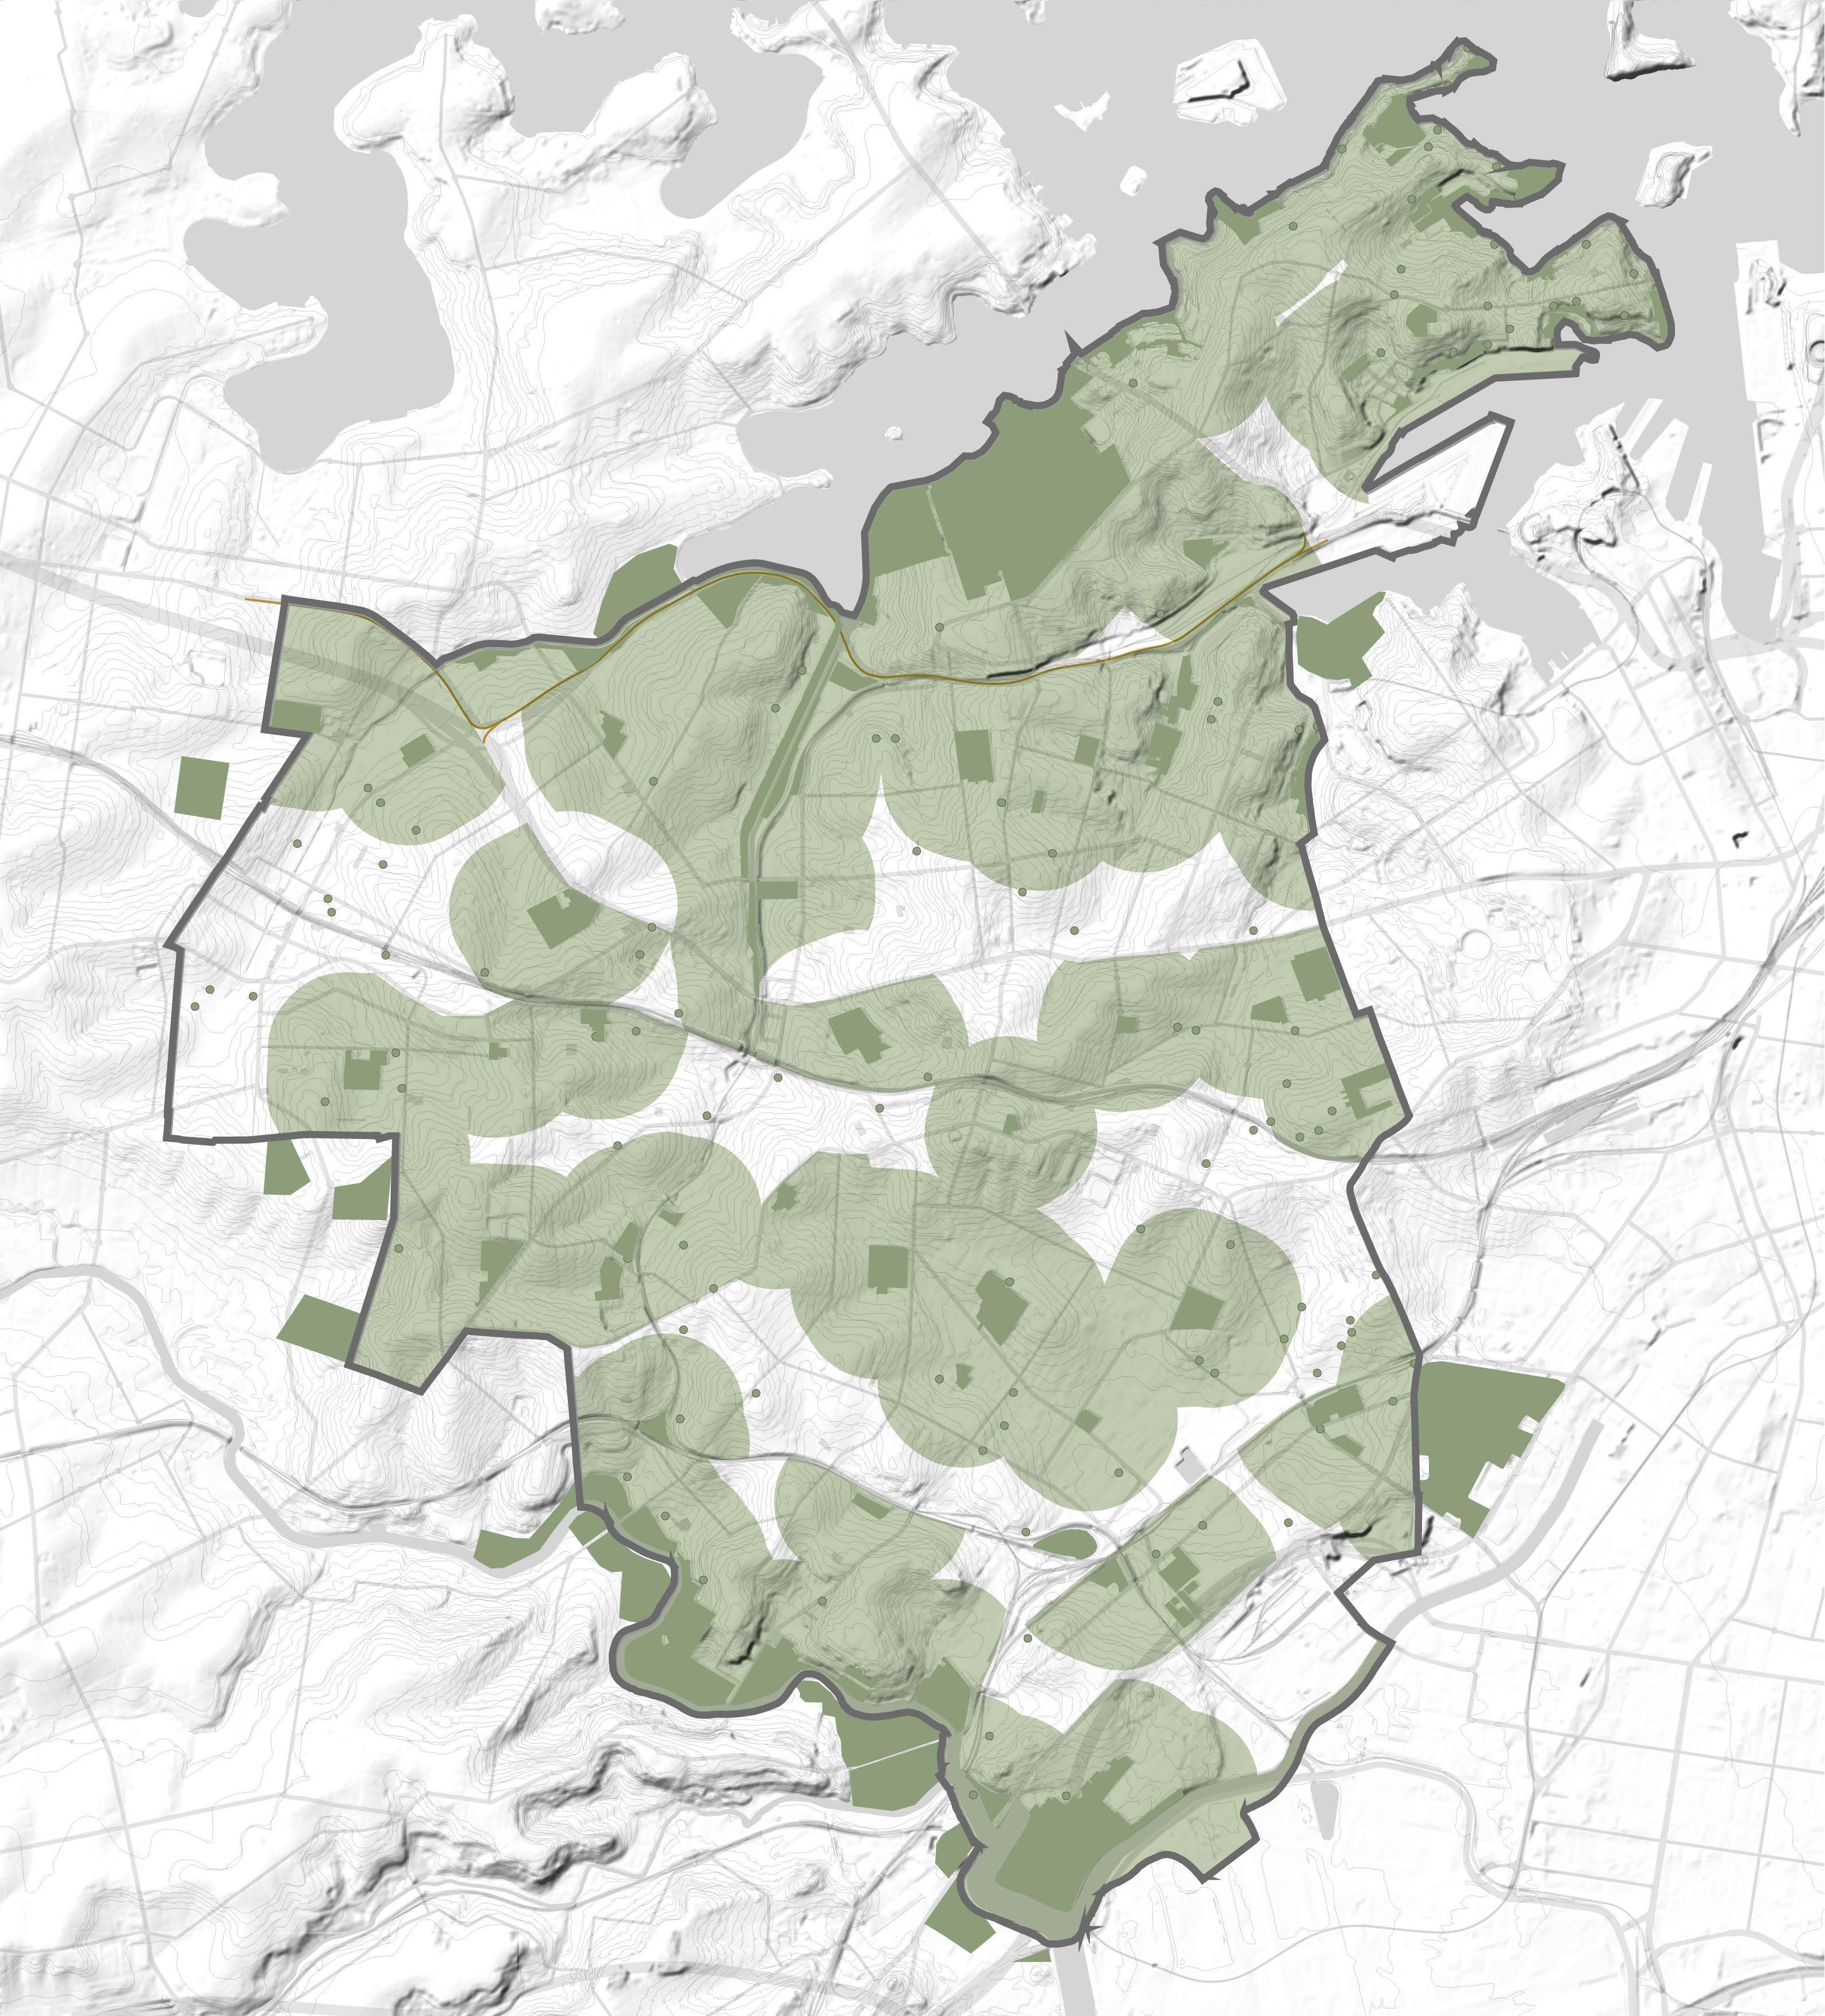
Accessibility to Open Space
Perimeters of major parks were offset to find ~400m of walkable distance from the perimeter from the parks without major barriers such as main roads and train lines which prevent ease of pedestrian accessibility.
This in turn begins to show which areas benefit from a strong existing presence of greenery and which areas heavily lack green open spaces.
Map source: Recreational Needs Study, Inner West Council.
Legend
Inner West LGA Boundary
Major Parks
400m walkability zone of Major Parks
Inner West Blue-Green Grid Strategy 2023 117
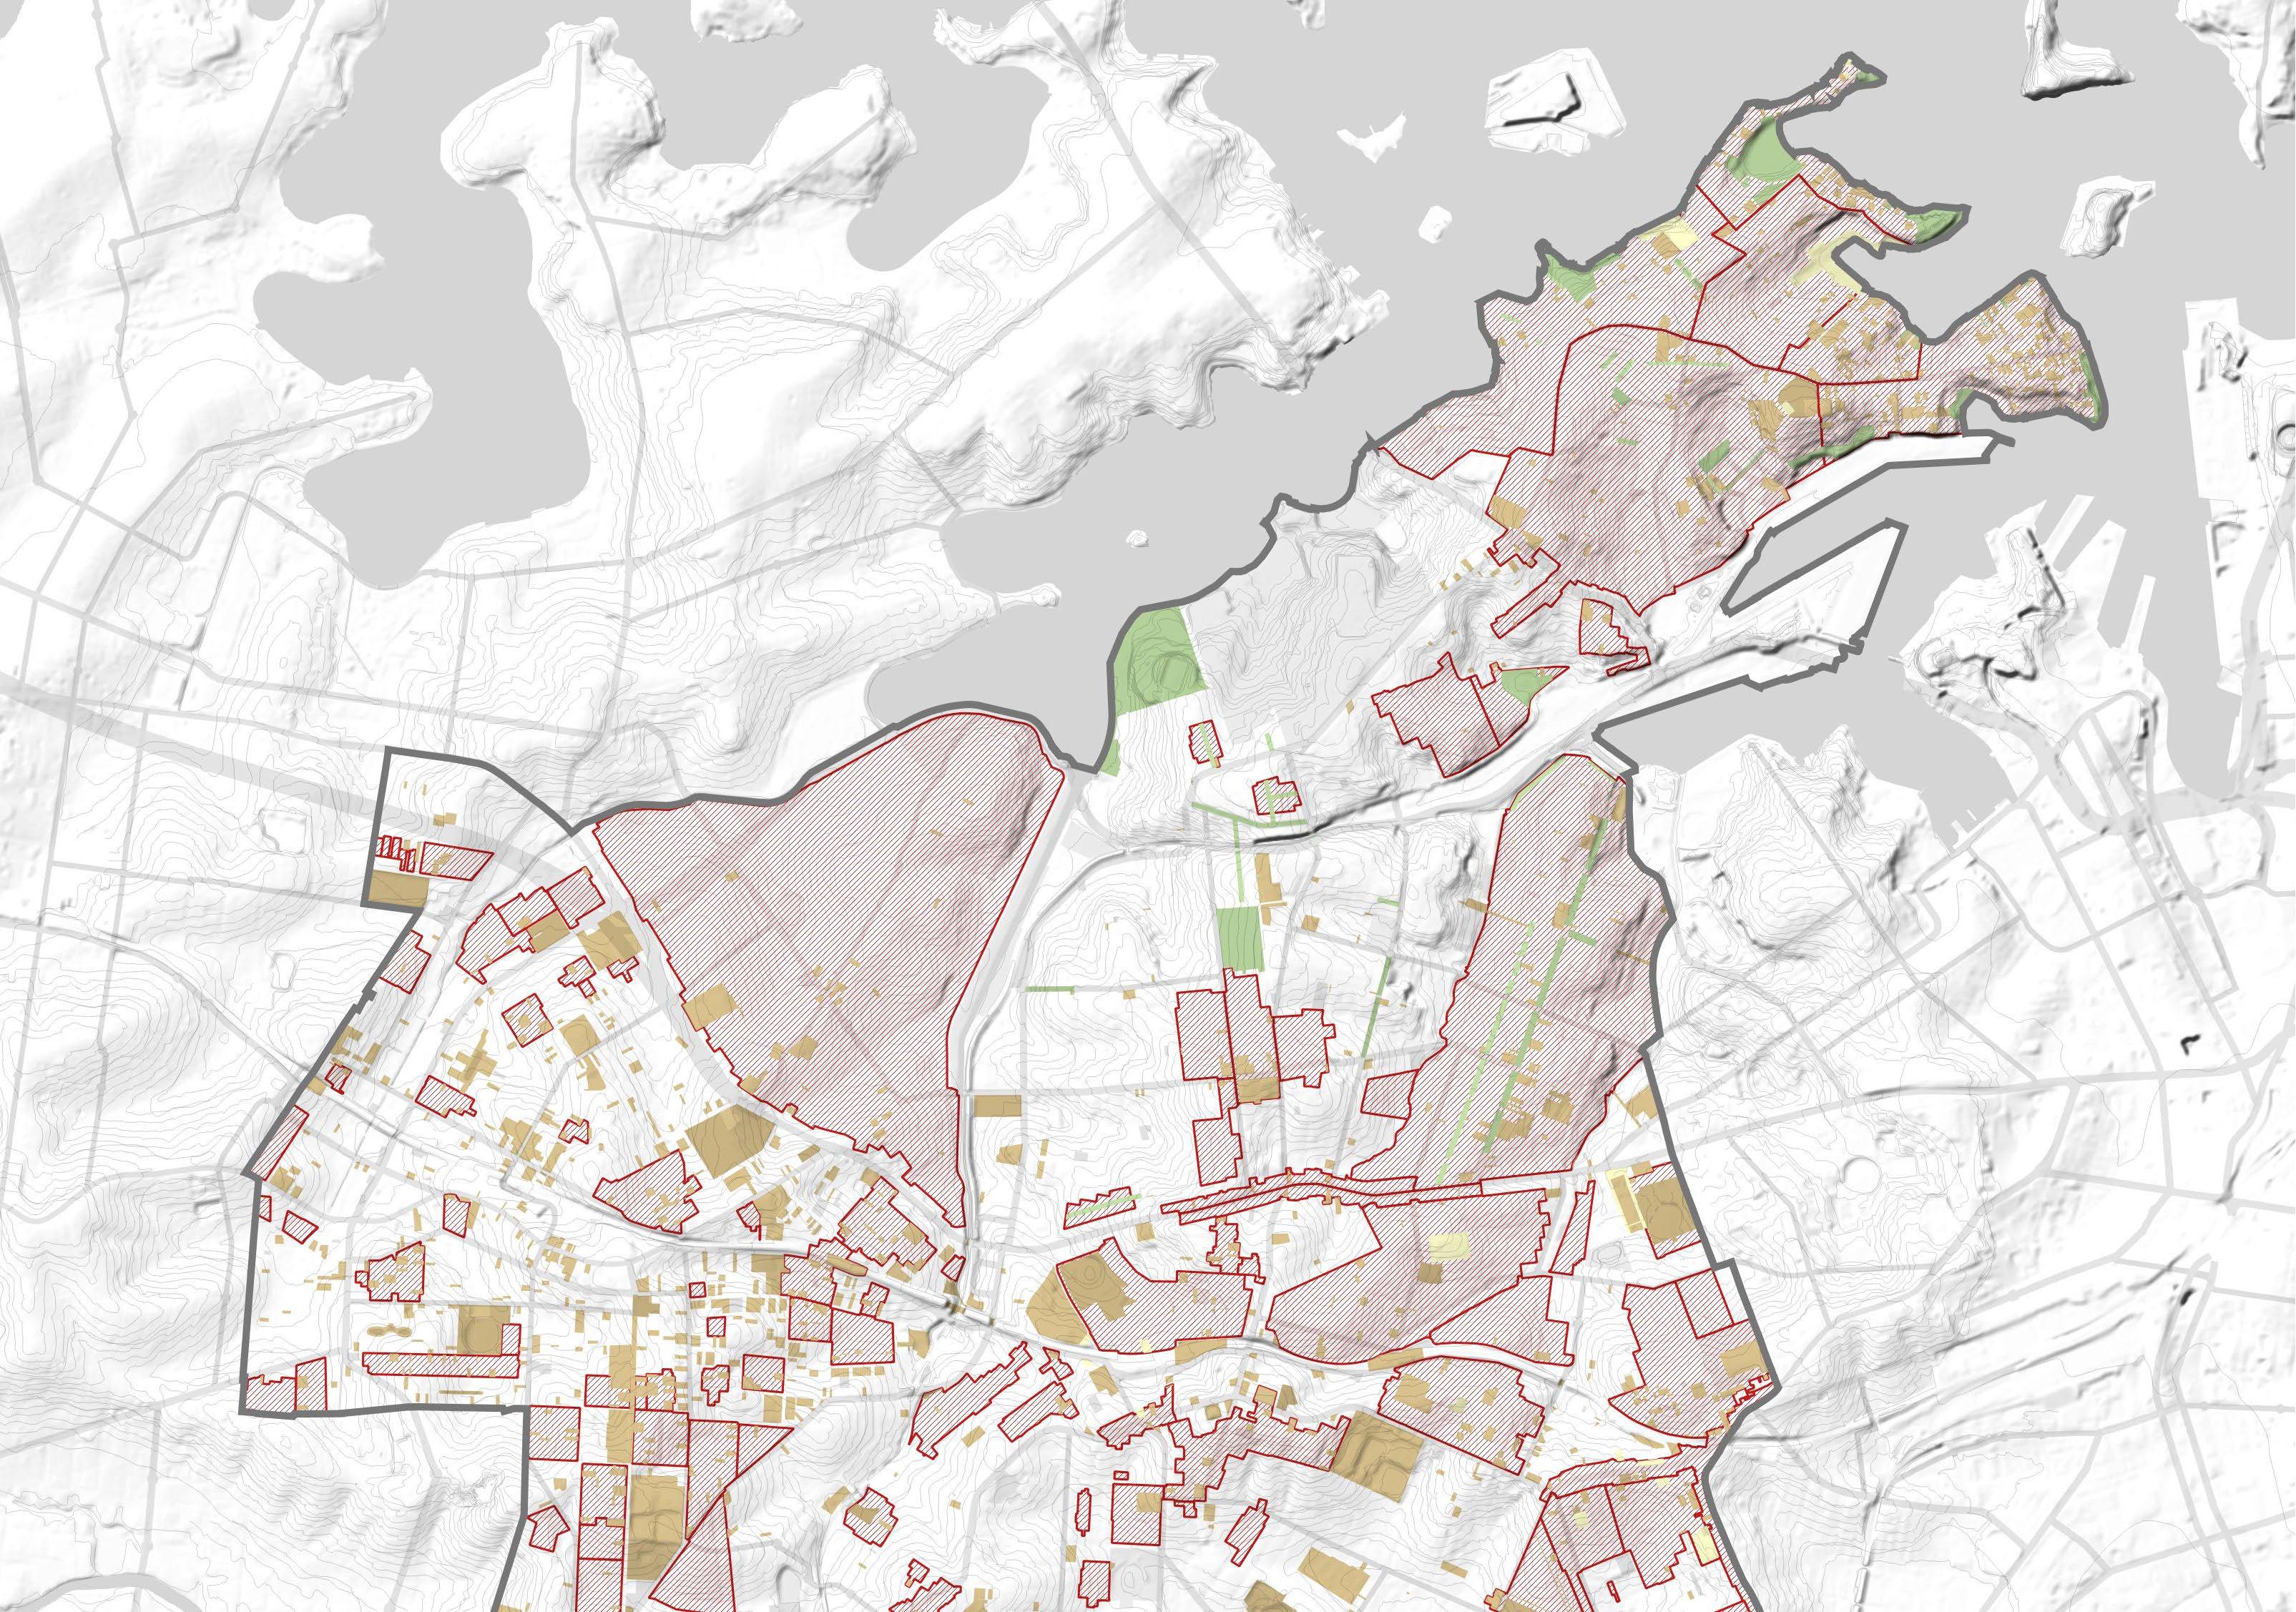
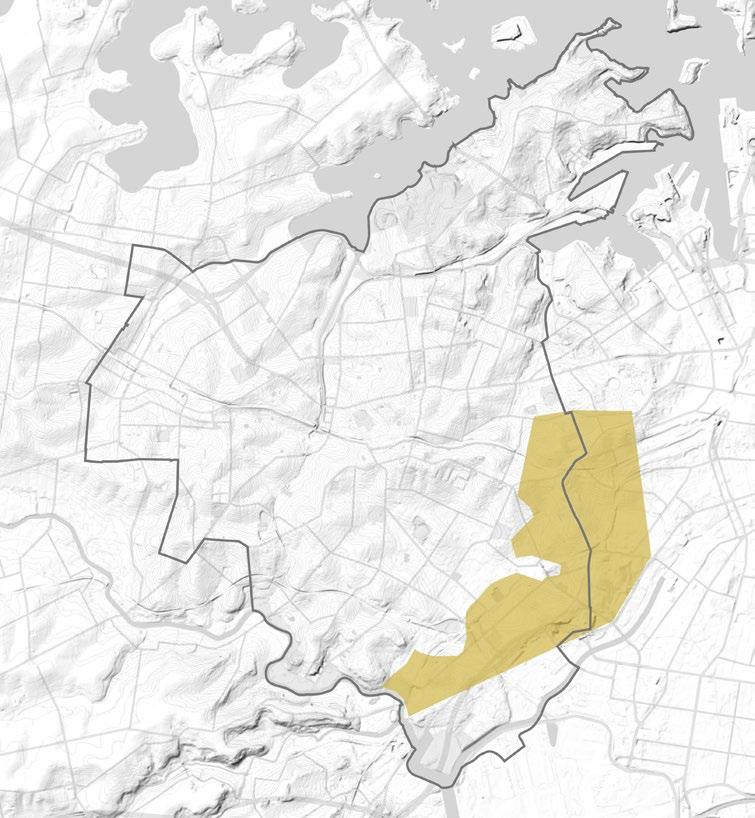
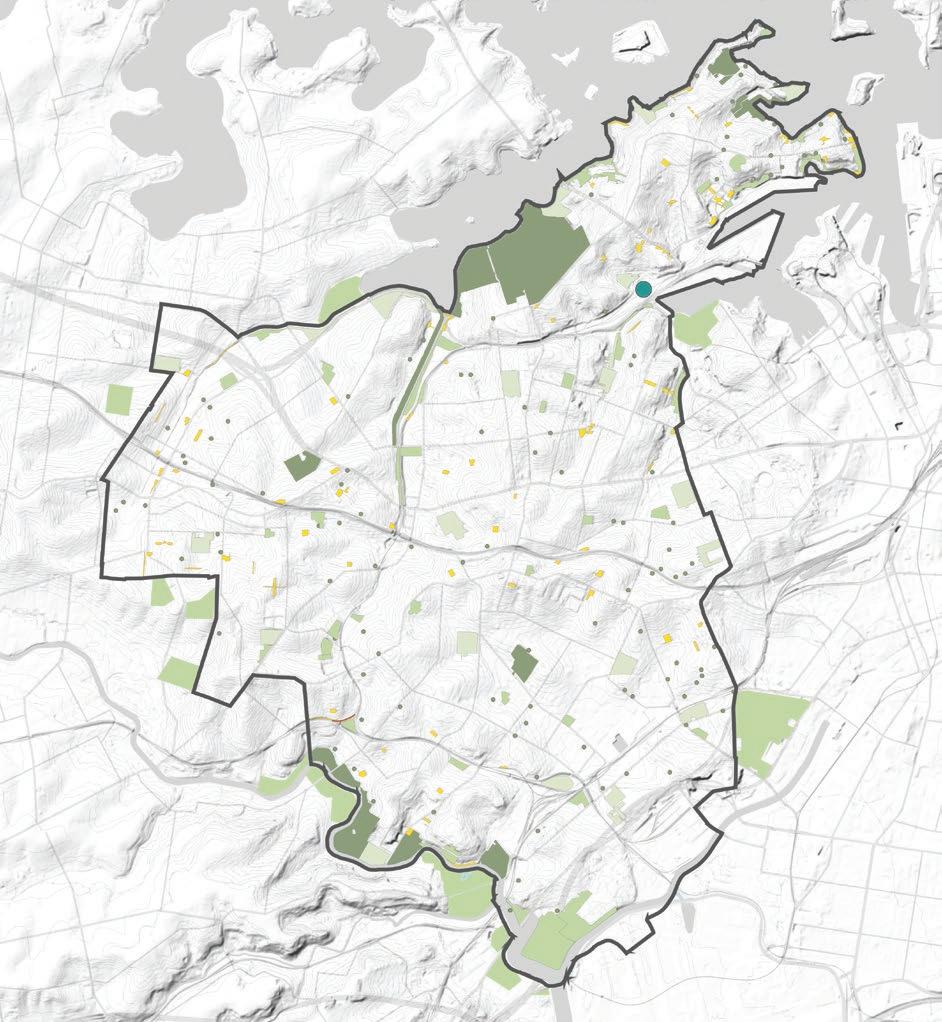
Mapping Layers
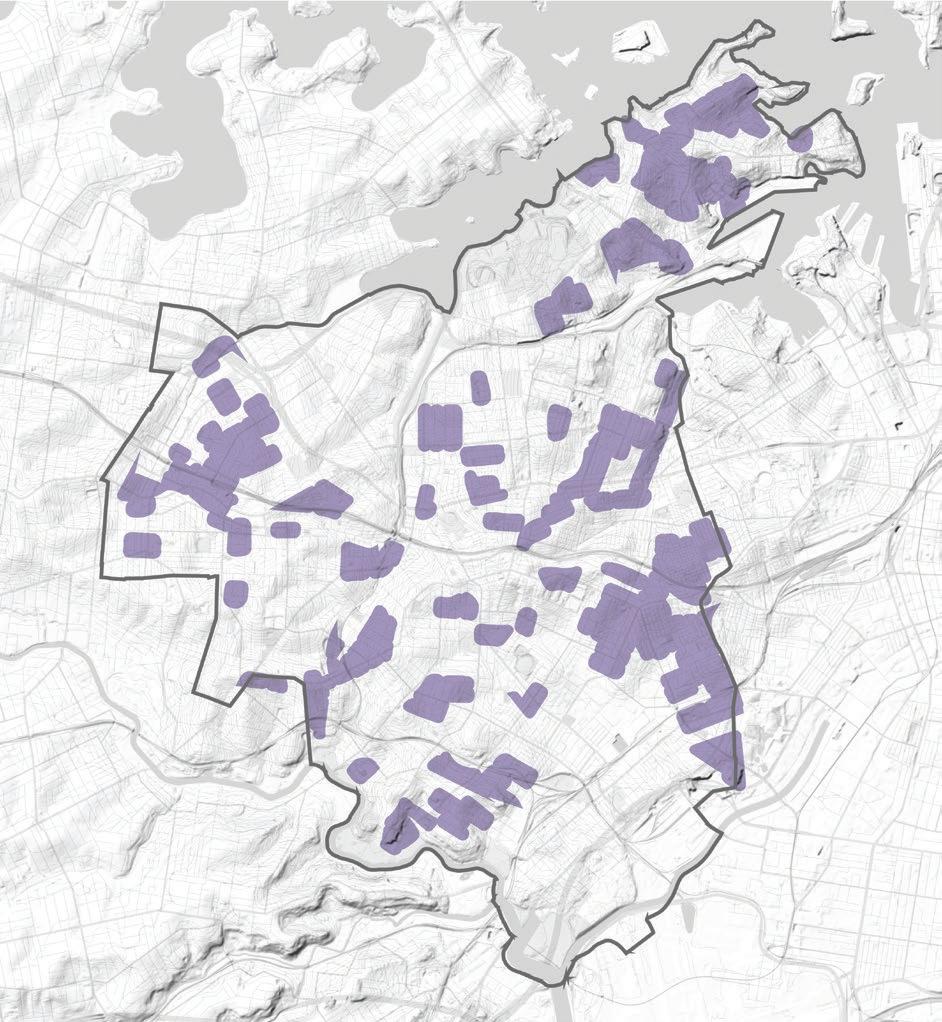
Areas Lacking Open Space
This map was extracted from Recreation Needs Study and identify areas that have below benchmark access to open space.
The catchment areas exclude areas that are across access barriers such as major roads and above ground train lines.
The map indicates areas that would benefit from the addition of the Blue-Green Grid.
Map source: Recreational Needs Study, Inner West Council.

Inner West LGA Boundary
Parks and Open Spaces
Areas not within 400m easy walking distance.
Legend
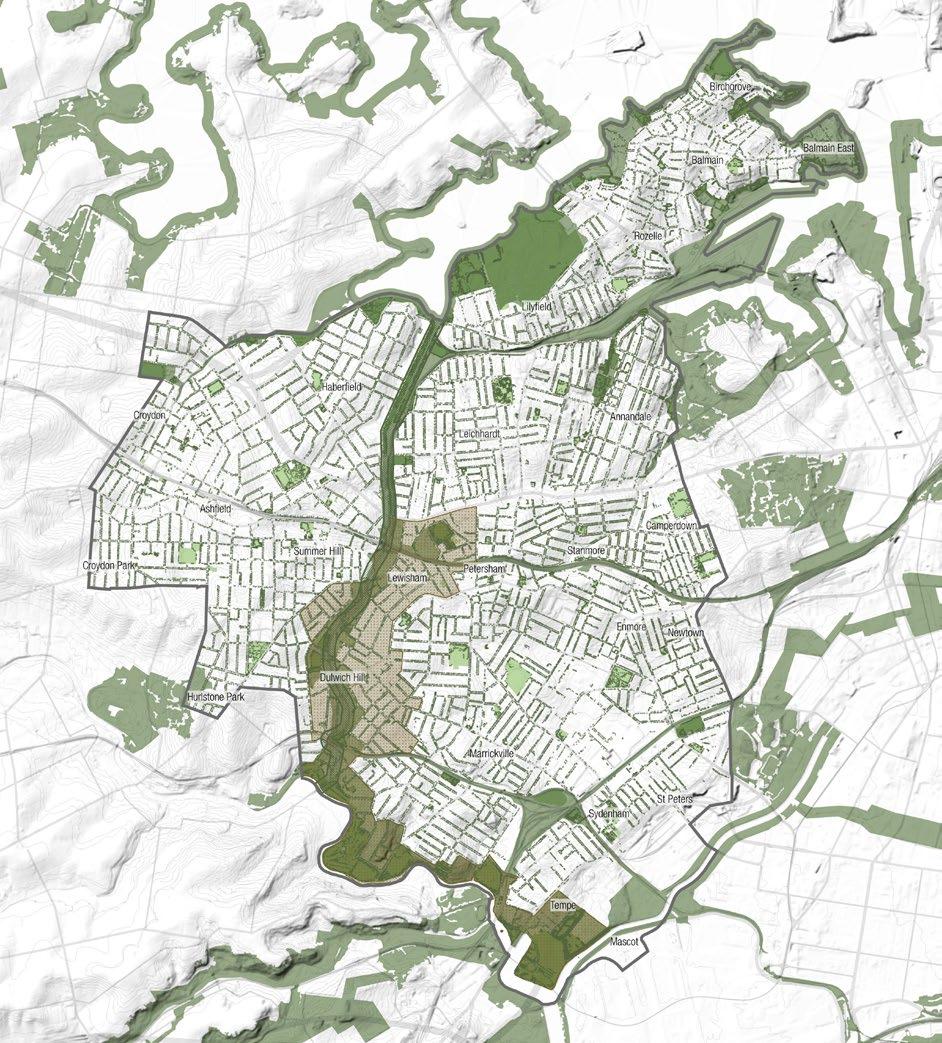
Mapping Layers Biodiversity

A significant percentage of greenery comes from parks which contributes to the Blue-Green Grid as an existing system. Areas with high biodiversity value should be included in the grid, as it will serve as protection to the existing ecologies and enhance future ecosystems. Two major corridors improves North / South connection, and three key zones are identified with high value biodiversity. Biodiversity East/West connection can be improved by Blue-Green Grid.
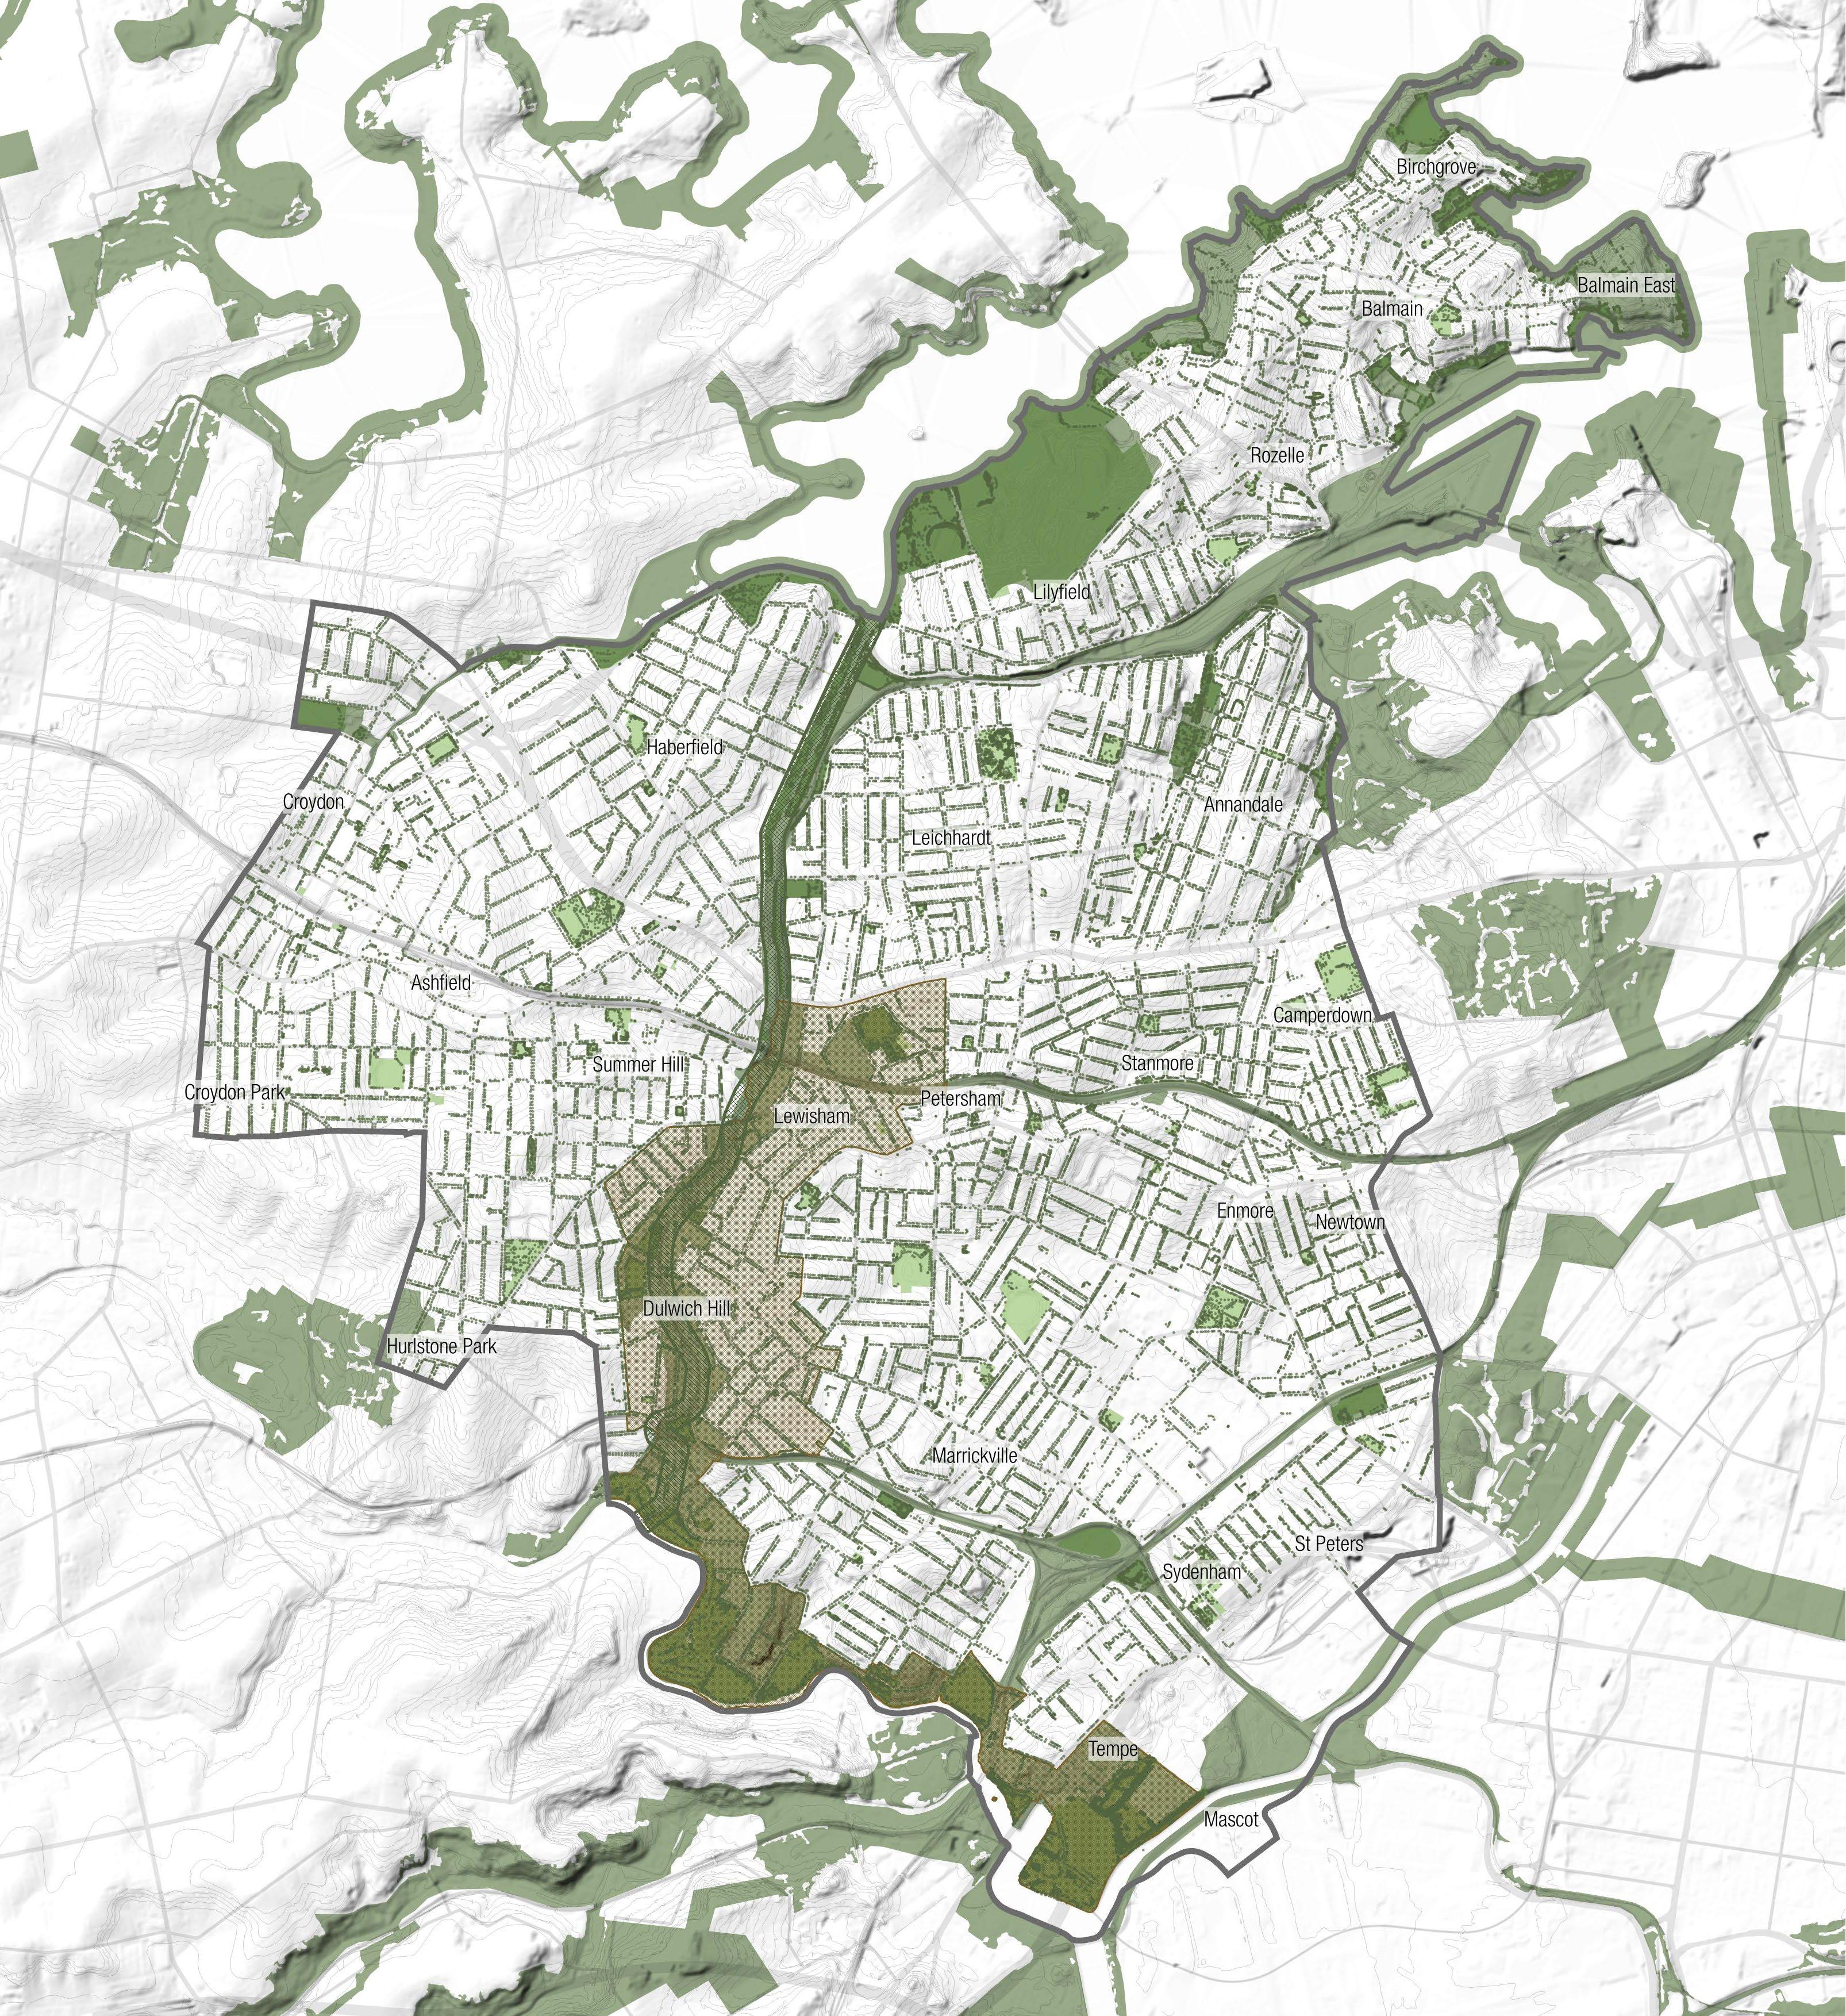
The Indigenous people are the traditional carers of land and themselves utilised the local environment as infrastructure for food and shelter. Their history and knowledge should be referenced and utilised.
Map source: SSROC Biodiversity Corridors 2016 (Provided by Inner West Council), Shapefiles provided by Inner West Council.
Inner West LGA Boundary
Parks
Biodiversity Corridor
Wildlife Corridor & Bandicot Protection Area
Greenway
Registered Council Street Tree
Inner West Blue-Green Grid Strategy 2023 119
Legend
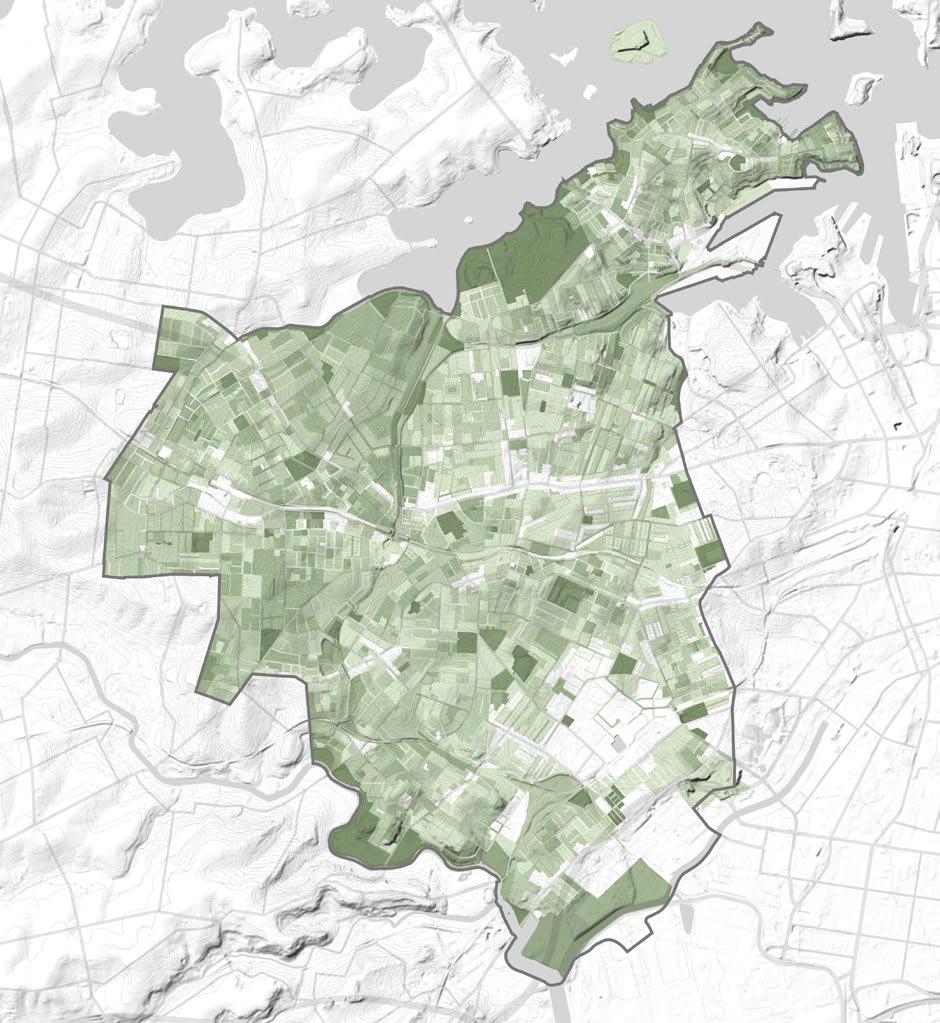
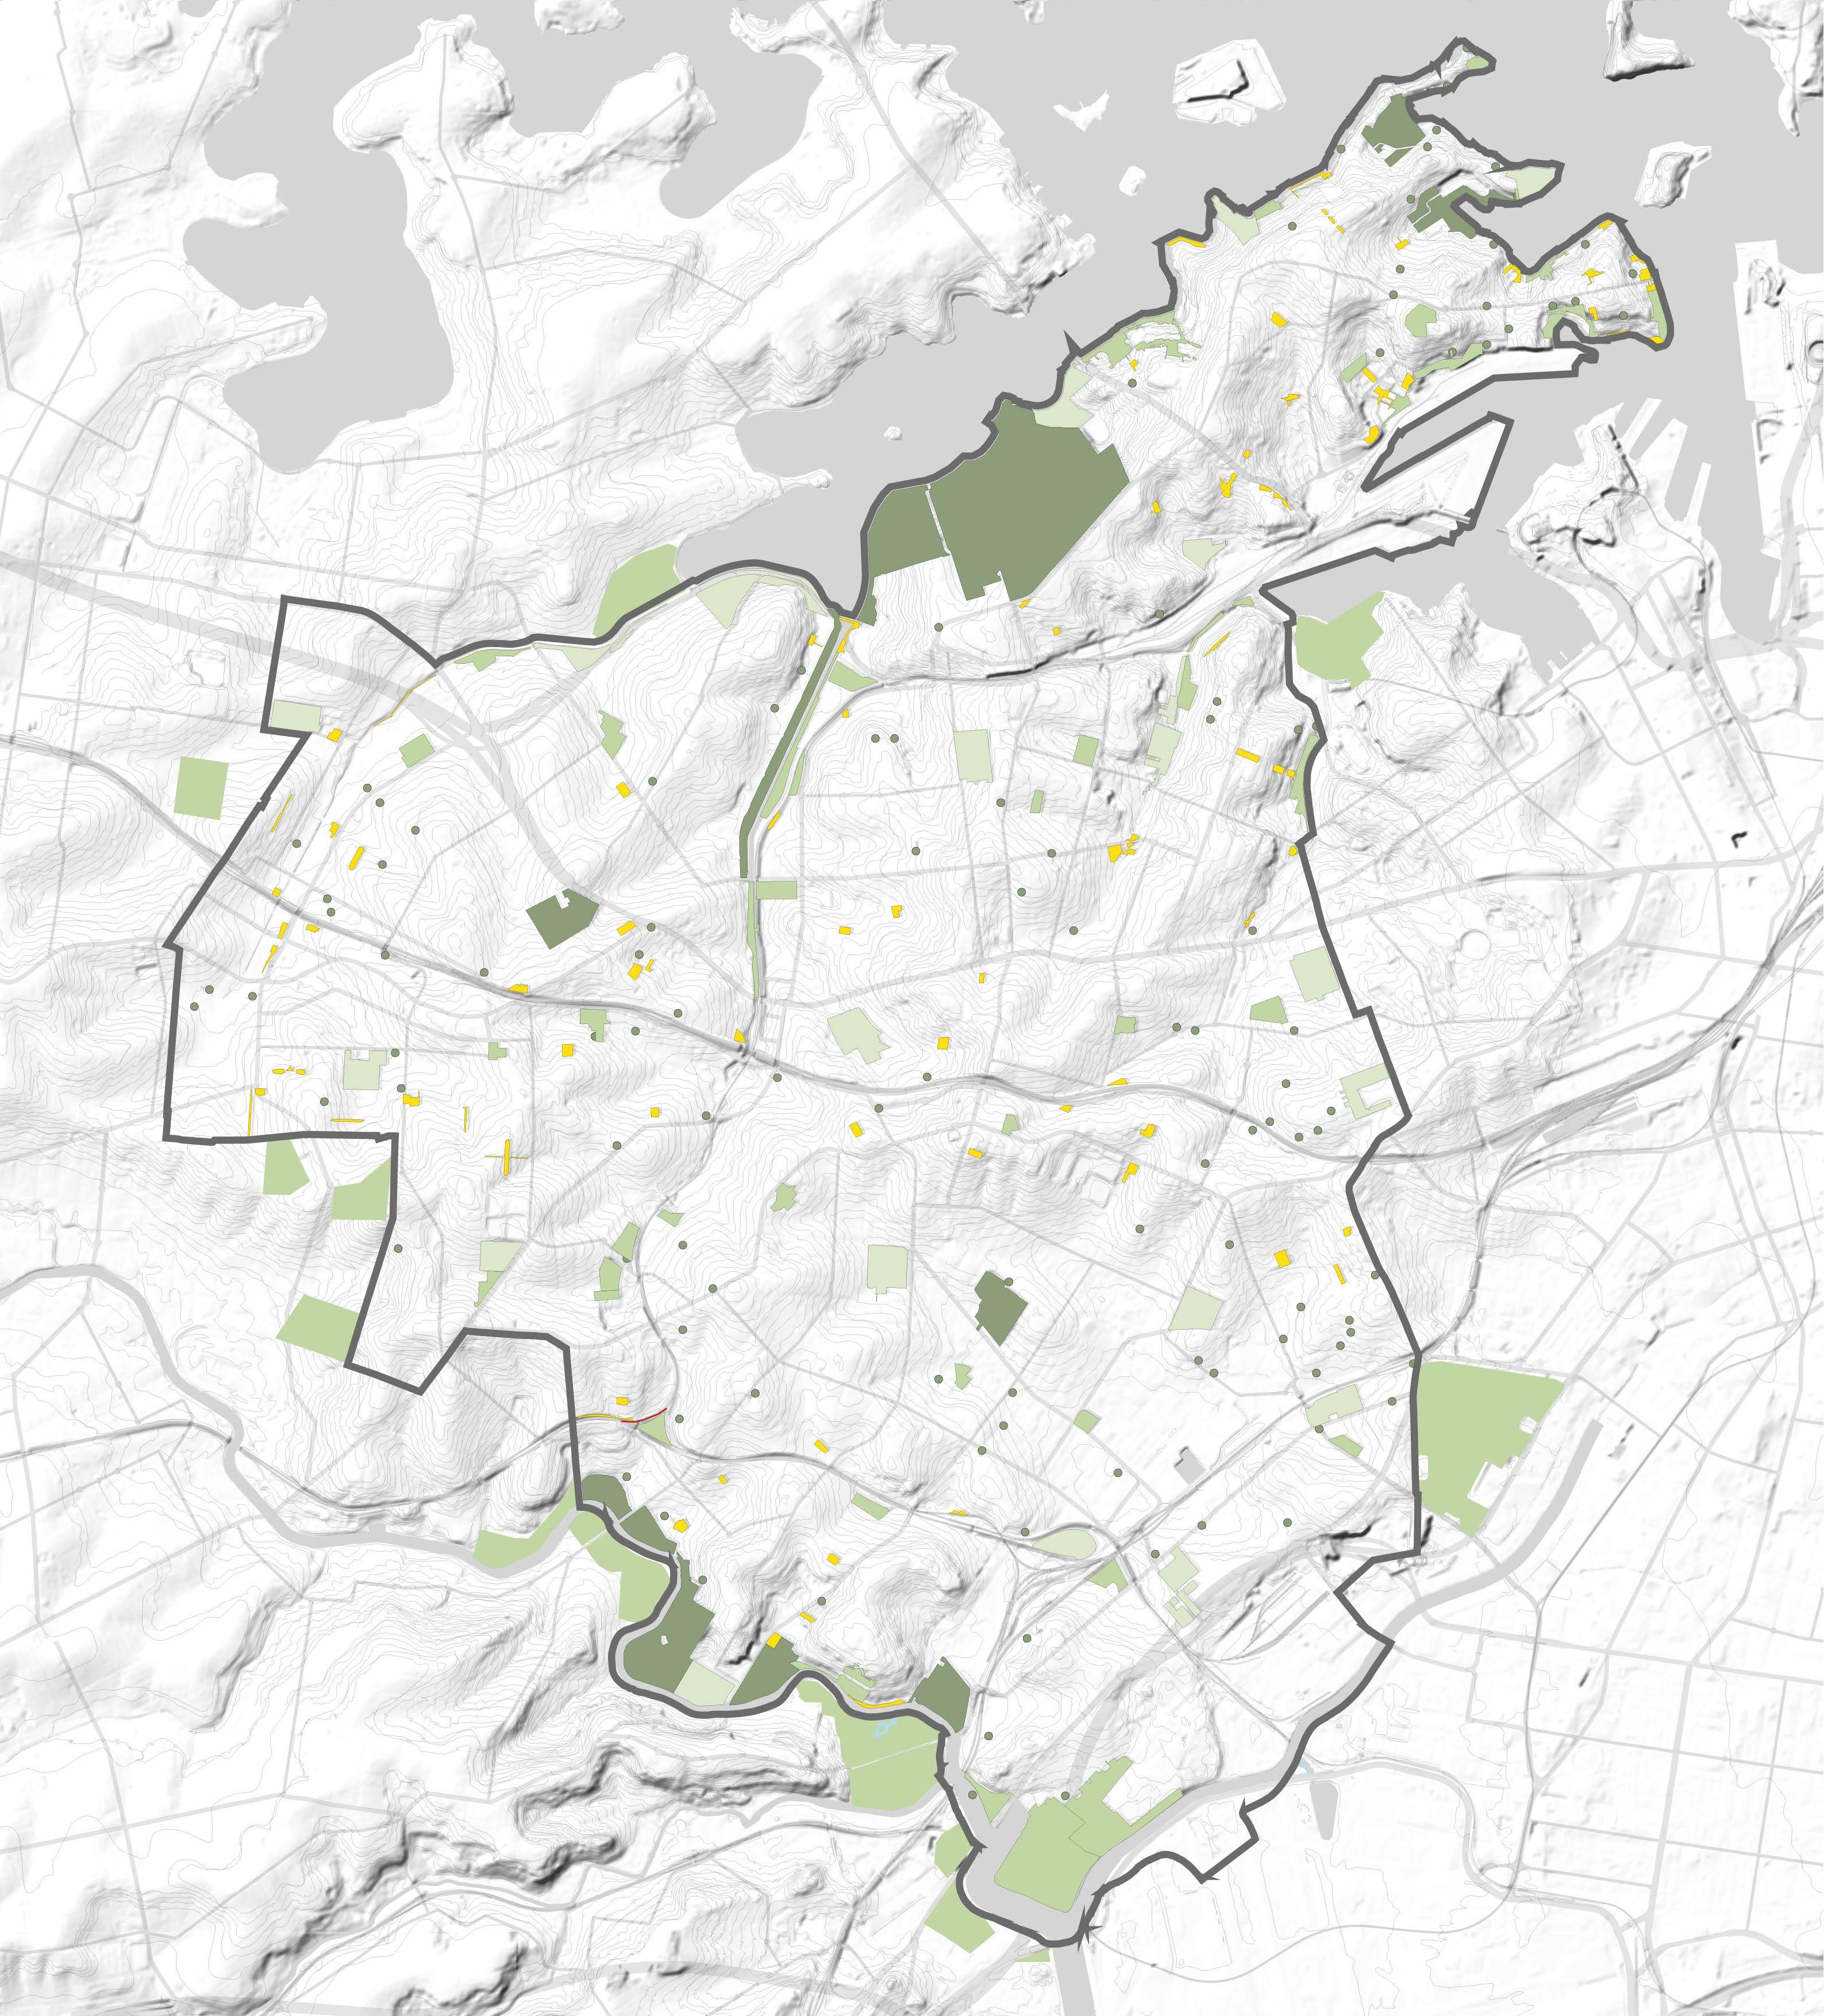
Mapping Layers
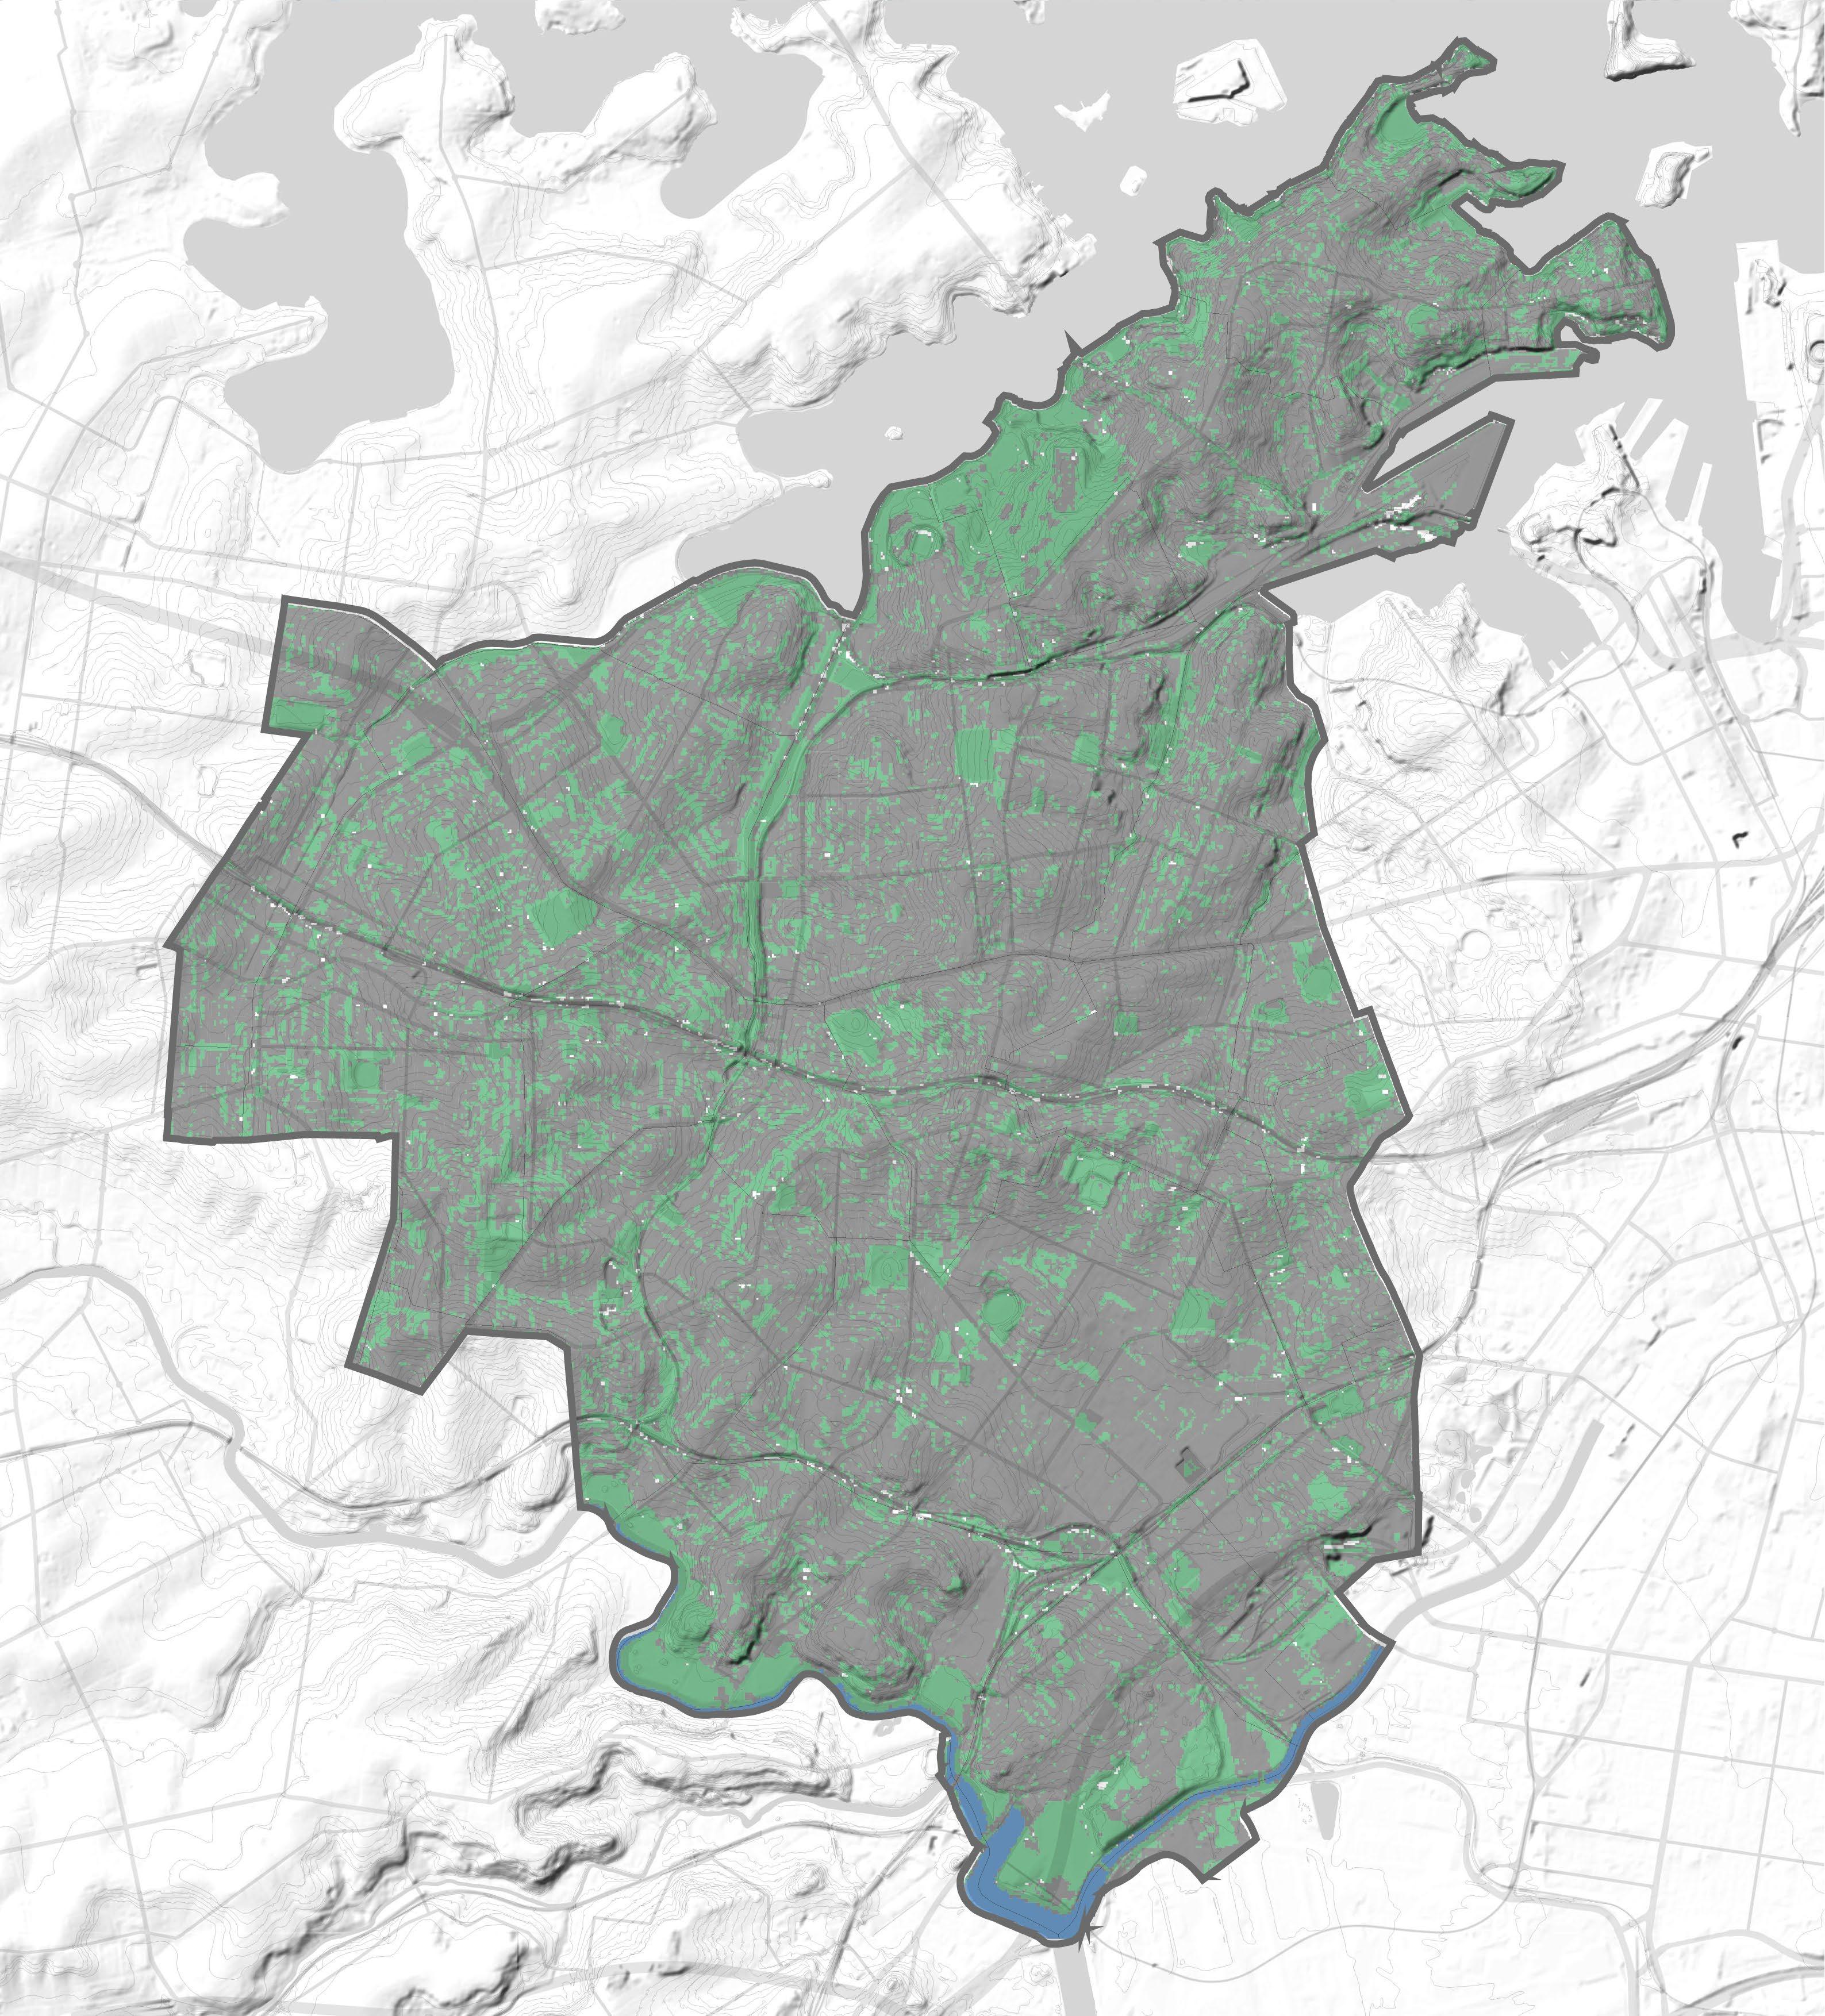
Vegetated Areas
Vegetation on this map includes all cataloged vegetation types; grass,shrubs and trees.
The mapping shows where theres a higher concentration of greenery, which is inevitably where the parks are.
Key to the Blue-Green Grid is considering plants of various sizes to provide habitat to small ground and lower dwelling animals such as the Long-nosed Bandicot and Superb Fairy Wren as well as contribute to a strong green character.
Shown in this map, is the lack of diverse vegetation particularly on the eastern side of the Inner West LGA, highlighting East Marrickville, Sydenham and St Peters as areas with particularly lack of greenery.
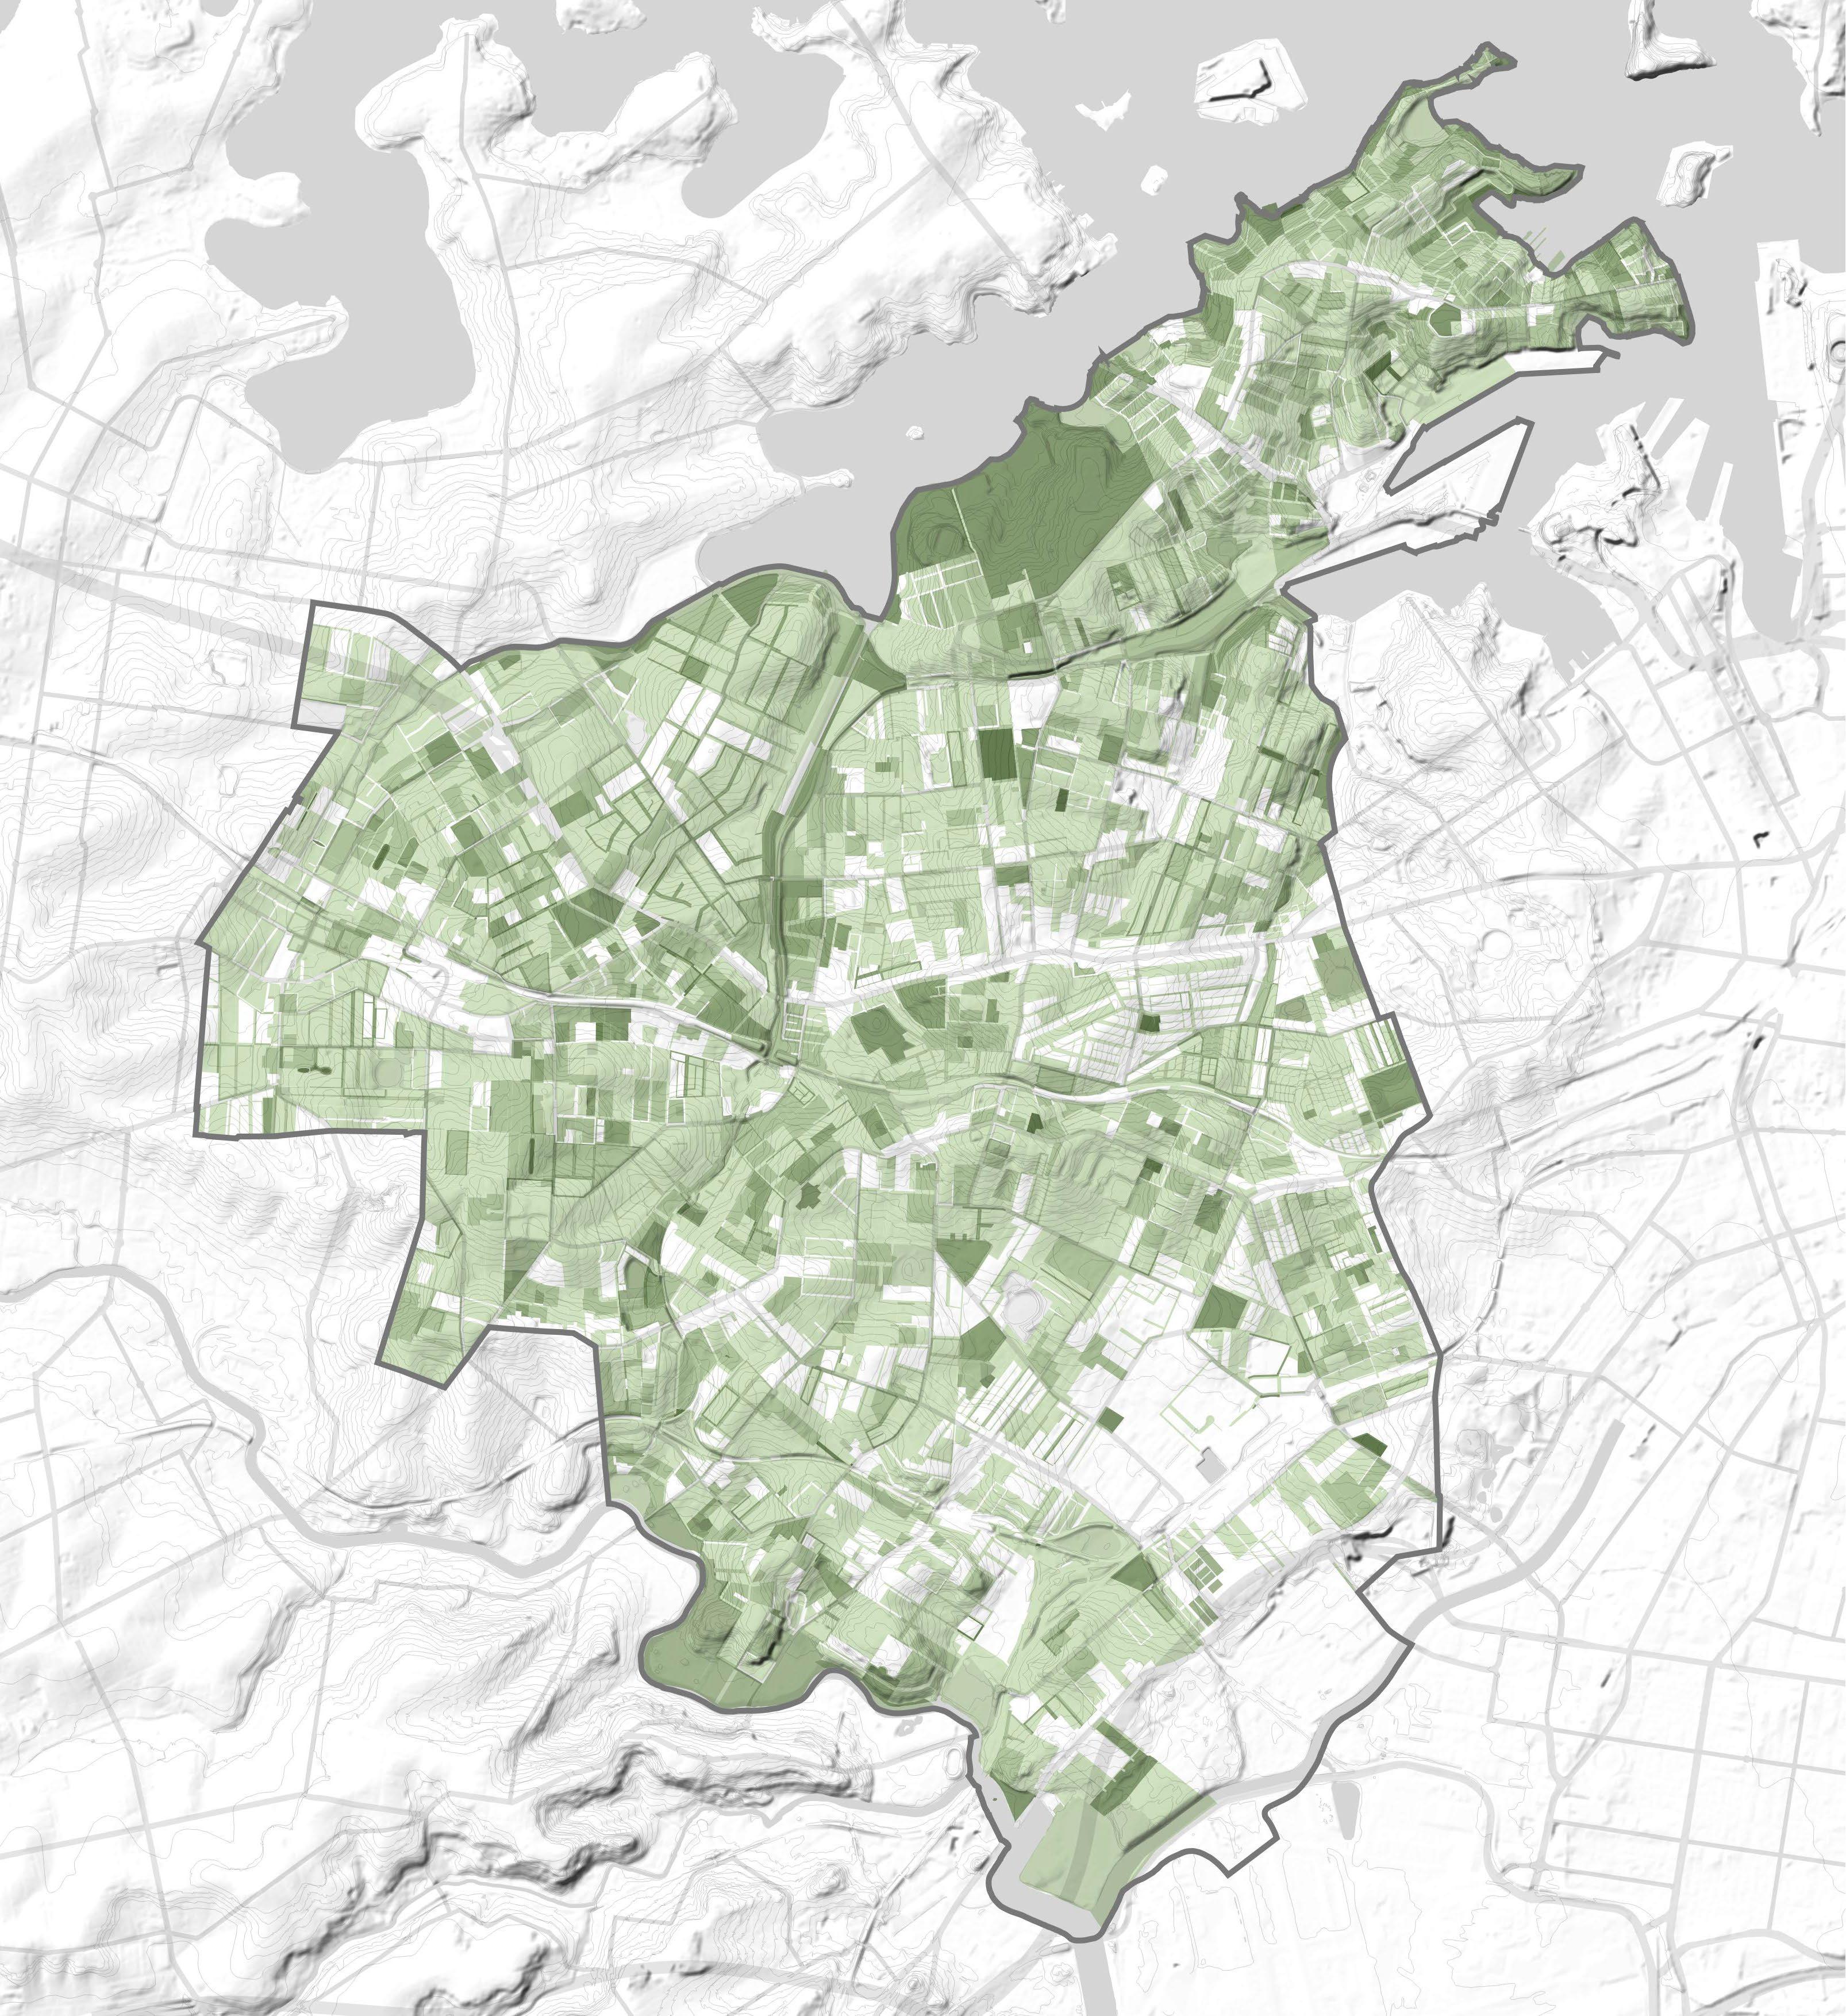
Identified areas correlate with previous map and areas that lack walkability to green open spaces.
Map source: Shapefile provided by Inner West Council.
Legend
Inner West LGA Boundary
50%-100% vegetation coverage
30%-50% vegetation coverage
20%-30% vegetation coverage
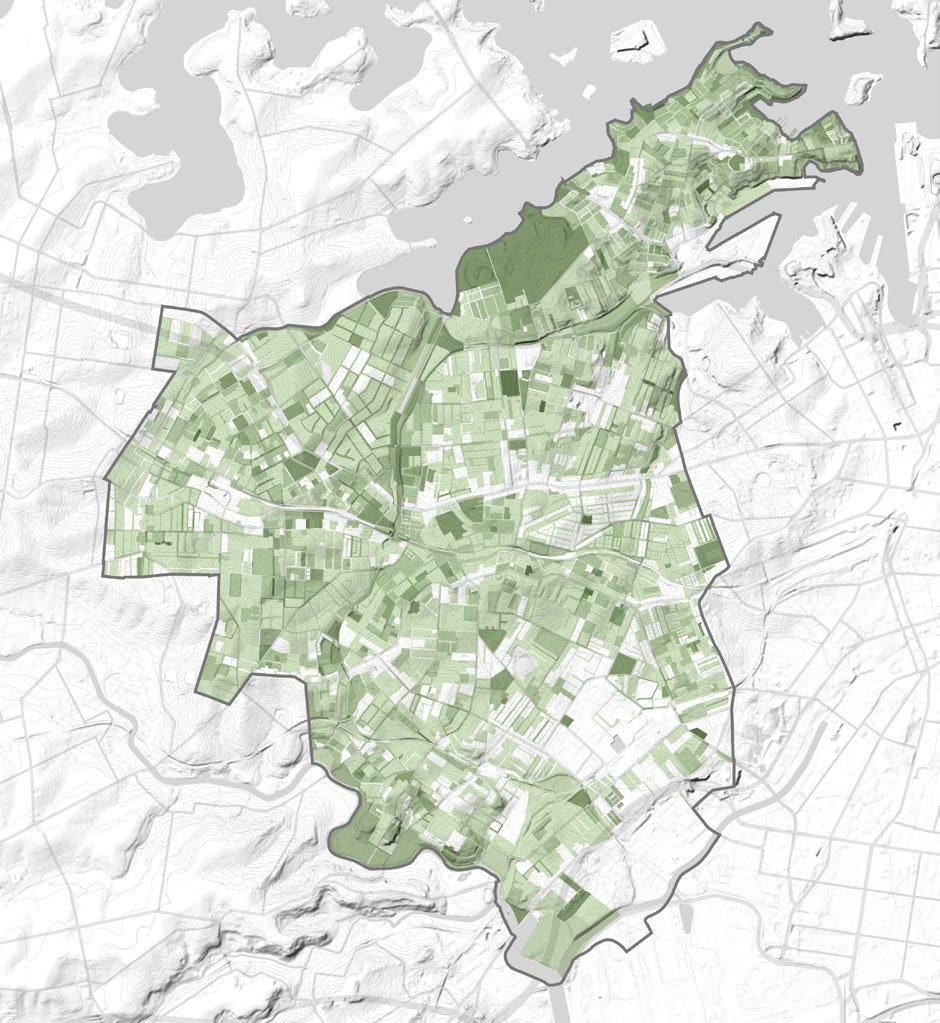
Mapping Layers
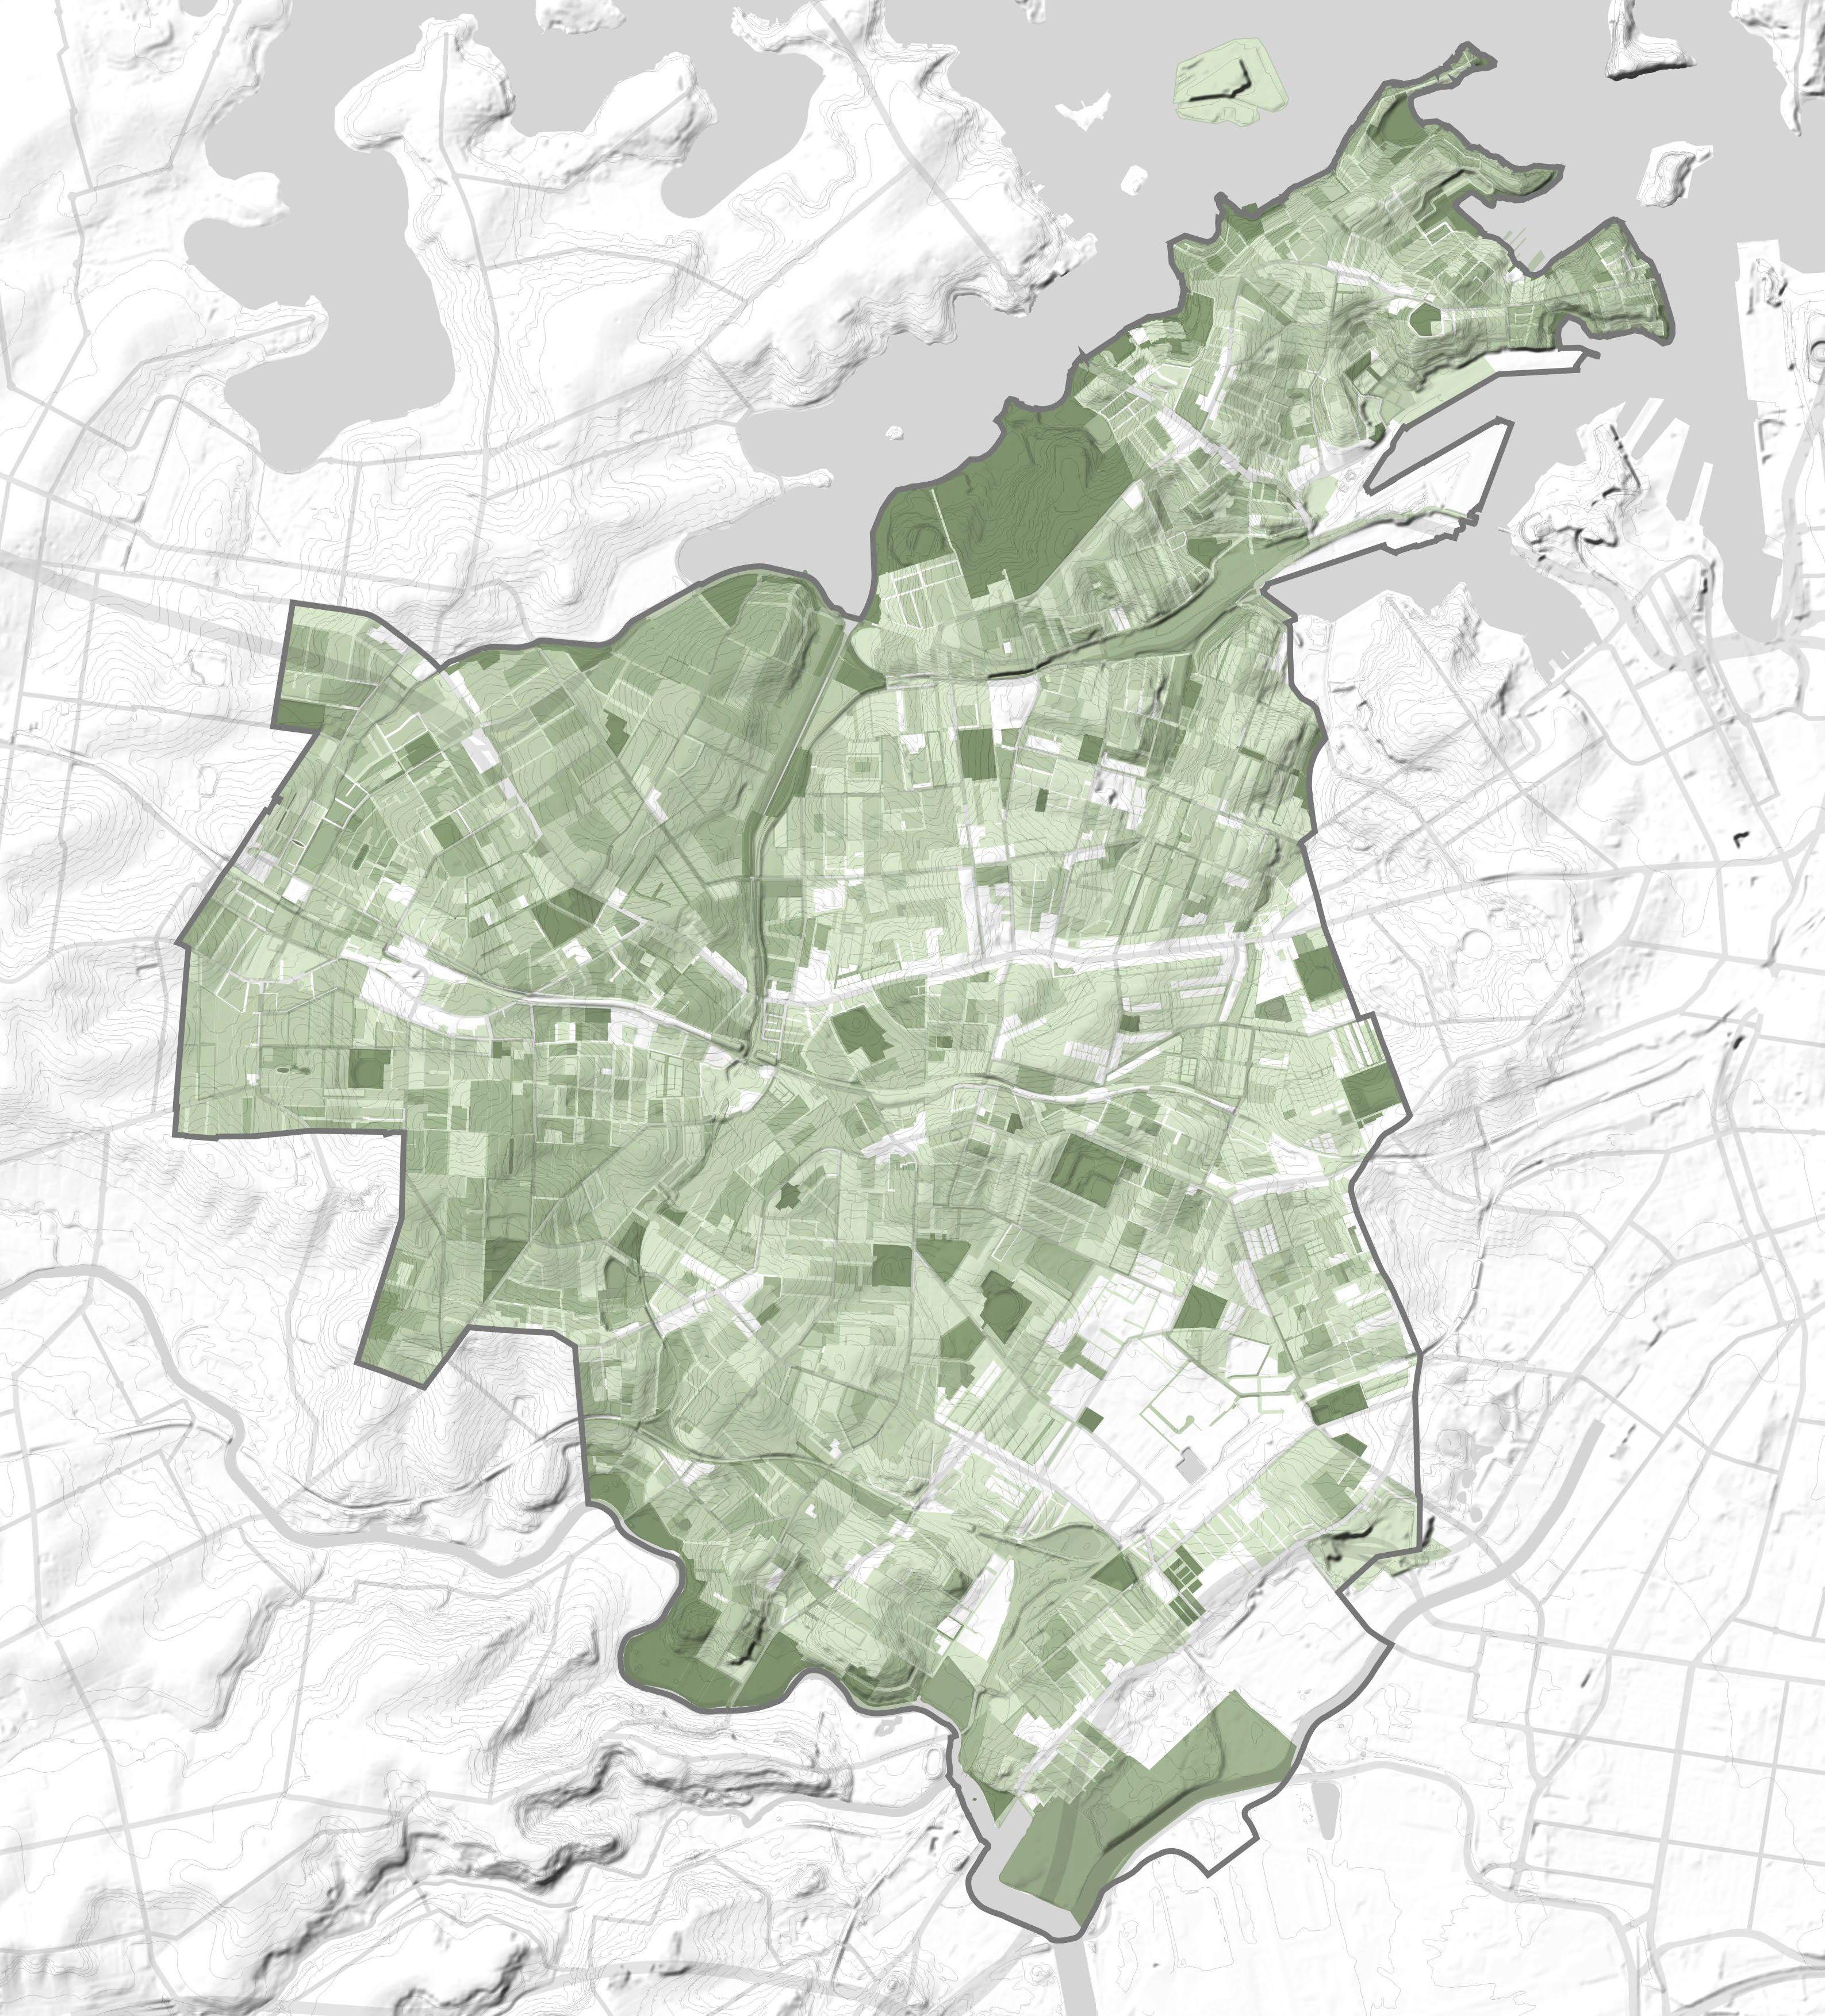
Tree Canopy Cover
Understanding tree canopy in the Inner West shows where existing trees contribute to the Blue-Green Grid, and where the Blue-Green Grid can contribute to areas that lack canopy.
Tree canopy is crucial to providing shady areas and combating urban heat, as well as playing a key role in sequestering carbon.
Tree canopy also provides habitat to tree dwelling animals, which some require consecutive trees in order to move around safely.
Similarly to the preceding vegetation map, shown is a lack of tree canopy on the south eastern side of the Inner West LGA, with East Marrickville, Sydenham and St Peters particularly lacking in tree canopy coverage.
Legend
Inner West LGA Boundary
50%-100% vegetation coverage
30%-50% vegetation coverage
20%-30% vegetation coverage
Inner West Blue-Green Grid Strategy 2023 121
Map source: Shapefile provided by Inner West Council.
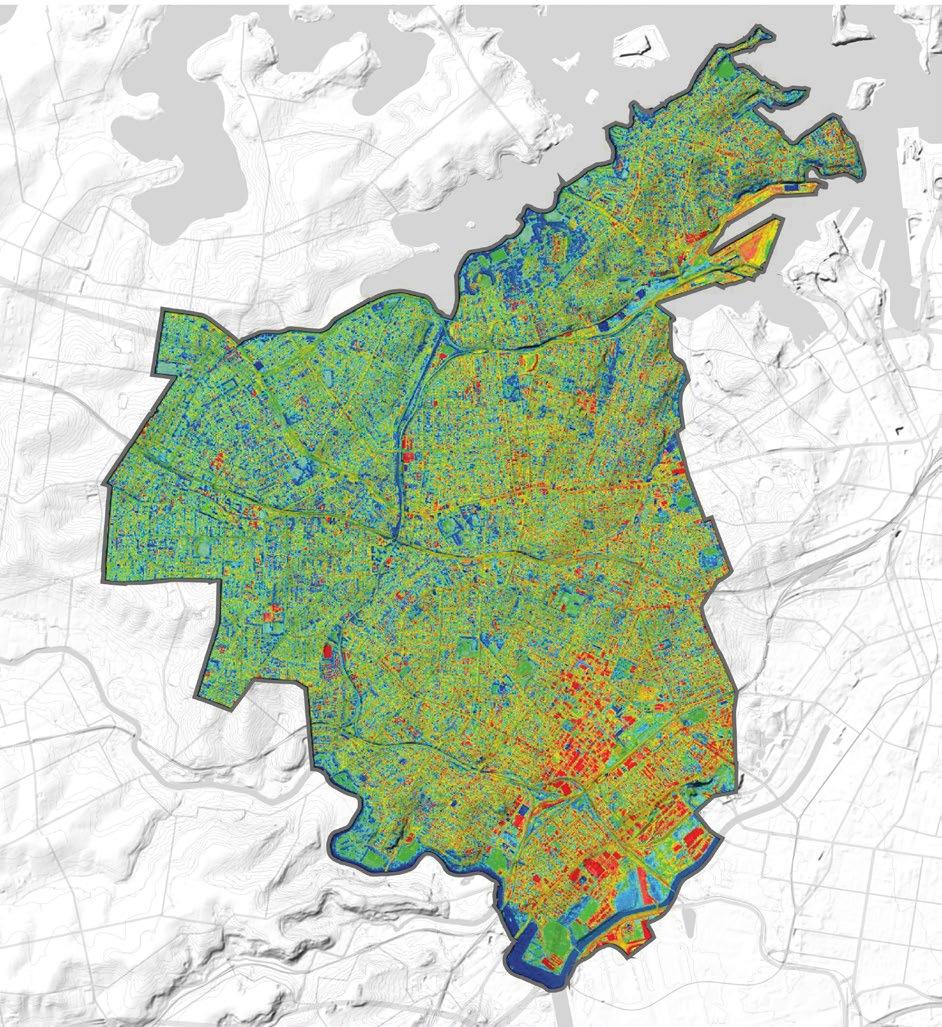
Mapping Layers
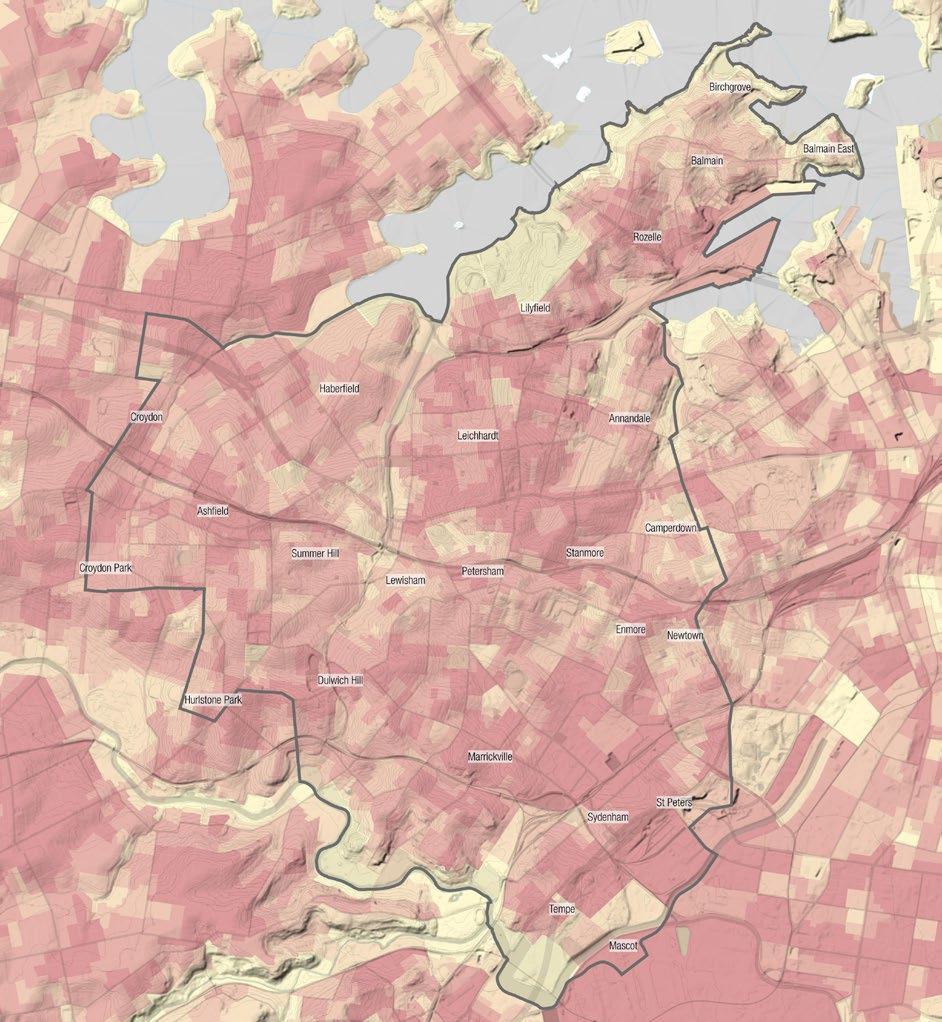
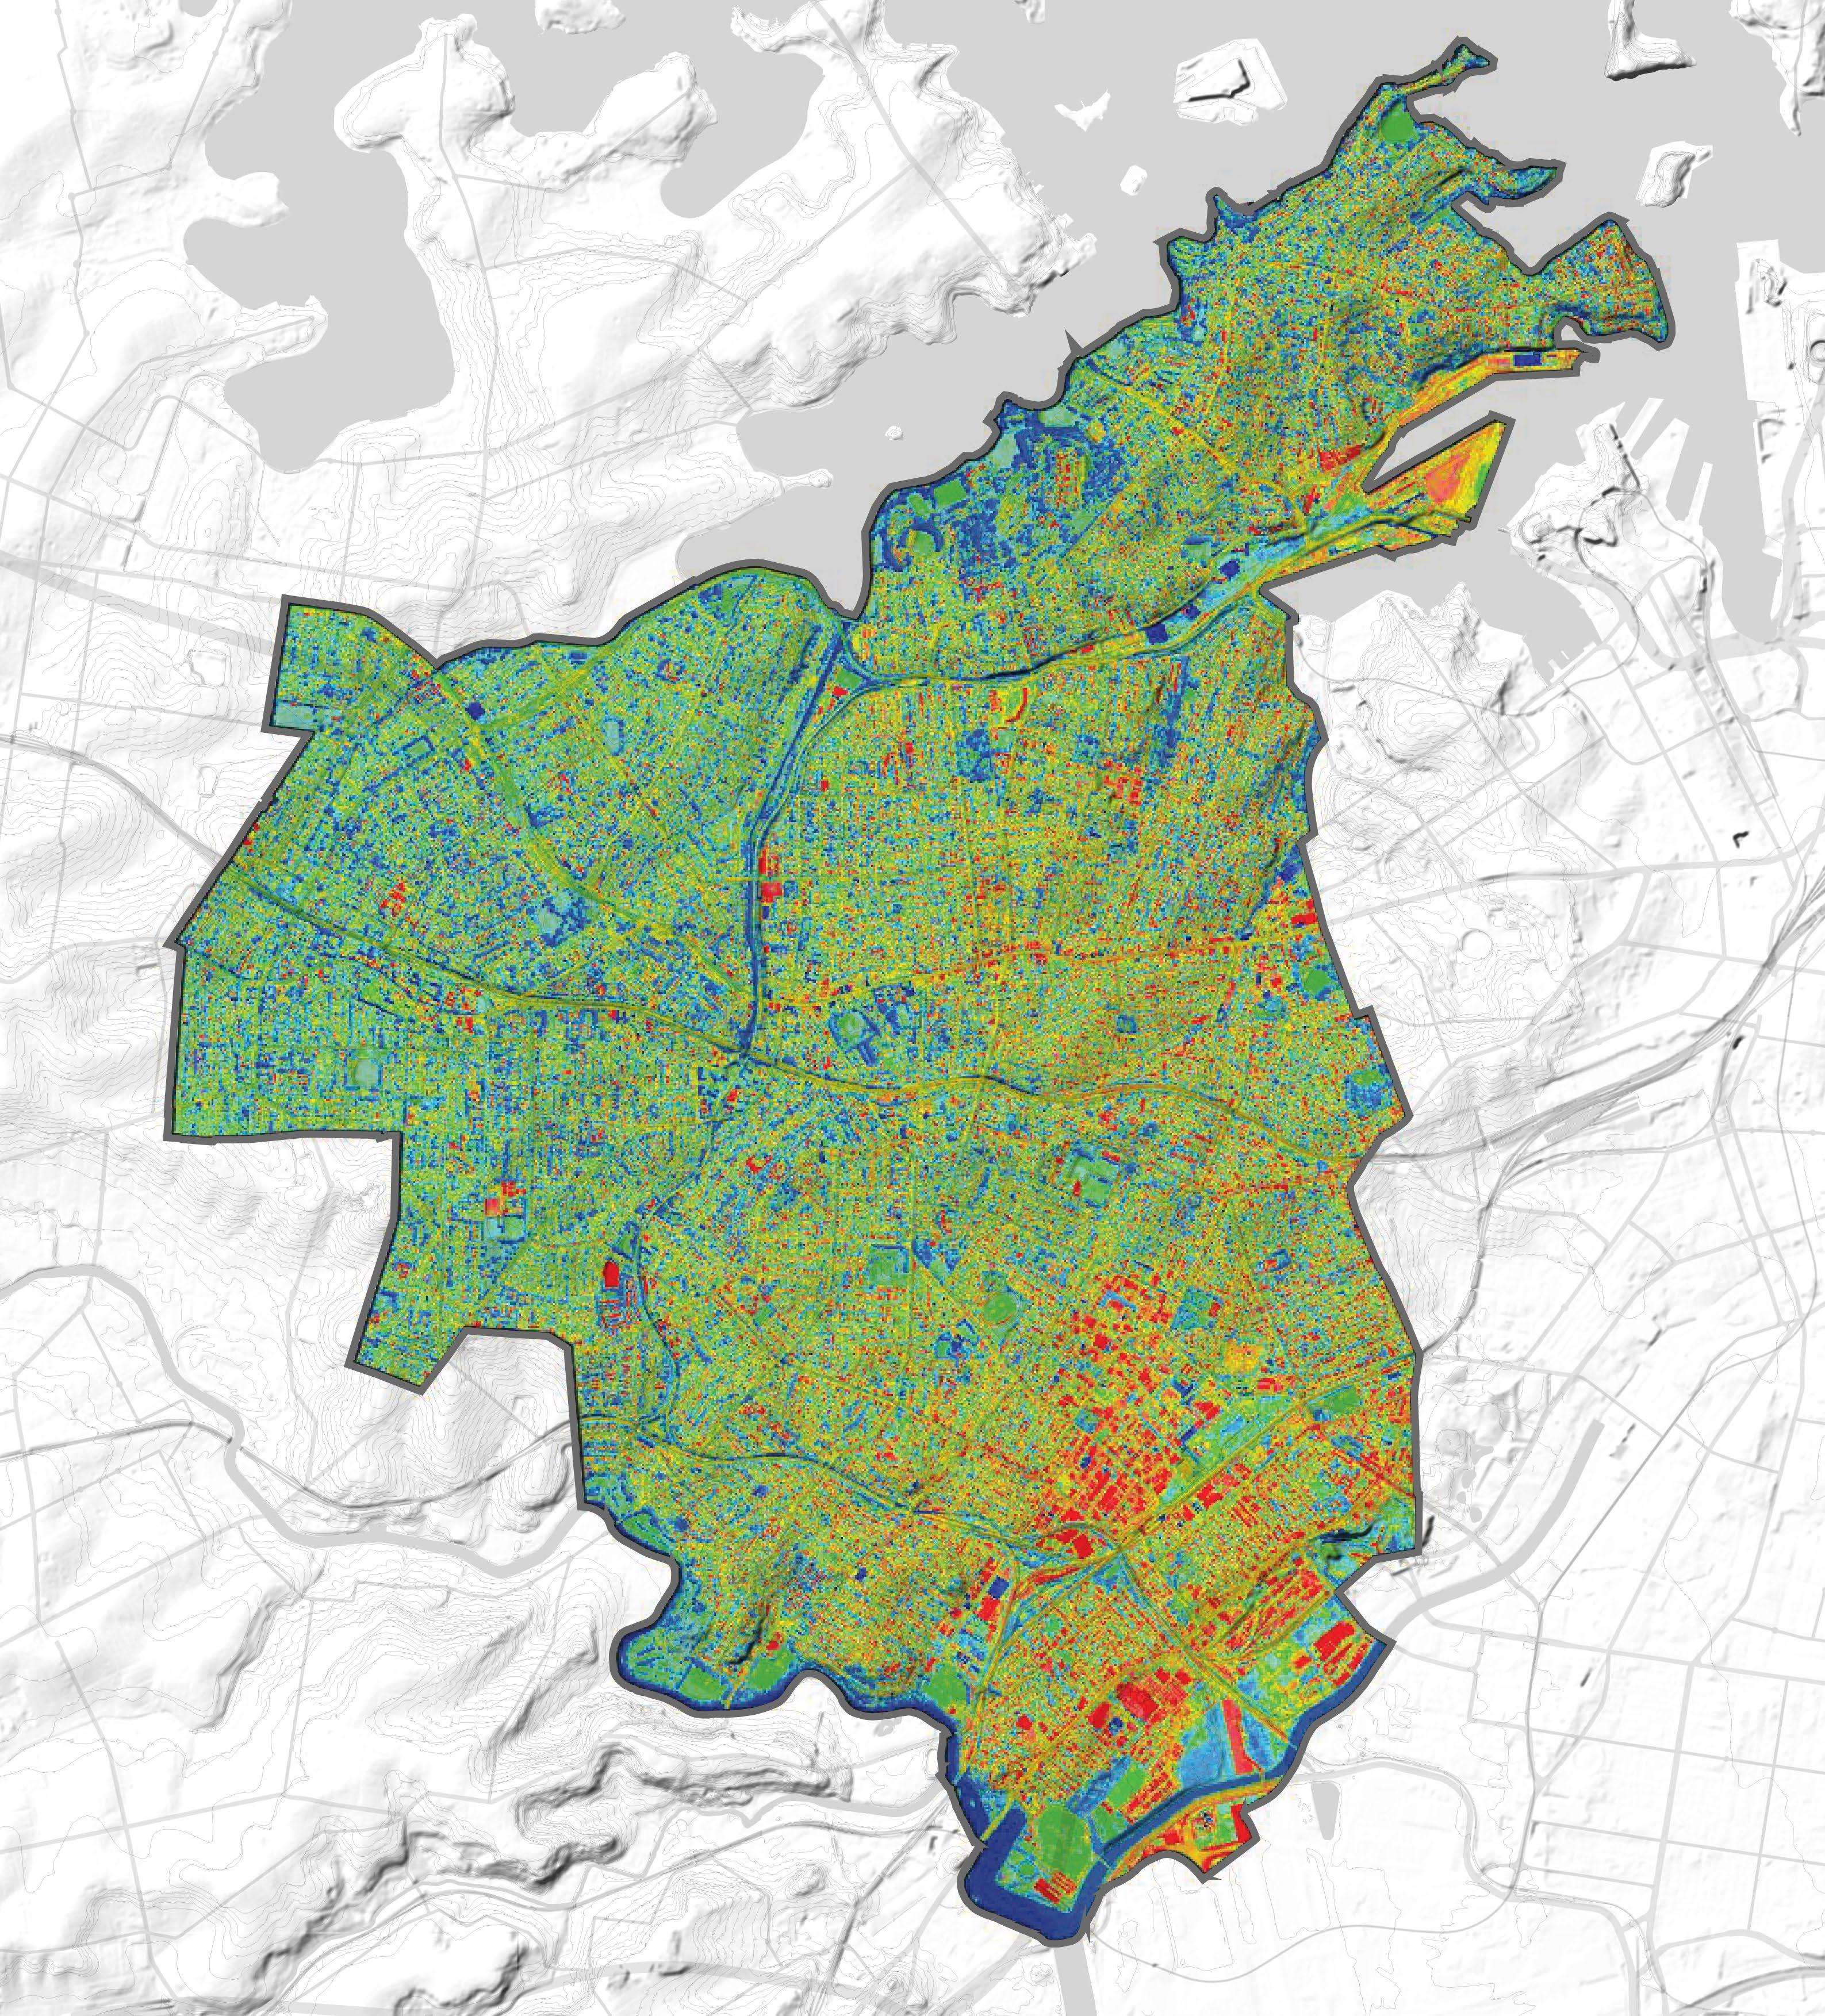
Urban Heat Island
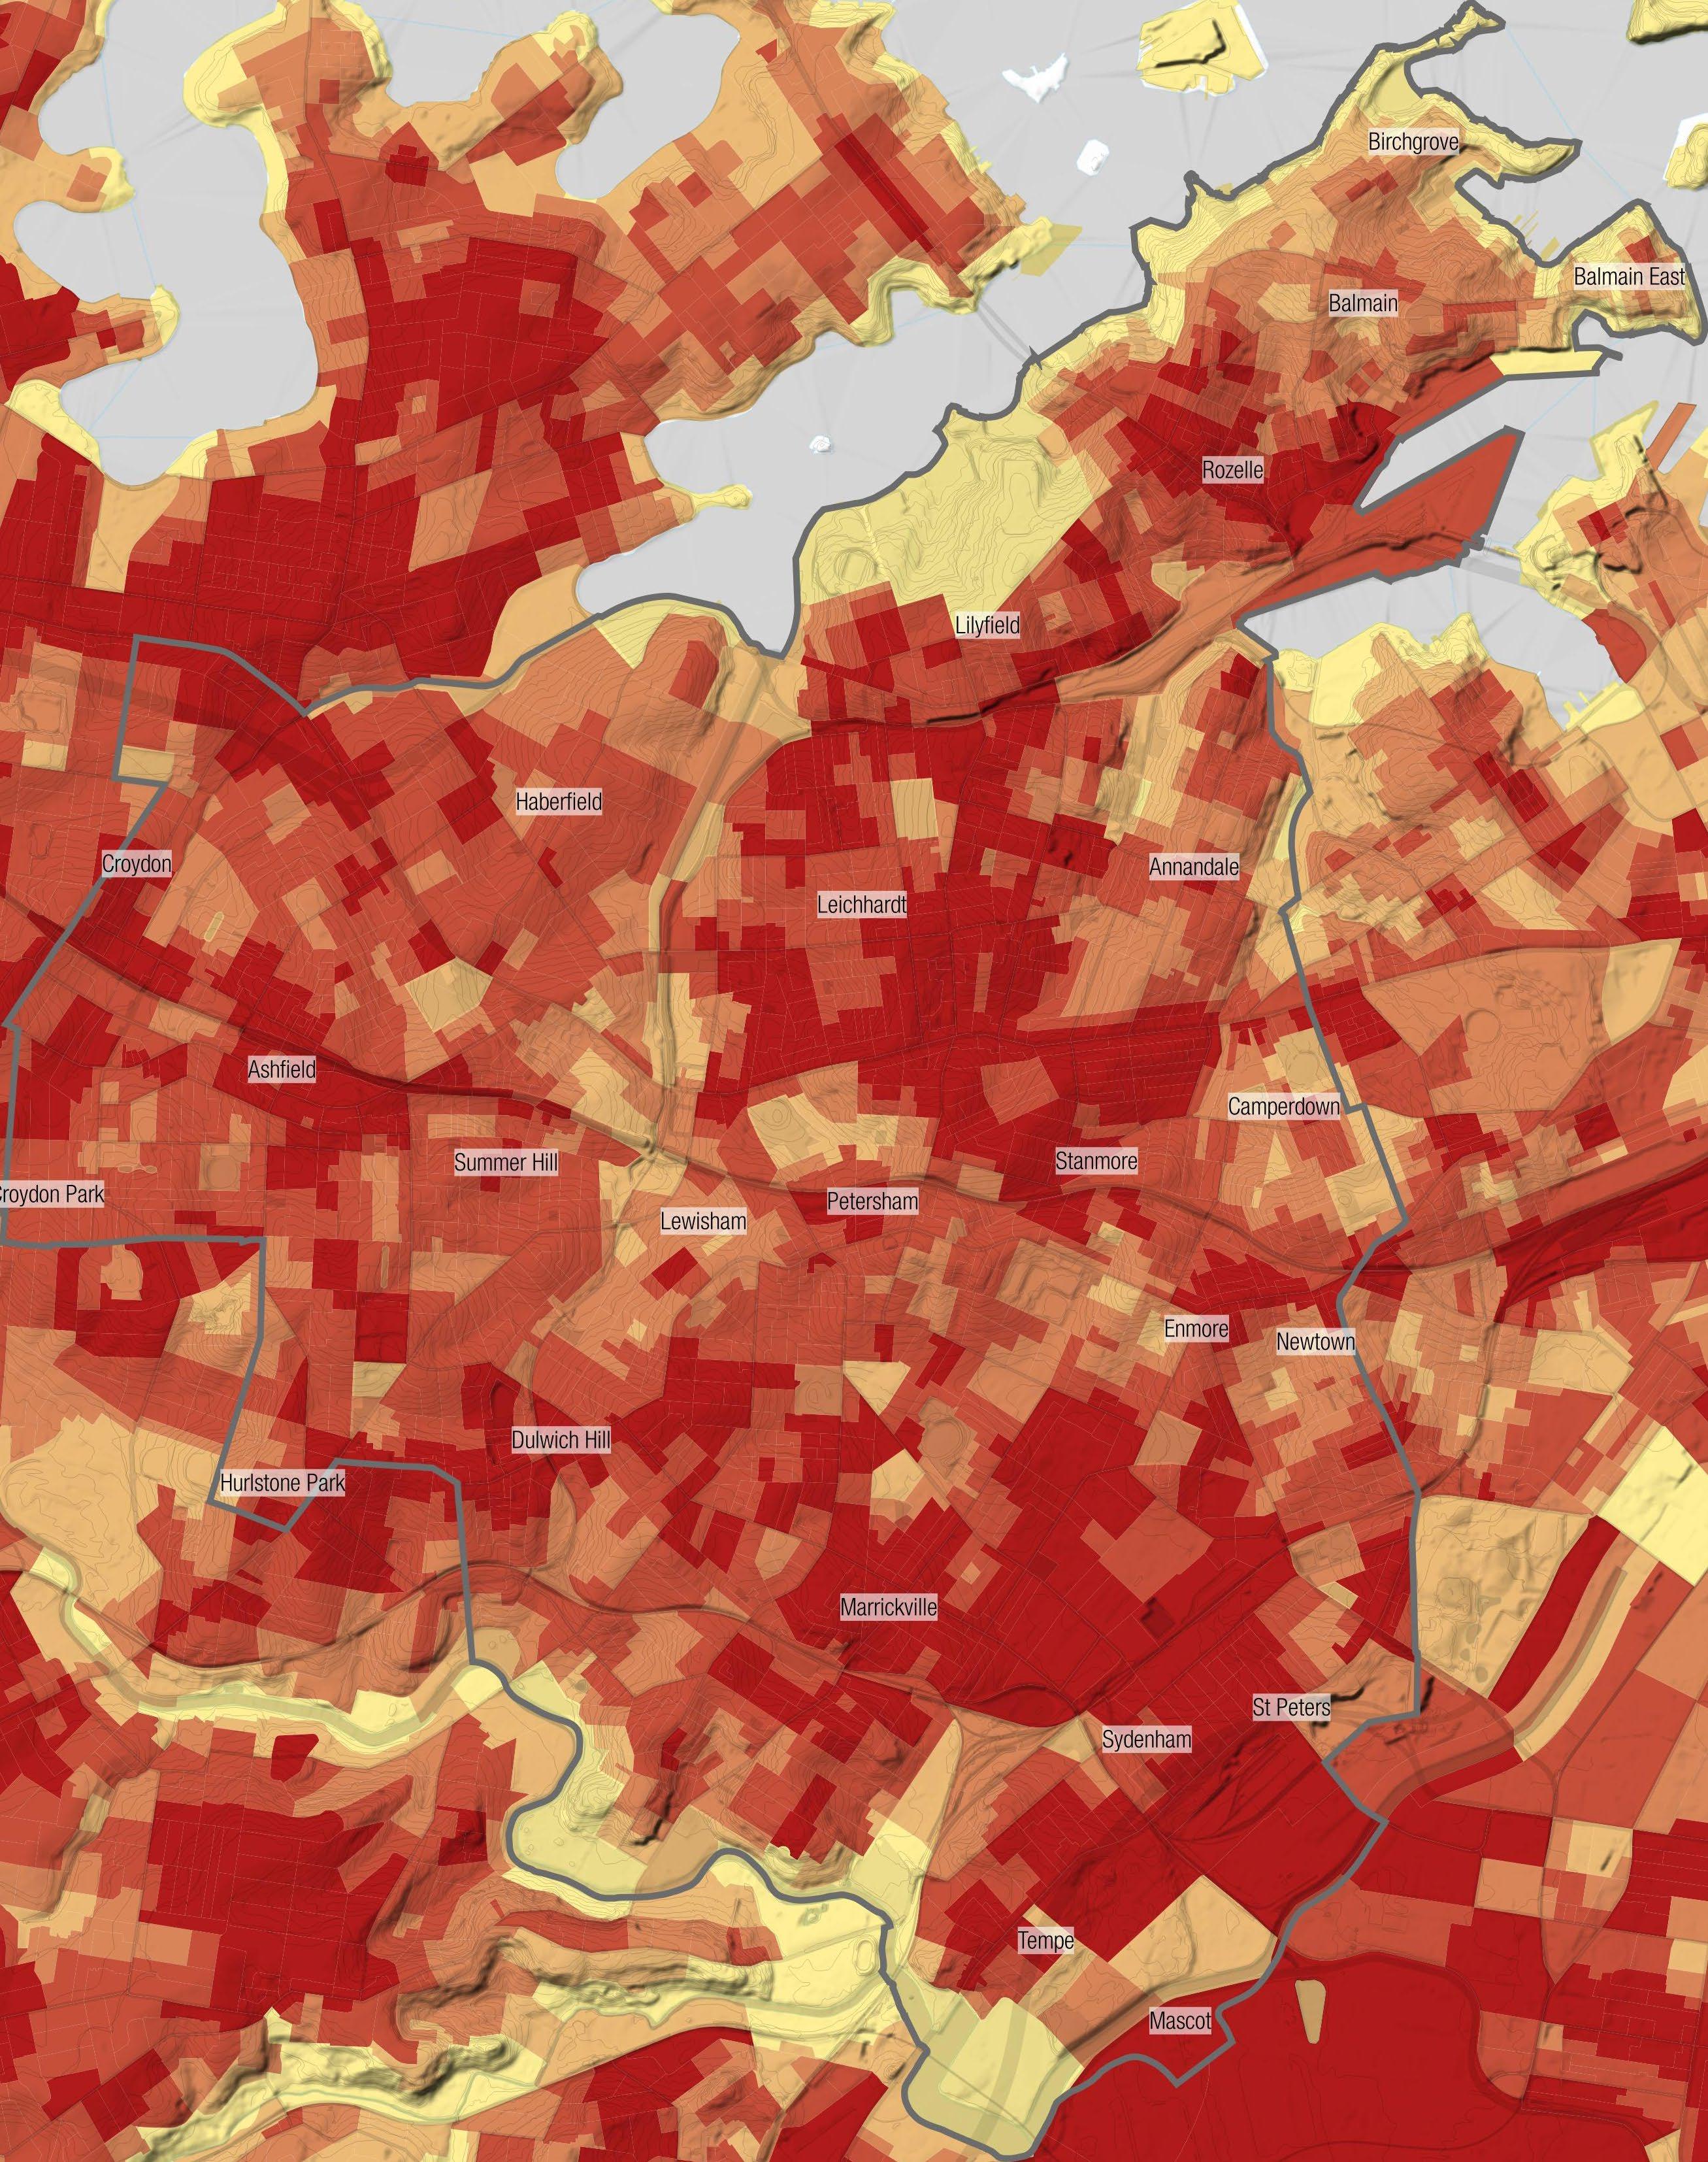
The presence of medium-high density dwellings, industrial and commercial areas and a relative lack of large areas of bushland makes the Inner West susceptible to the Urban Heat Island effect.
The map highly correlates with preceding vegetation and tree canopy maps, where the lack of greenery on the eastern side of the LGA has likely contributed to a higher heat vulnerability, where areas with a higher concentration of greenery and water bodies have a lower heat vulnerability.
Areas with a high Urban Heat Island Effect (UHI) would greatly benefit from the implementation of a BlueGreen Grid, as shown, existing greenery such as found in the GreenWay, around the cooks river and the northern point with a high concentration of parks.
Legend Inner West LGA Boundary 0 - 5.08 UHI* 5.08 - 6.78 UHI* 6.78 - 7.73 UHI* 7.73 - 8.54 UHI* 8.54 - 12.71 UHI*
Map source: NSW Government Dataset, 2016.
Mapping Layers
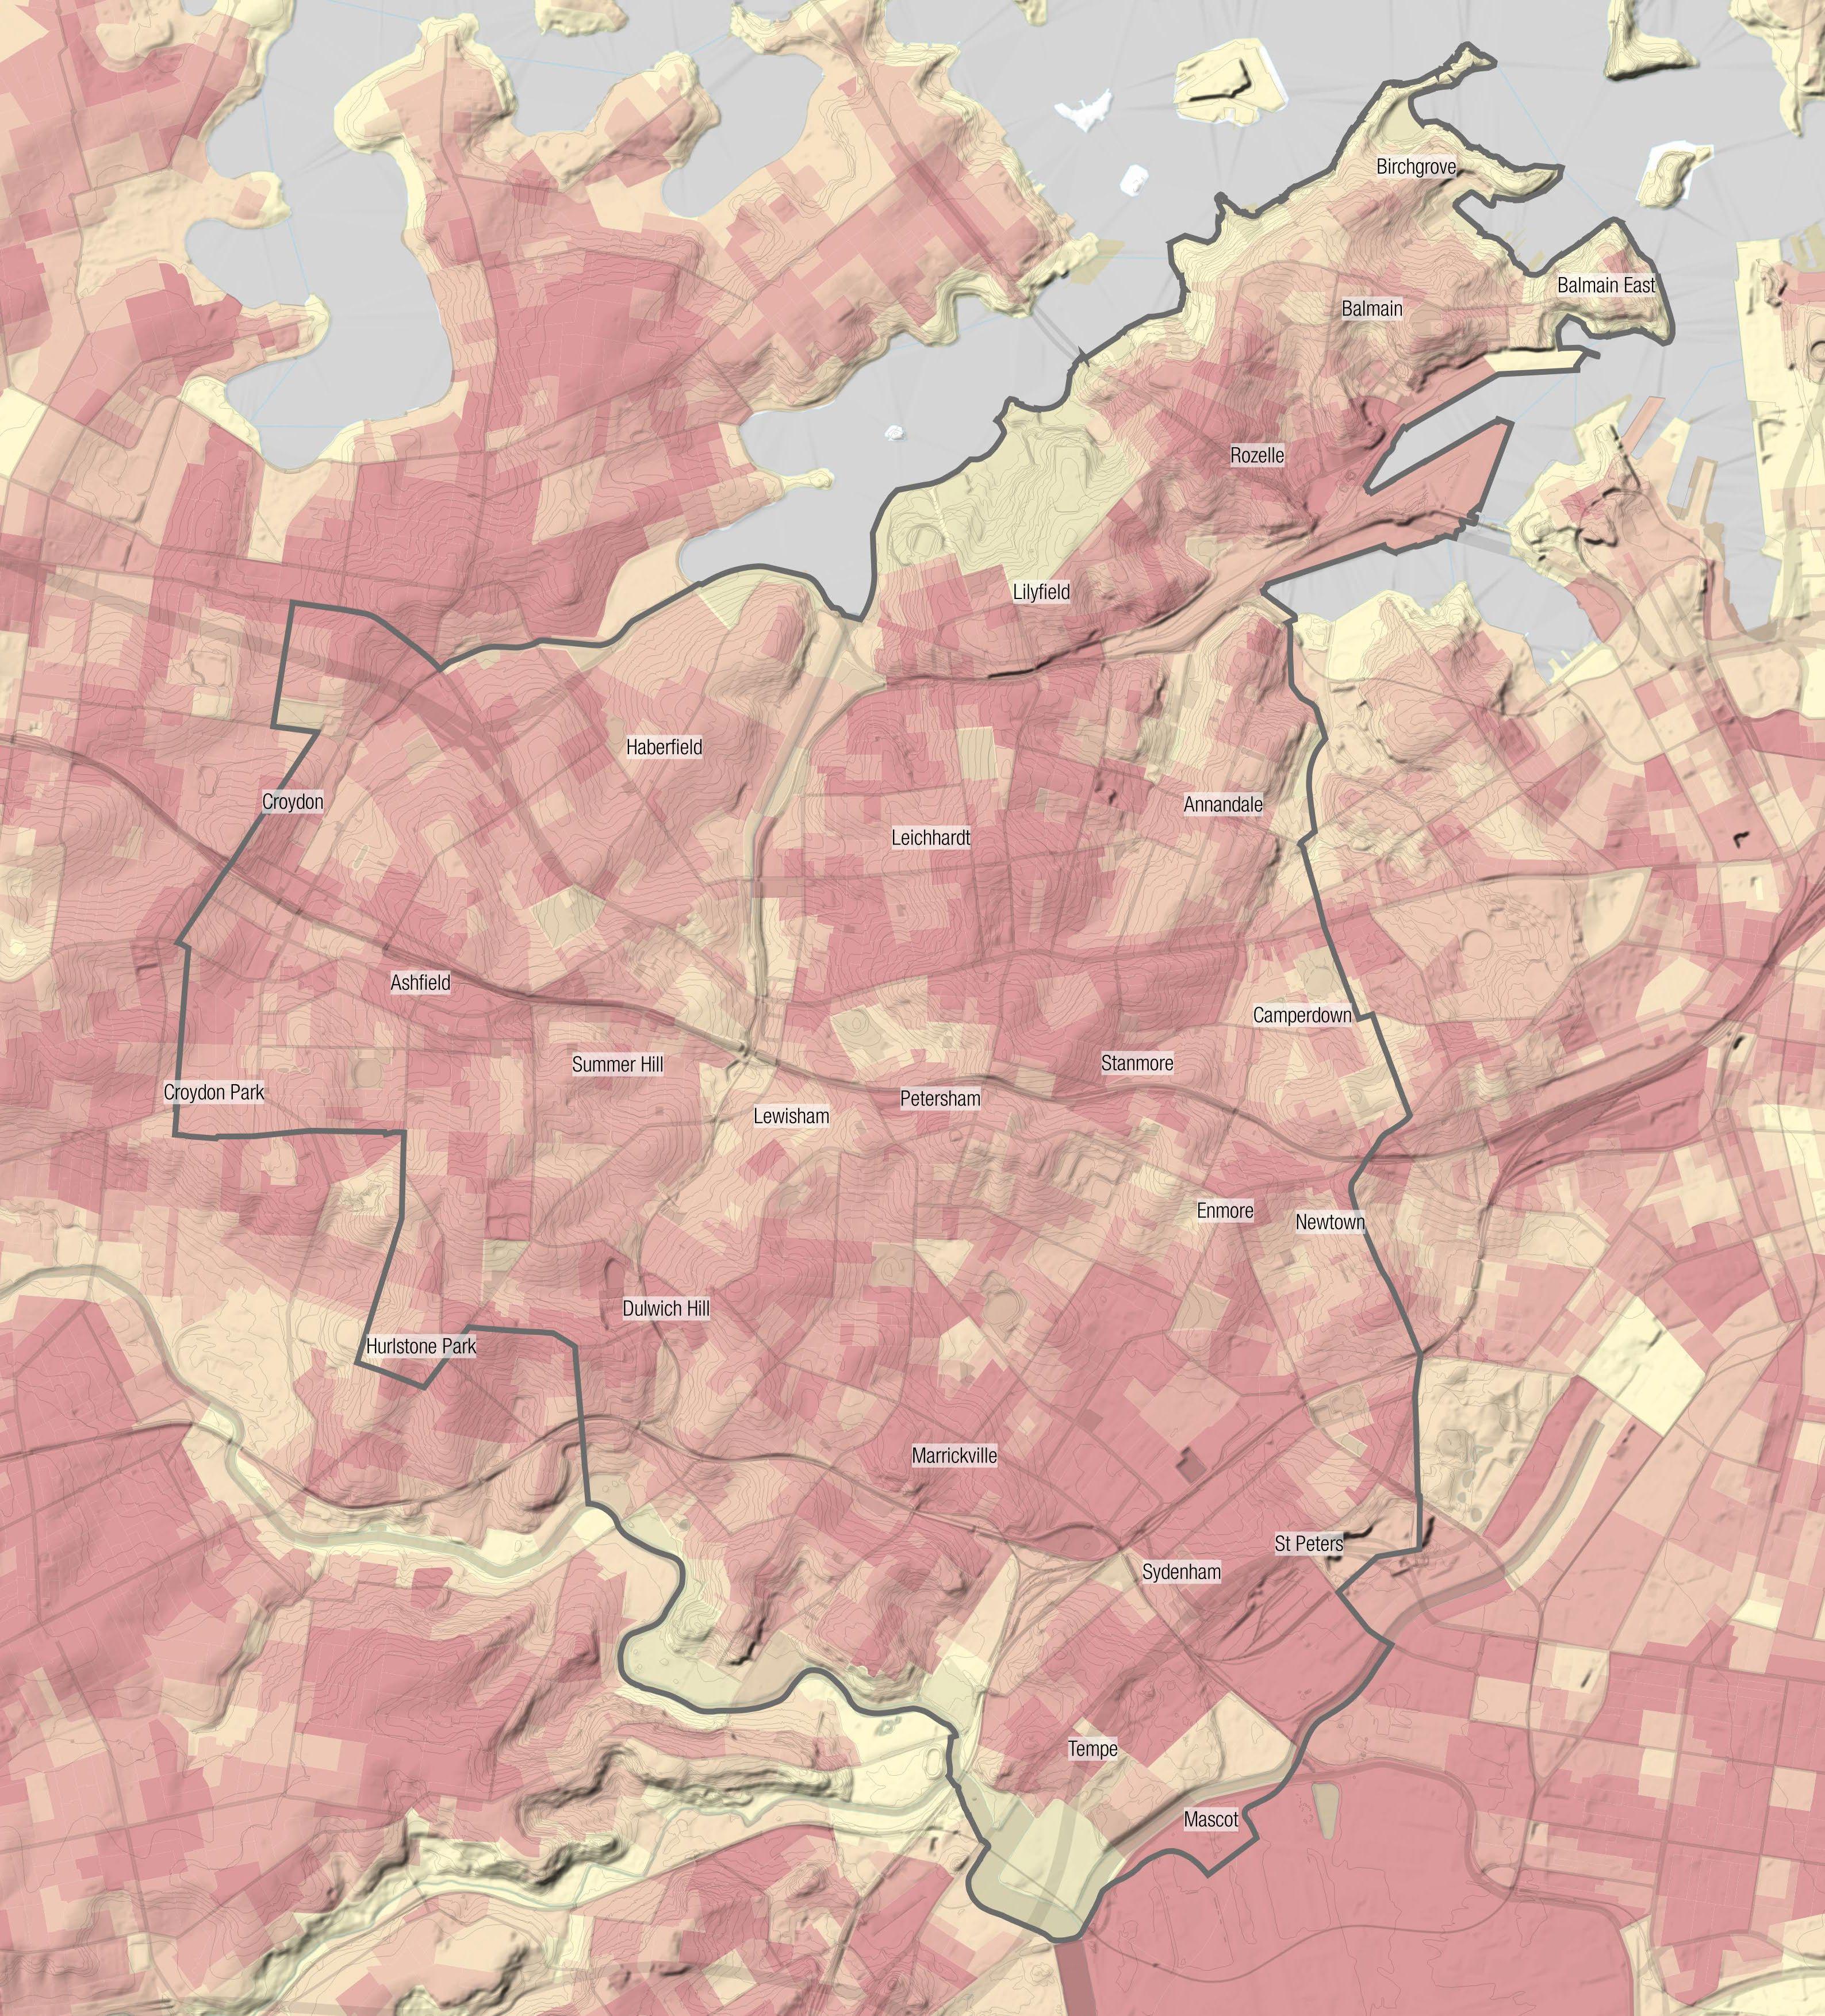
Heat Map
Similarly to the UHI map, the map highly correlates with preceding vegetation and tree canopy maps, where the lack of greenery on the eastern side of the LGA has likely contributed to a higher heat vulnerability, where areas with a higher concentration of greenery and water bodies have a lower heat vulnerability. Areas of high urban heat would benefit from the implementation of greenery associated with the BlueGreen Grid.
Map source: Inner West Council
Legend
Inner West LGA Boundary
Inner West Blue-Green Grid Strategy 2023 123
Hurlstone Park
Croydon Park
Camperdown
Balmain East
Summer Hill
Dulwich Hill
Marrickville
Petersham
Birchgrove
Annandale
Sydenham
Leichhardt Lewisham
Stanmore Newtown
St Peters
Croydon
Balmain
Enmore
Mascot
Rozelle
Tempe
30°C 41°C
20°C
Mapping Layers
White Bay Eco-Corridor
White Bay Eco-corridor can contribute as ecological links.
Map source: https://glebesociety.org.au/updateproposed-eco-corridor-as-part-of-the-future-forbays-west/
Legend
Inner West LGA Boundary
White Bay eco-corridor
Bays West eco-corridors
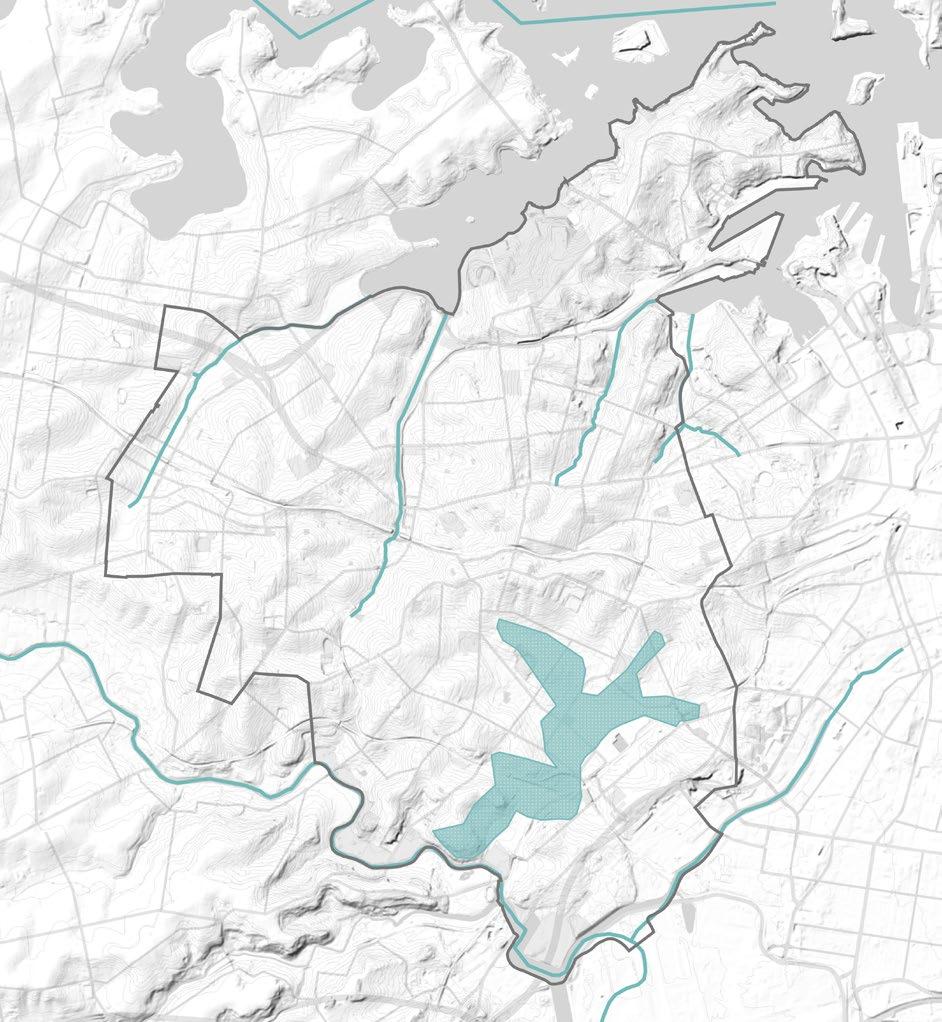
Mapping Layers
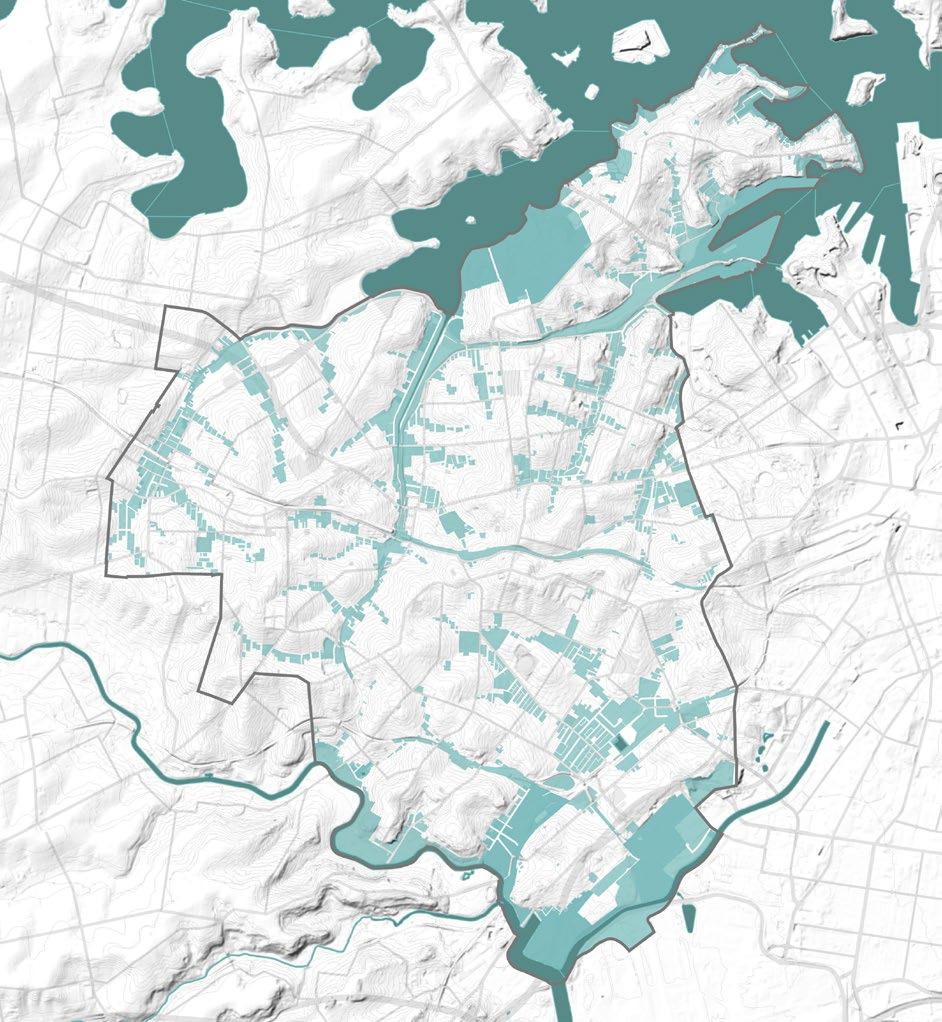
Hydrological Network
The Blue-Green Grid inevitably will create a hydrological network. The implementation of the BlueGreen Grid will provide an opportunity to rejuvenate the struggling waterways, bringing together ecology with hydrology to aid in the nitrogen cycle.
Utilising the water network and where water naturally collects, will indicate areas that will benefit from the application of a the Blue-Green Grid to reduce flooding, naturally provide water to plants and enhance the interaction between plants and water which will contribute to lowering urban heat.
Six main water corridors are identified in the area, representing key hydrological network.
Flooding areas can be mitigated and indicate opportunities for implementation of Blue-Green corridors.
Notably, flooding occurs at the site which was previously a swamp (see Indigenous Historical Hydrological Systems Map).
Map source: Shapefiles provided by Inner West Council.
Inner West LGA Boundary Water bodies Creeks
Flooding Extent
Inner West Blue-Green Grid Strategy 2023 125
Legend
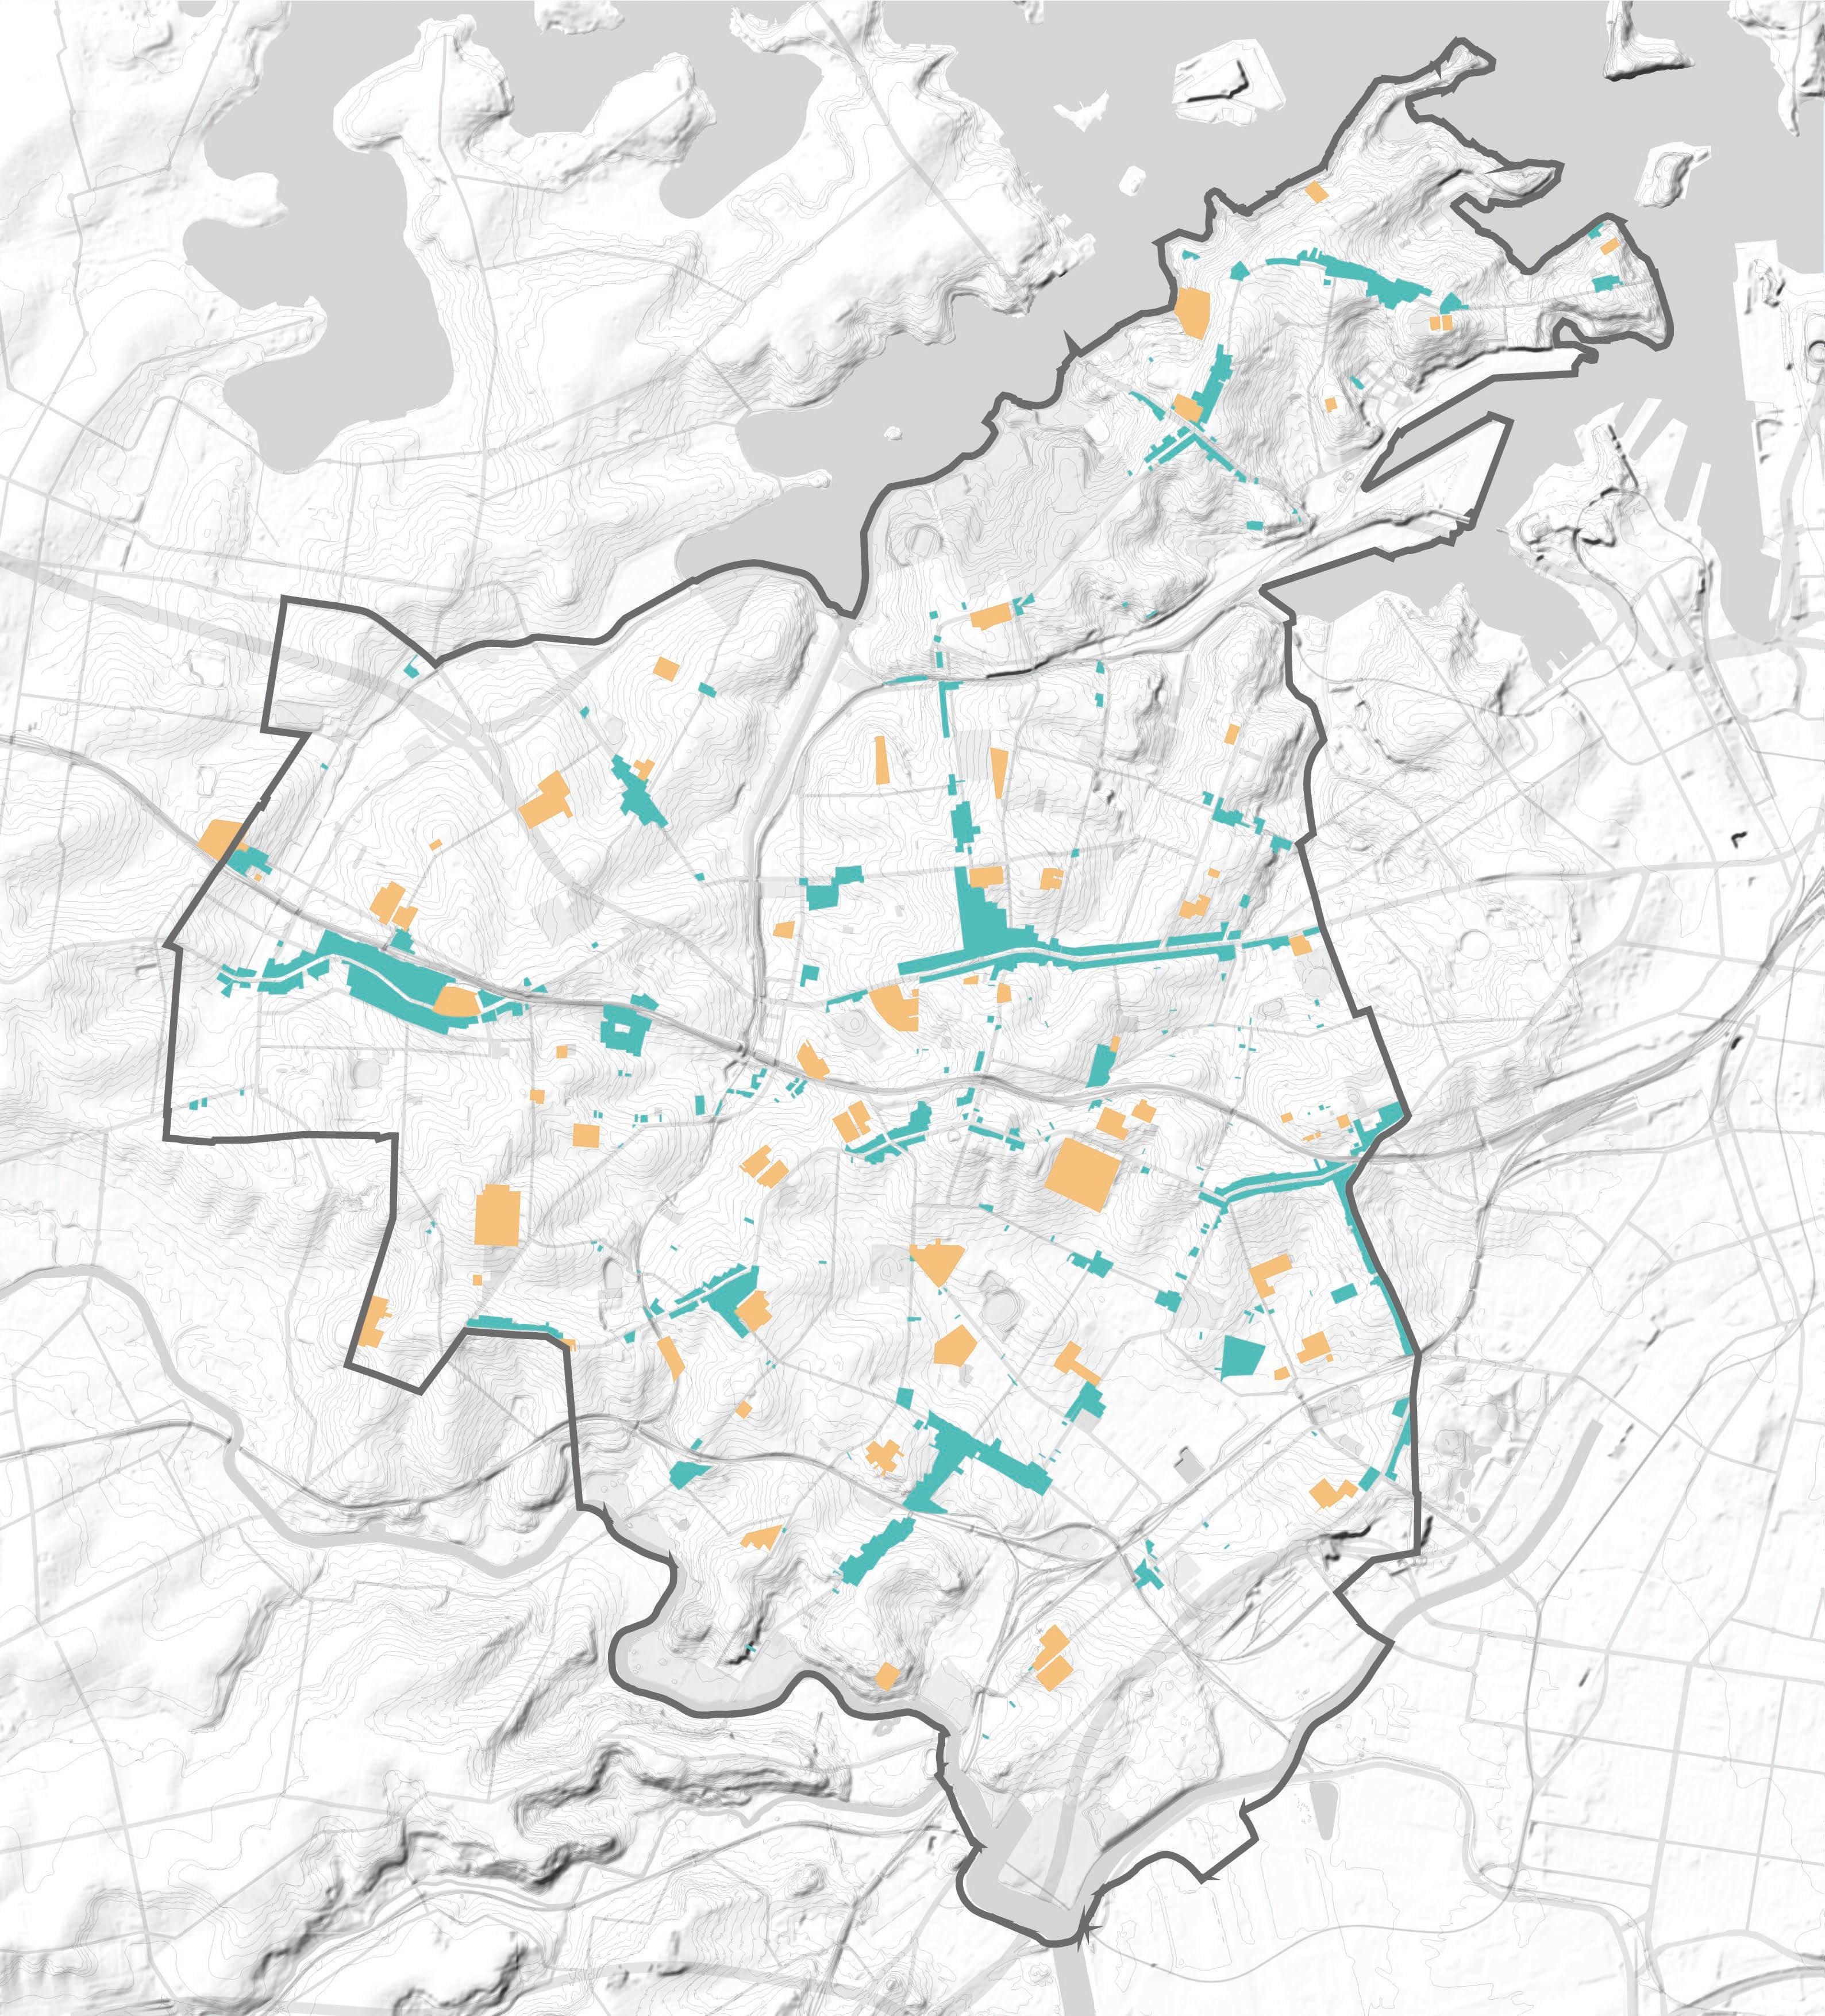
Mapping Layers
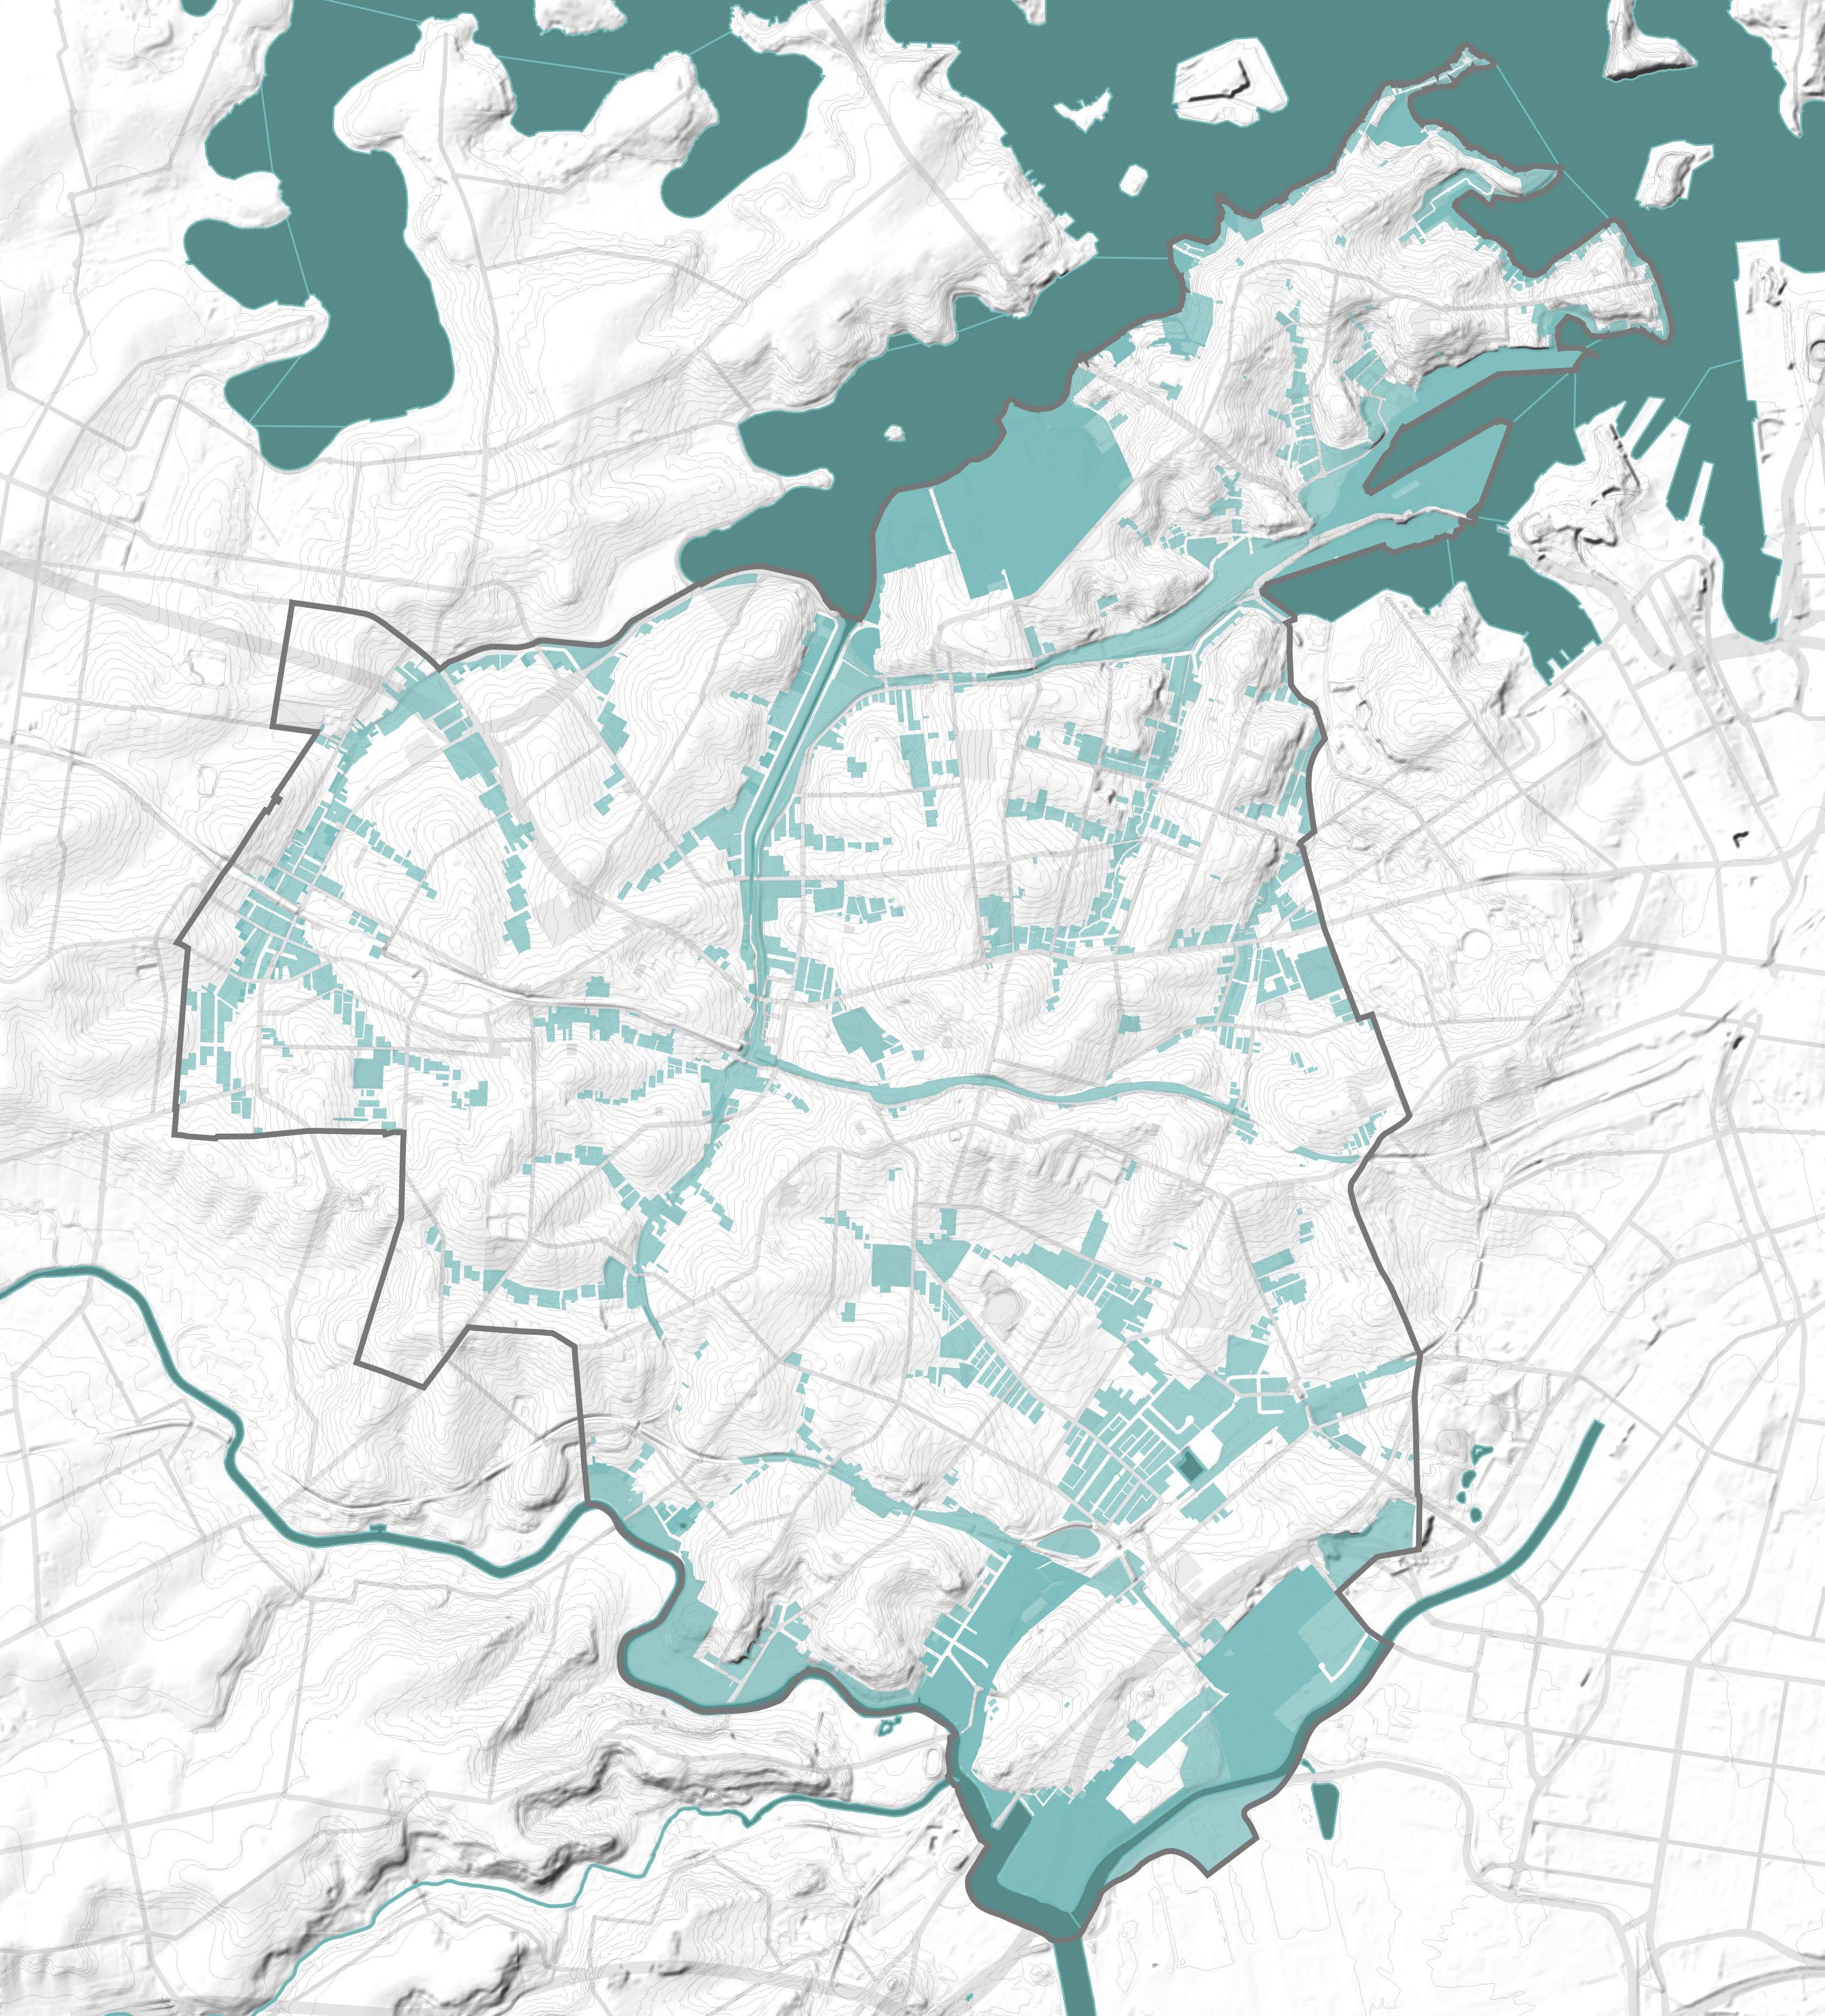
Permeable Surfaces
Understanding where less permeable surfaces are which correlates with flooding.
Map source: Inner West Council.
Legend
Inner West LGA Boundary
Previous Area
Impervious Area
Open Water
Hurlstone Park
Croydon Park
Camperdown
Balmain East
Summer Hill
Dulwich Hill
Marrickville
Petersham
Birchgrove
Annandale
Sydenham
Leichhardt Lewisham
Stanmore
Newtown
St Peters
Croydon
Balmain
Enmore
Mascot
Rozelle
Tempe
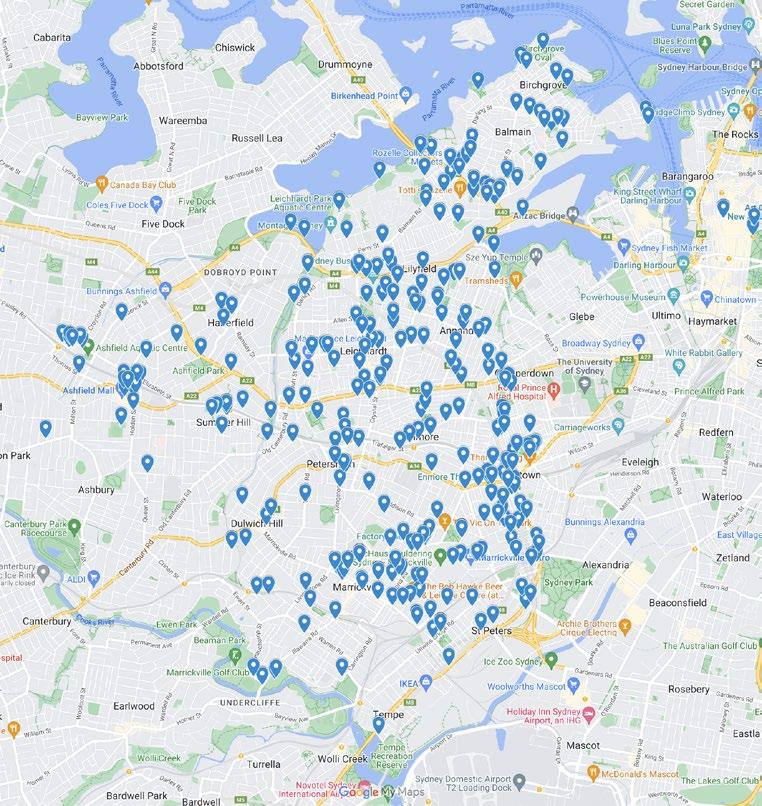
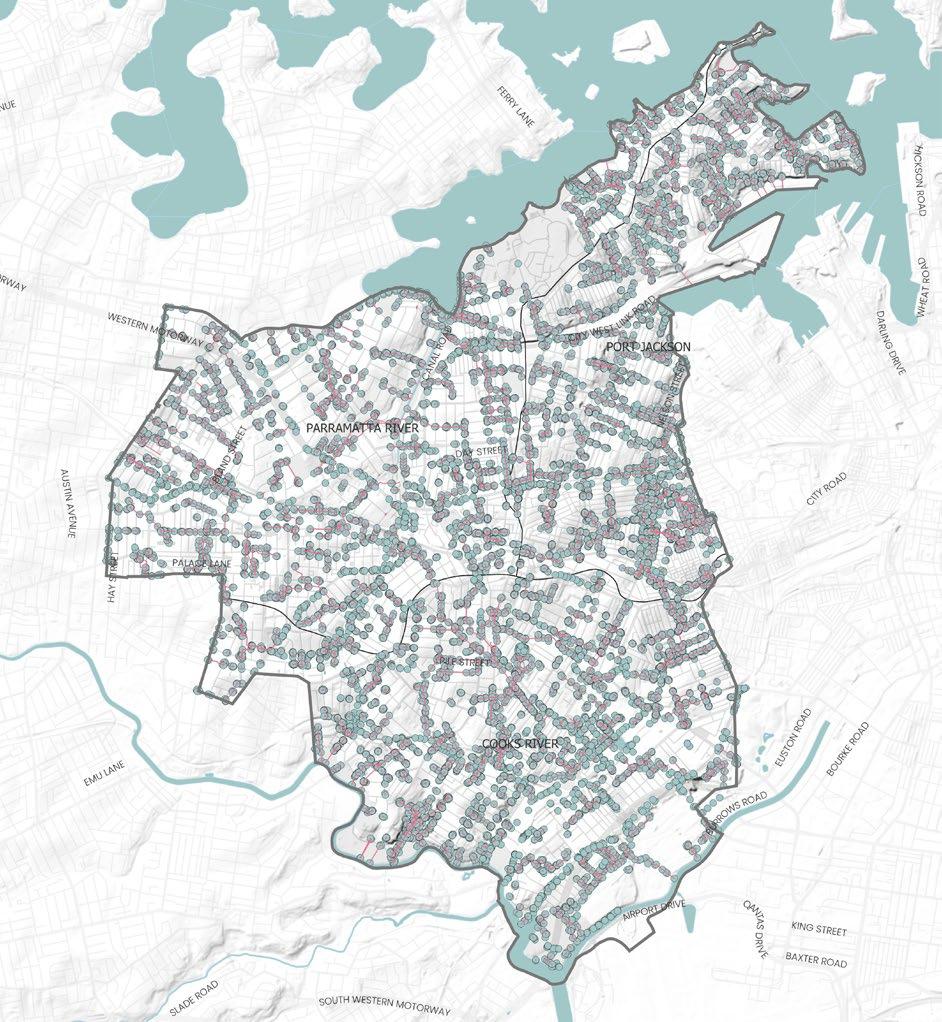
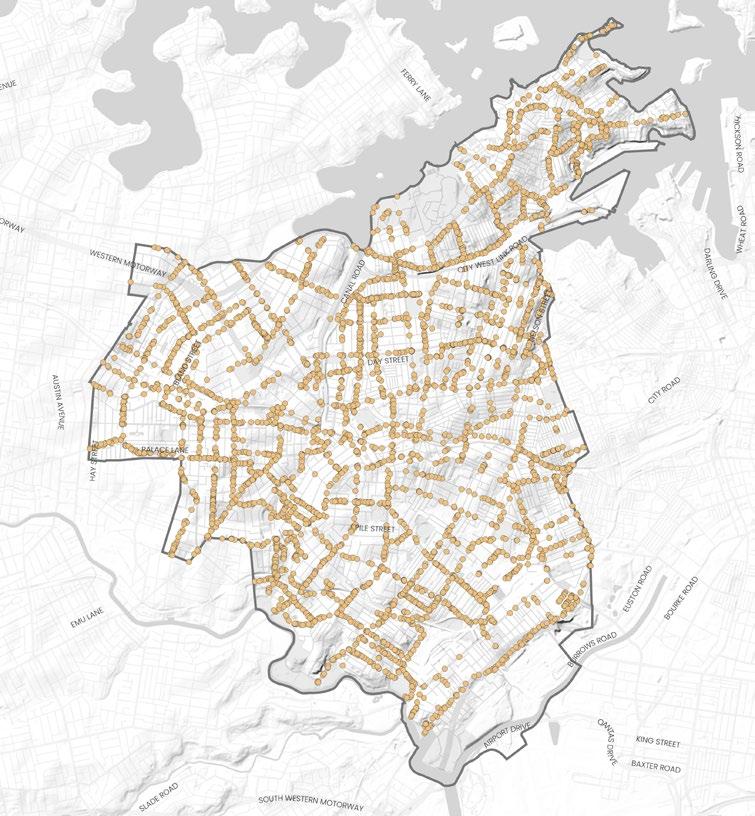
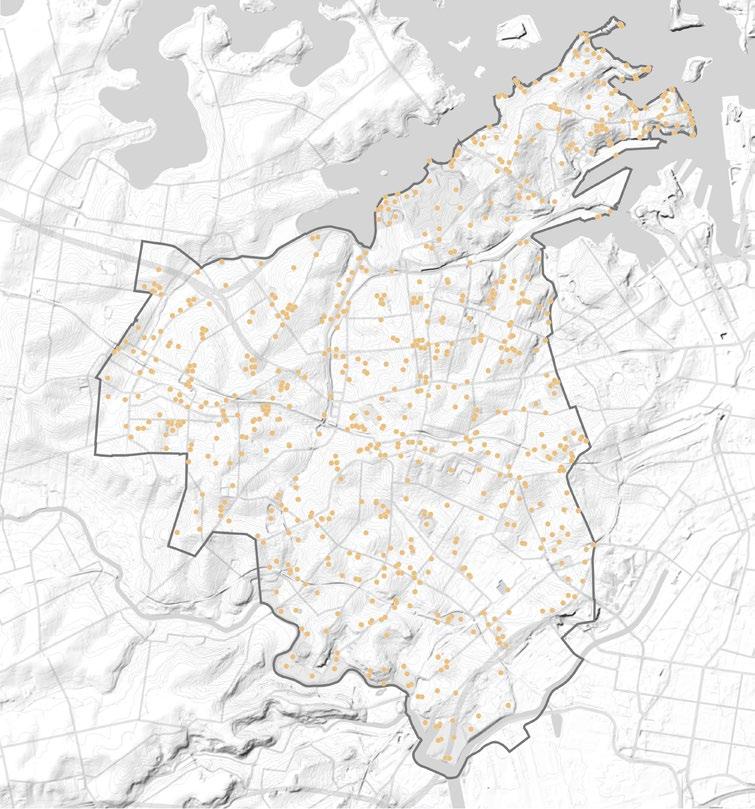
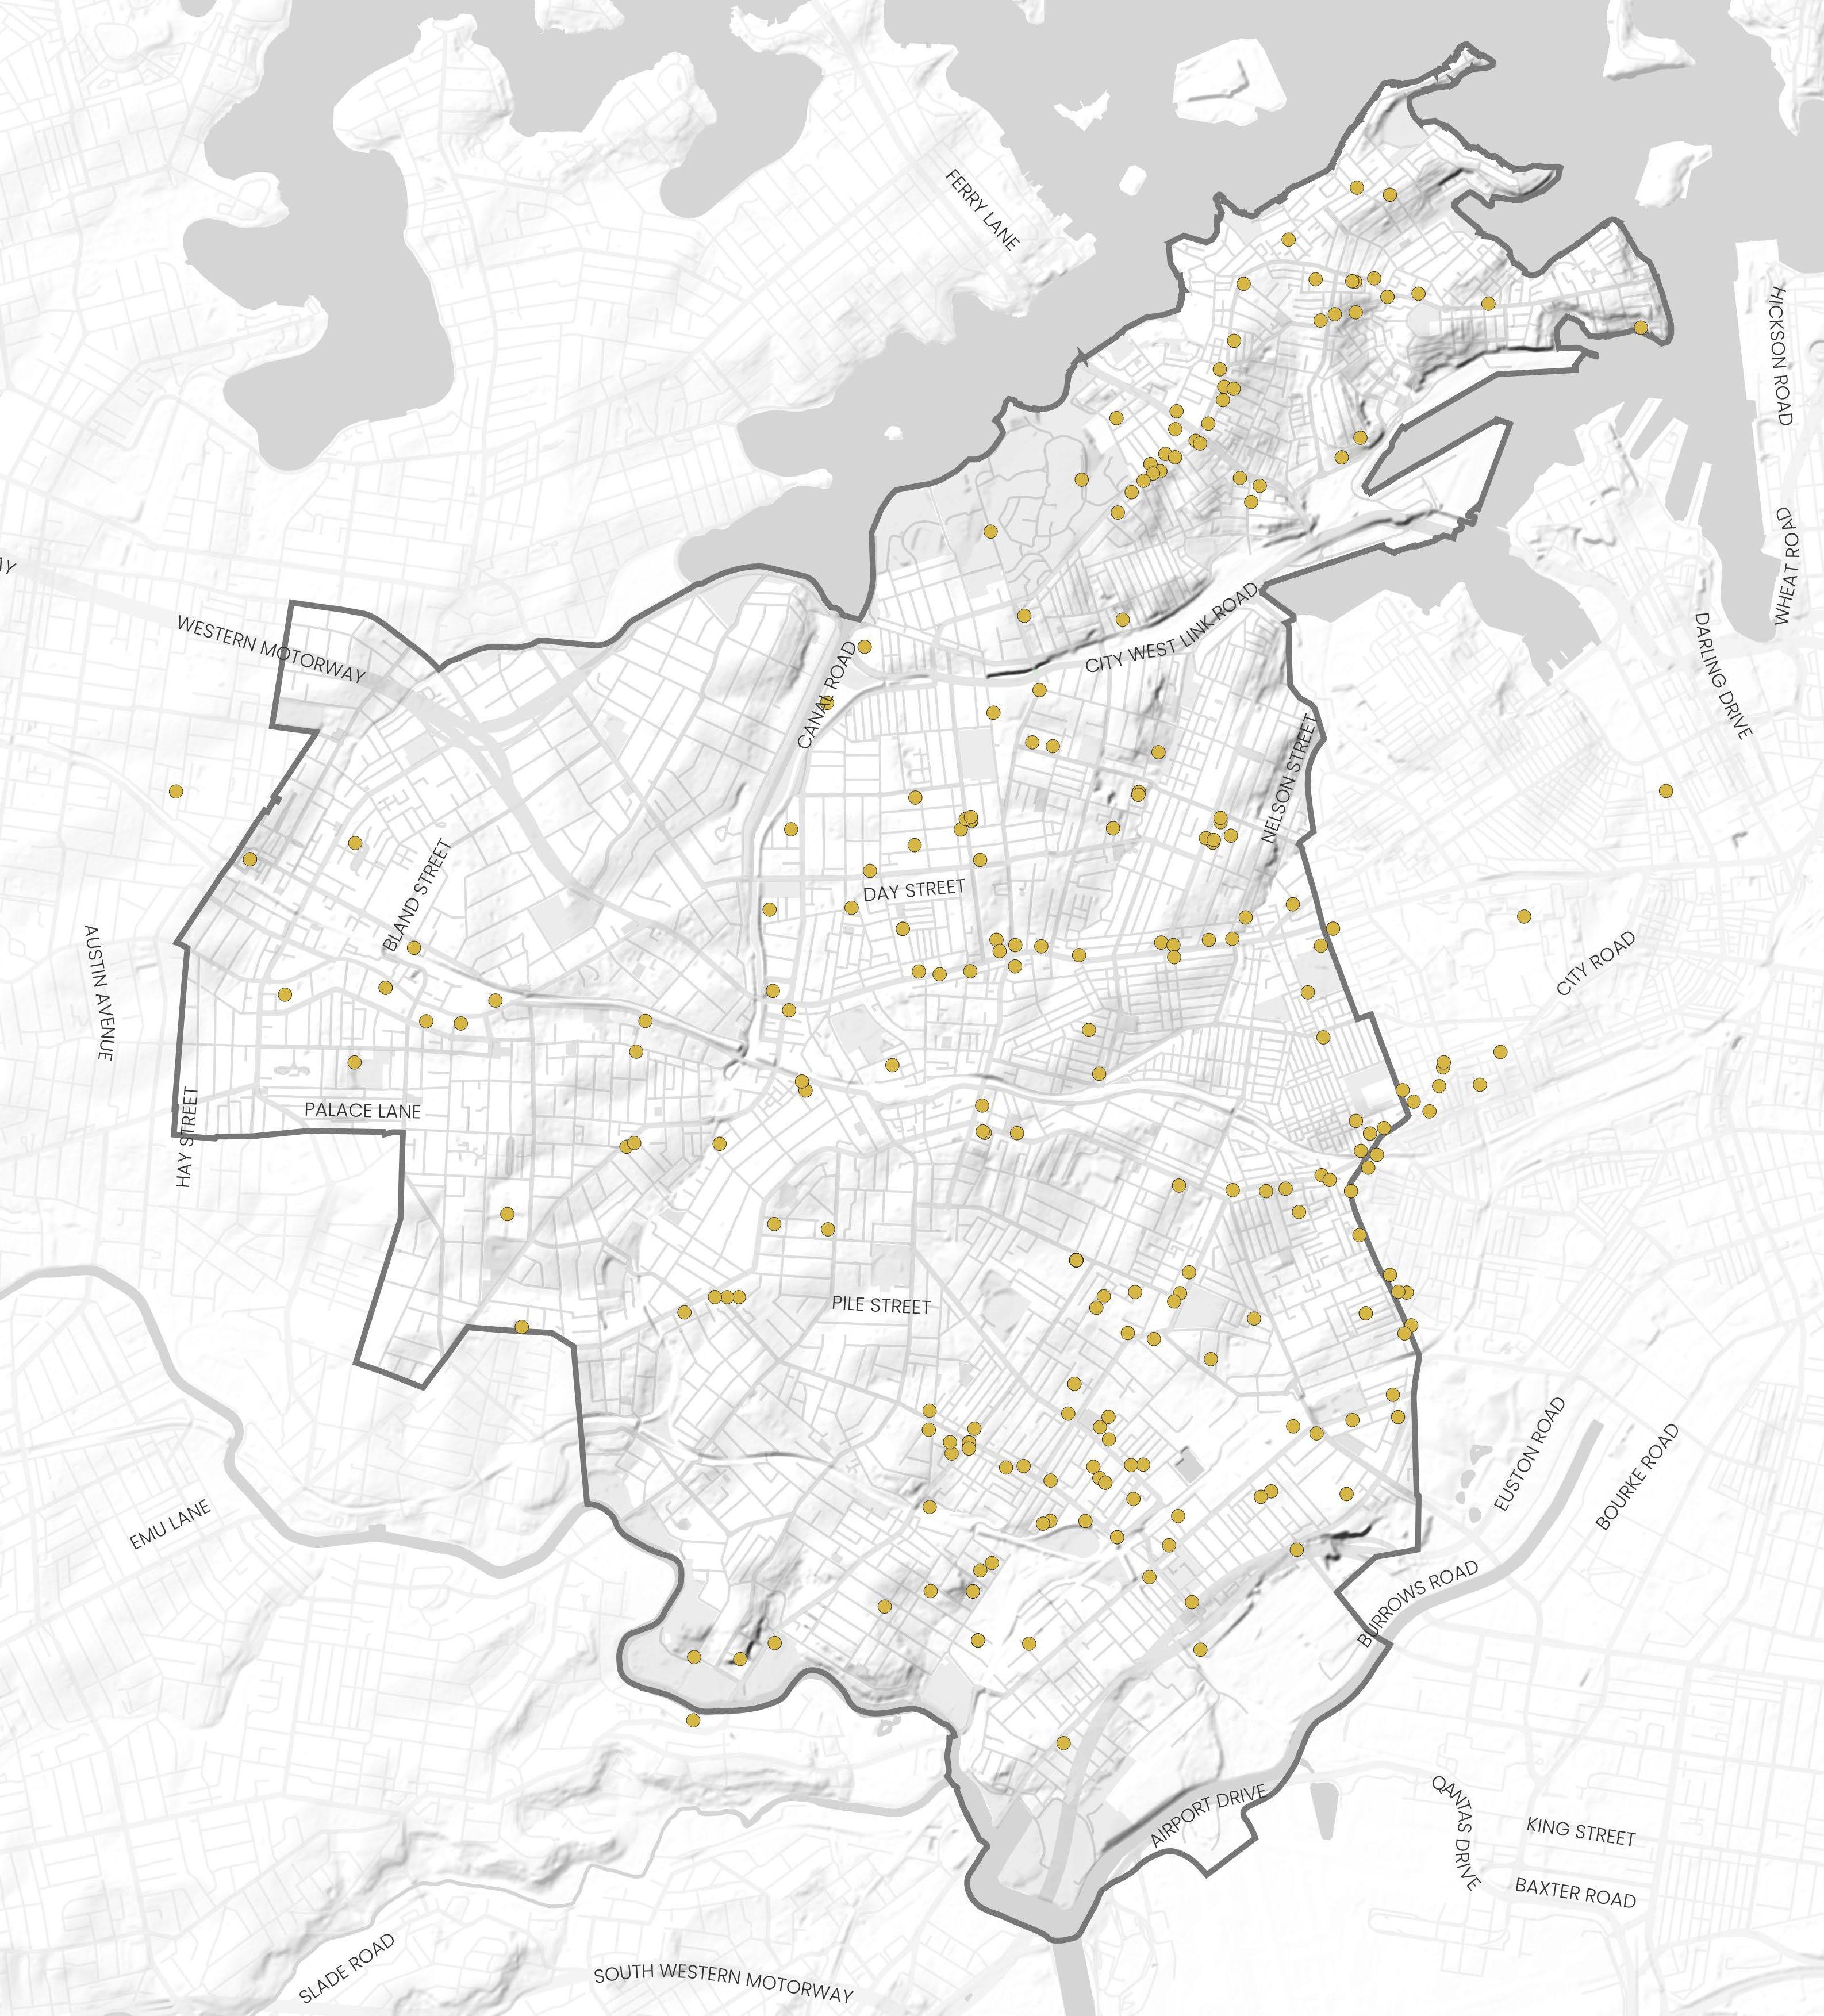
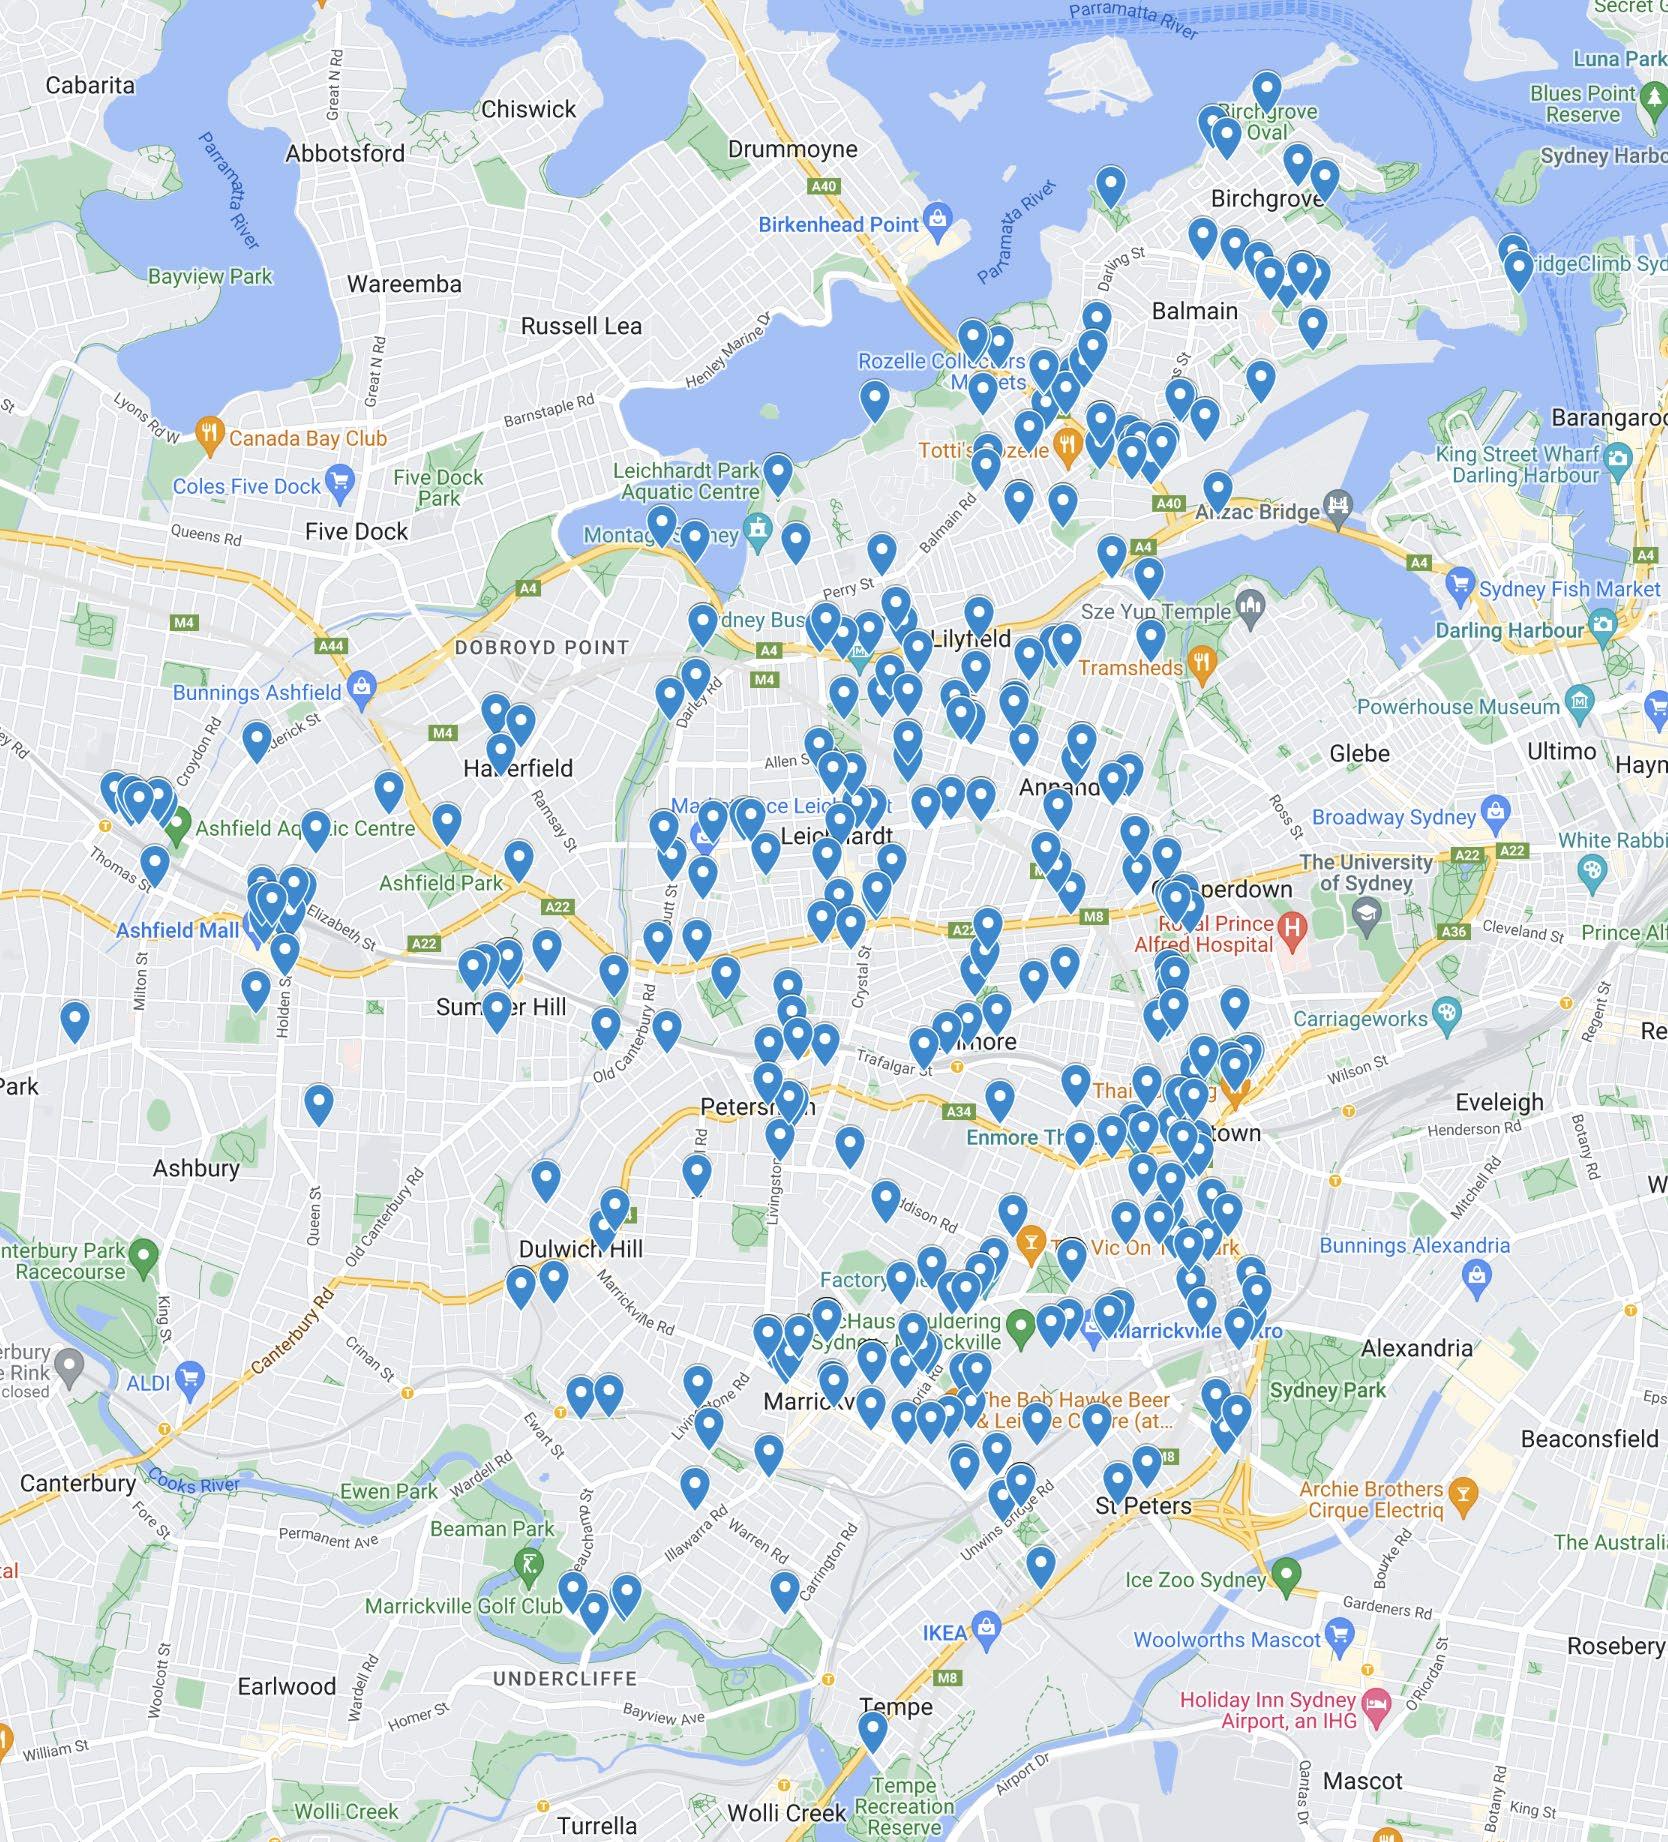
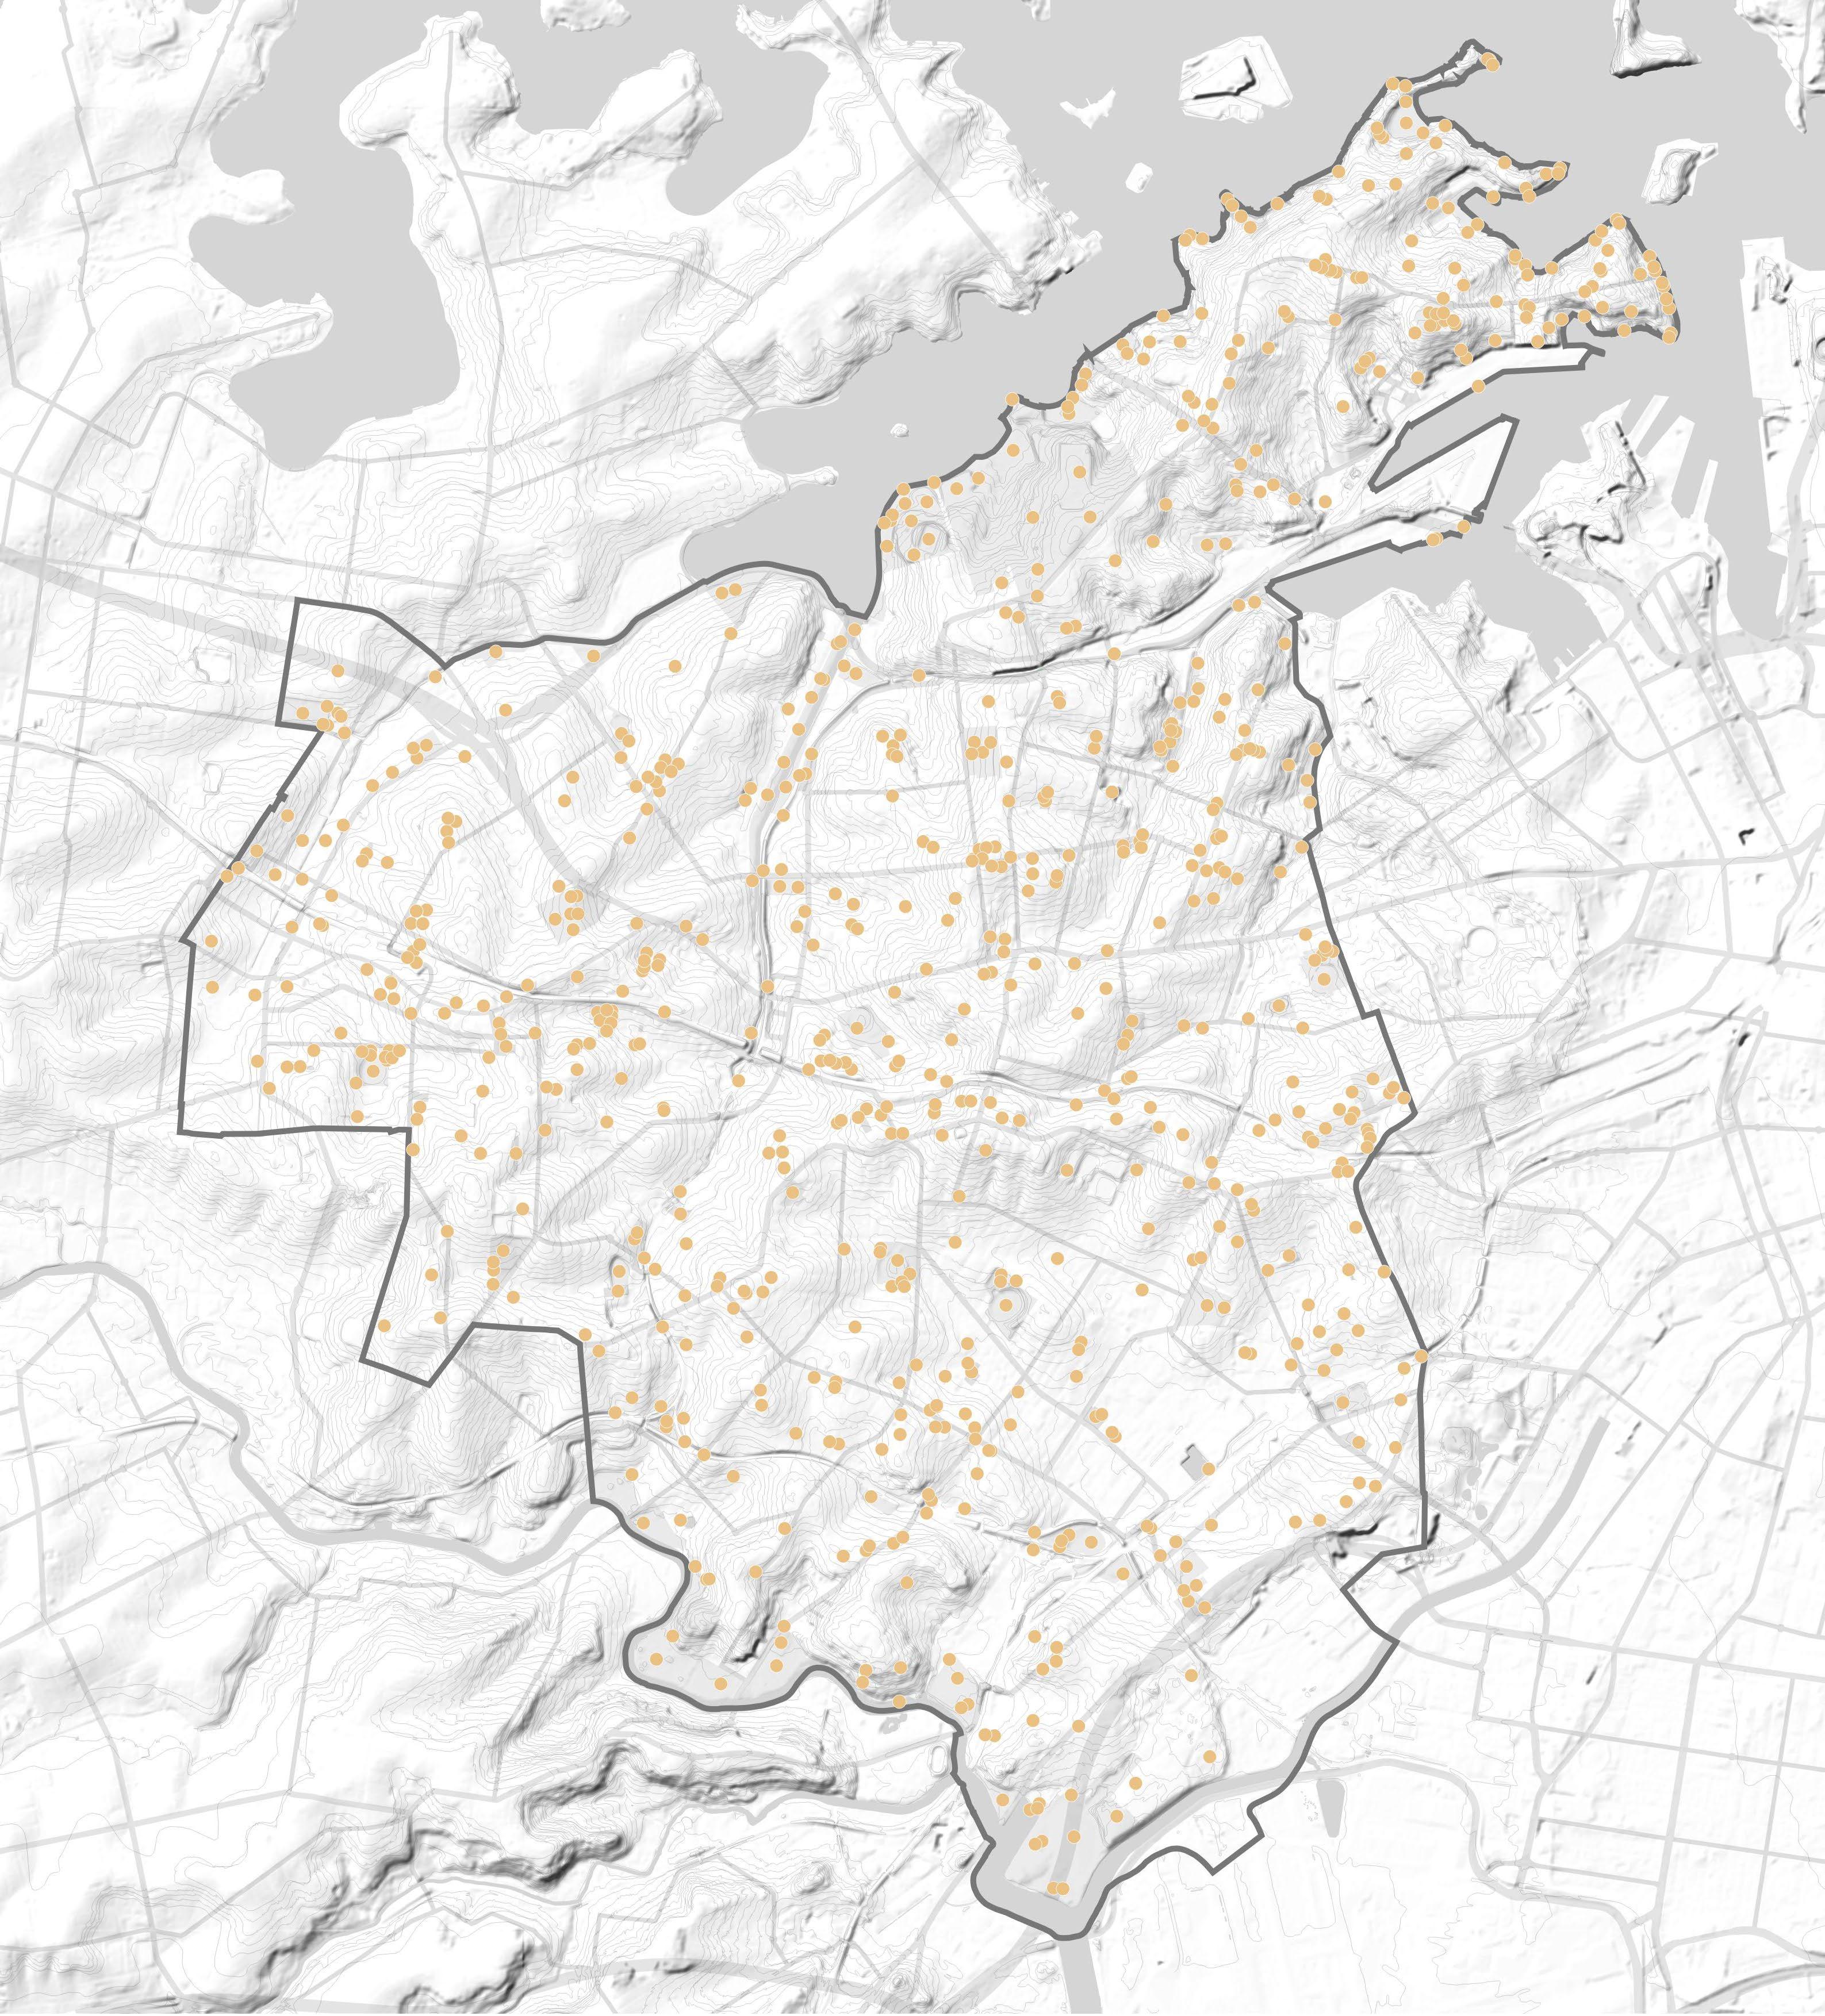
Mapping Layers Points of Interest (POI)
The Blue-Green Grid is about providing high amenity, green routes along commonly traveled paths and routes. The POI map outlines the specific places to connect. POI’s include:
Ambulance Stations, Art Galleries, Athletic Tracks, Boat Ramps, Cemeteries, Child Care Centres, Clubs, Community Facilities, Comunity Homes, Convent/ Monasteries, Court Houses, Education Facilities, Embassies, Fire Stations, General Hospitals, Historic Sites, Libraries, Local Government Chambers, Lookouts, Monuments, Museums, Nursing Homes, Parks, Picnic Areas, Places of Worship, Police Stations, Post Offices, Preschools, Pumping Stations, Retirement Villages, Rubbish Depots, SES facilities, Schools (High schools, primary schools, special schools, public and private)
Shopping Centres, Slipways, Sports Centres, Sports courts and fields, Swimming Pools, TAFE colleges, Transport interchanges, Universitieis, Urban Places, and, Wharfs.
Map source: https://datasets.seed.nsw.gov.au/dataset/ nsw-points-of-interest-poi
Legend
Inner West Blue-Green Grid Strategy 2023 127
Hurlstone Park
Croydon Park
Camperdown
Balmain East
Summer Hill
Dulwich Hill
Marrickville
Petersham
Birchgrove
Annandale
Sydenham
Leichhardt Lewisham
Stanmore Newtown
St Peters
Croydon
Balmain
Enmore
Mascot
Rozelle Tempe
Inner West LGA Boundary POI
Mapping Layers
Water Catchment
Understanding where less permeable surfaces are which correlates with flooding.
Map source: https://datasets.seed.nsw.gov.au/ dataset/42582022-ed91-45df-b542-8af77f564020/ metaexport/html
Legend
Inner West LGA Boundary Catchment Boundary
 Hurlstone Park
Croydon Park
Camperdown
Balmain East
Summer Hill
Dulwich Hill
Marrickville
Petersham
Birchgrove
Annandale
Sydenham
Leichhardt Lewisham
Stanmore Newtown
St Peters
Croydon
Balmain Enmore
Mascot
Rozelle Tempe
Hurlstone Park
Croydon Park
Camperdown
Balmain East
Summer Hill
Dulwich Hill
Marrickville
Petersham
Birchgrove
Annandale
Sydenham
Leichhardt Lewisham
Stanmore Newtown
St Peters
Croydon
Balmain Enmore
Mascot
Rozelle Tempe
Mapping Layers Pipes and Drainage
The Blue-Green Grid will provide WSUD in areas which require drainage to naturally control what enters our waterways.
Map source: Inner West Council.
Legend
Inner West LGA Boundary
Drainage Pits
Stormwater Pipes
Inner West Blue-Green Grid Strategy 2023 129
Hurlstone Park
Croydon Park
Camperdown
Balmain East
Summer Hill
Dulwich Hill
Marrickville
Petersham
Birchgrove
Annandale
Sydenham
Leichhardt Lewisham
Stanmore Newtown
St Peters
Croydon
Balmain
Enmore
Mascot
Rozelle
Tempe
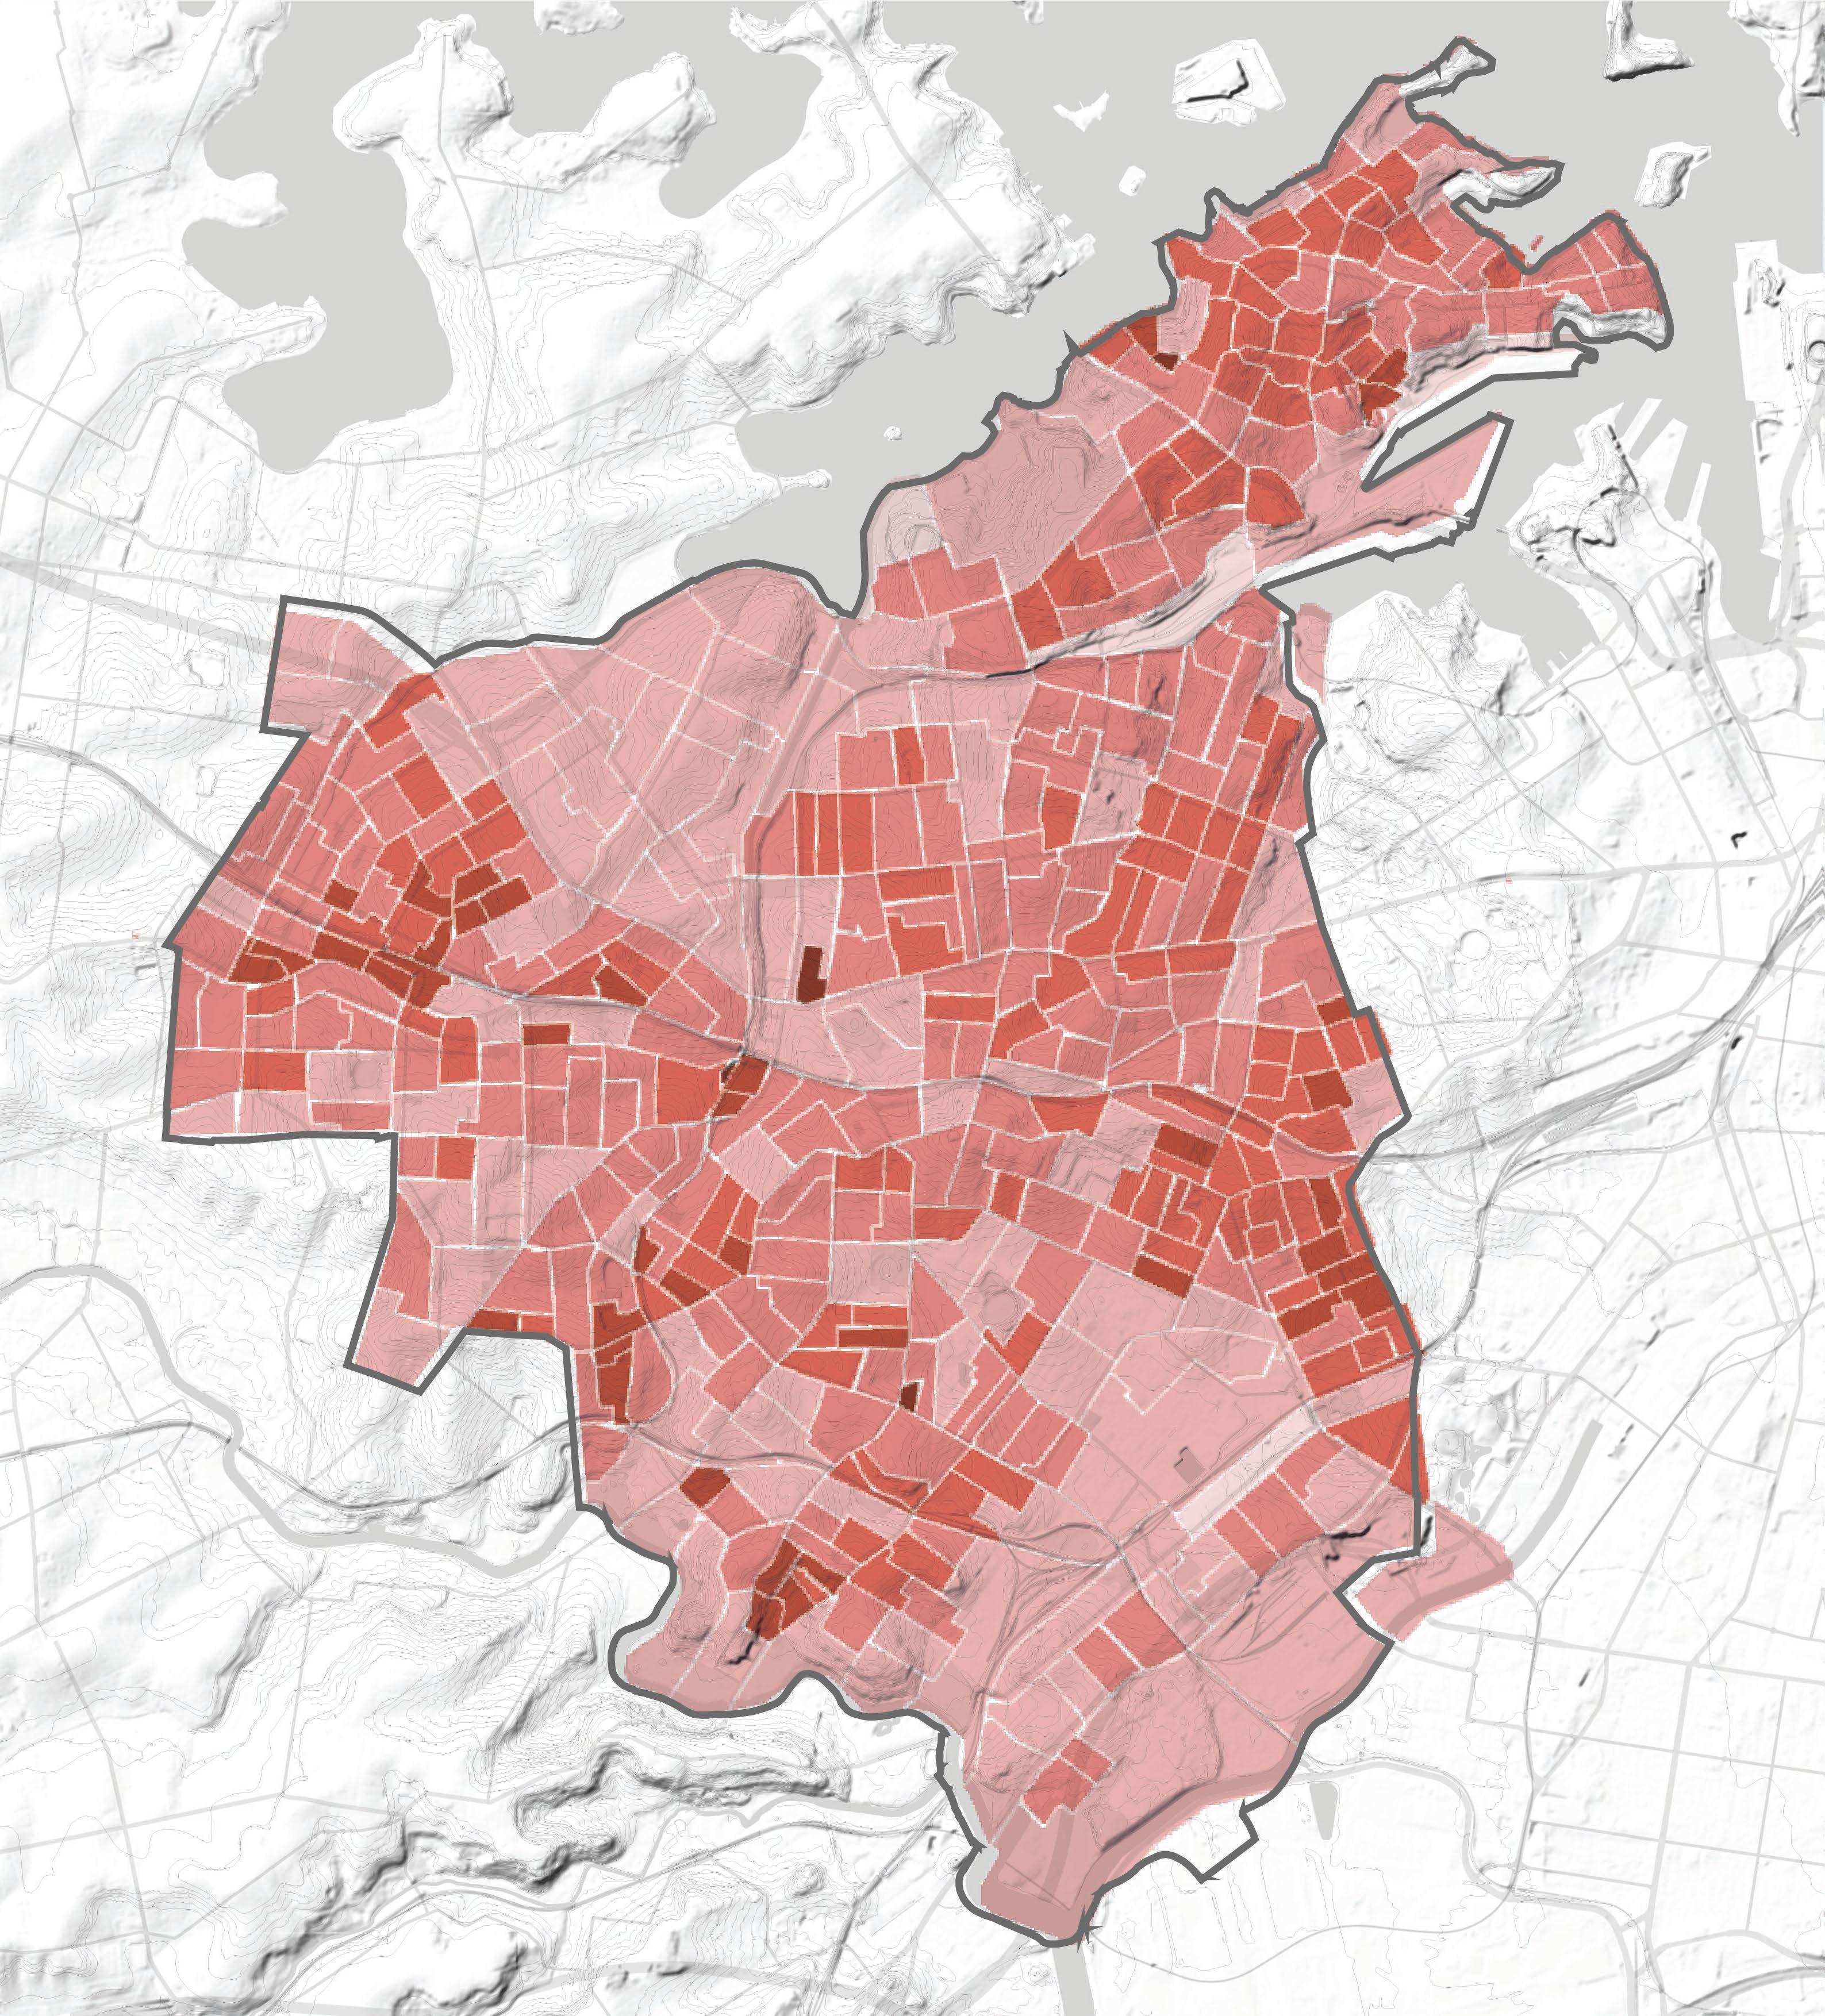
Mapping Layers
Points of Interest (POI) - Heat Map
The Points of Interest (POI) heatmap represents an aggregate of location of a feature, service or activity that people may want to see, know about or visit across the LGA. The POI dataset is acquired from and maintained by State Government of NSW and Spatial Services (DCS).
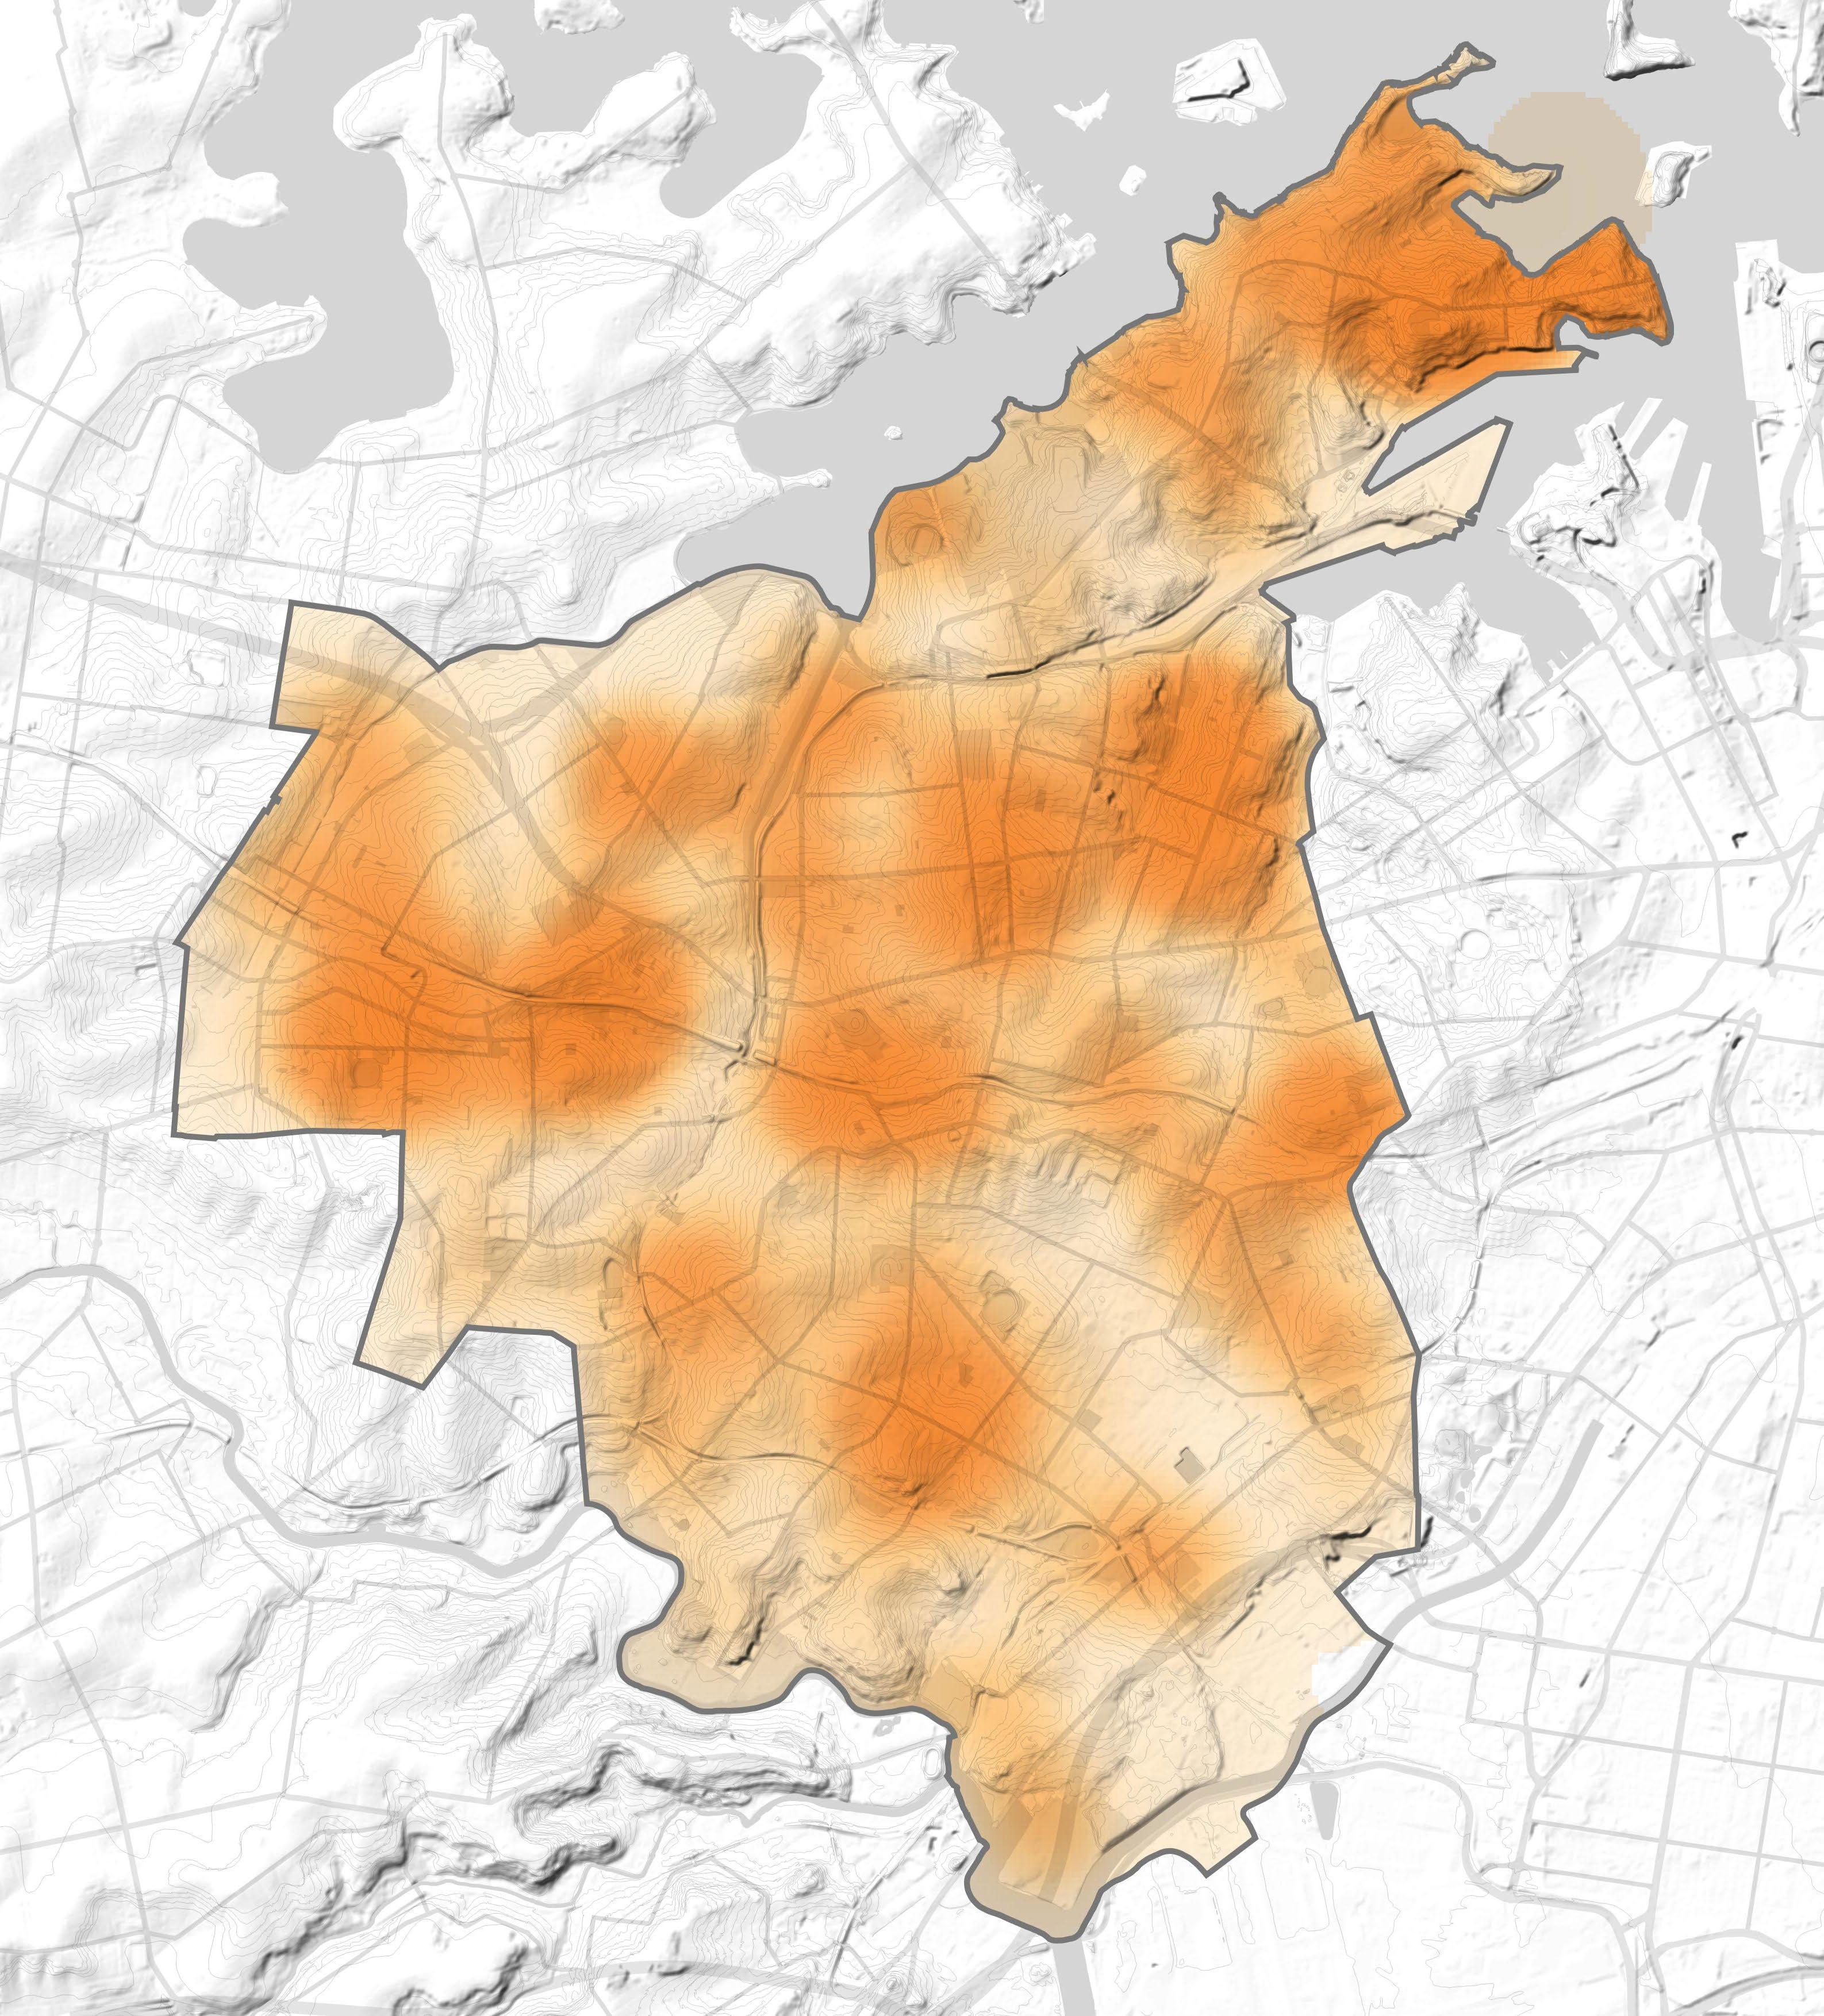
POI dataset includes features related to Community, Education, Recreation, Transportation, Utility, or Hydrography, Physiography and Place, and defined as a place with a prescribed name. The spatial analysis technique uses this dataset with density calculation to estimate density-clusters across a study area. It calculates the density of interest points by spreading the influence of each point throughout the study area using a kernel function. The resulting output of this analysis method helps in analysing potential pedestrian mobility and behaviour with the LGA.
The POI Heat Map expands on the previous POI map. This in turn helps identify a broader Blue-Green Grid, which runs broadly near POIs in circumstances a link may not be suitable along that specific route.
Map source: https://datasets.seed.nsw.gov.au/dataset/ nsw-points-of-interest-poi
Map produced by McGregor Coxall with GIS.
Legend
Inner West LGA Boundary
More Points of Interest
Less Points of Interest
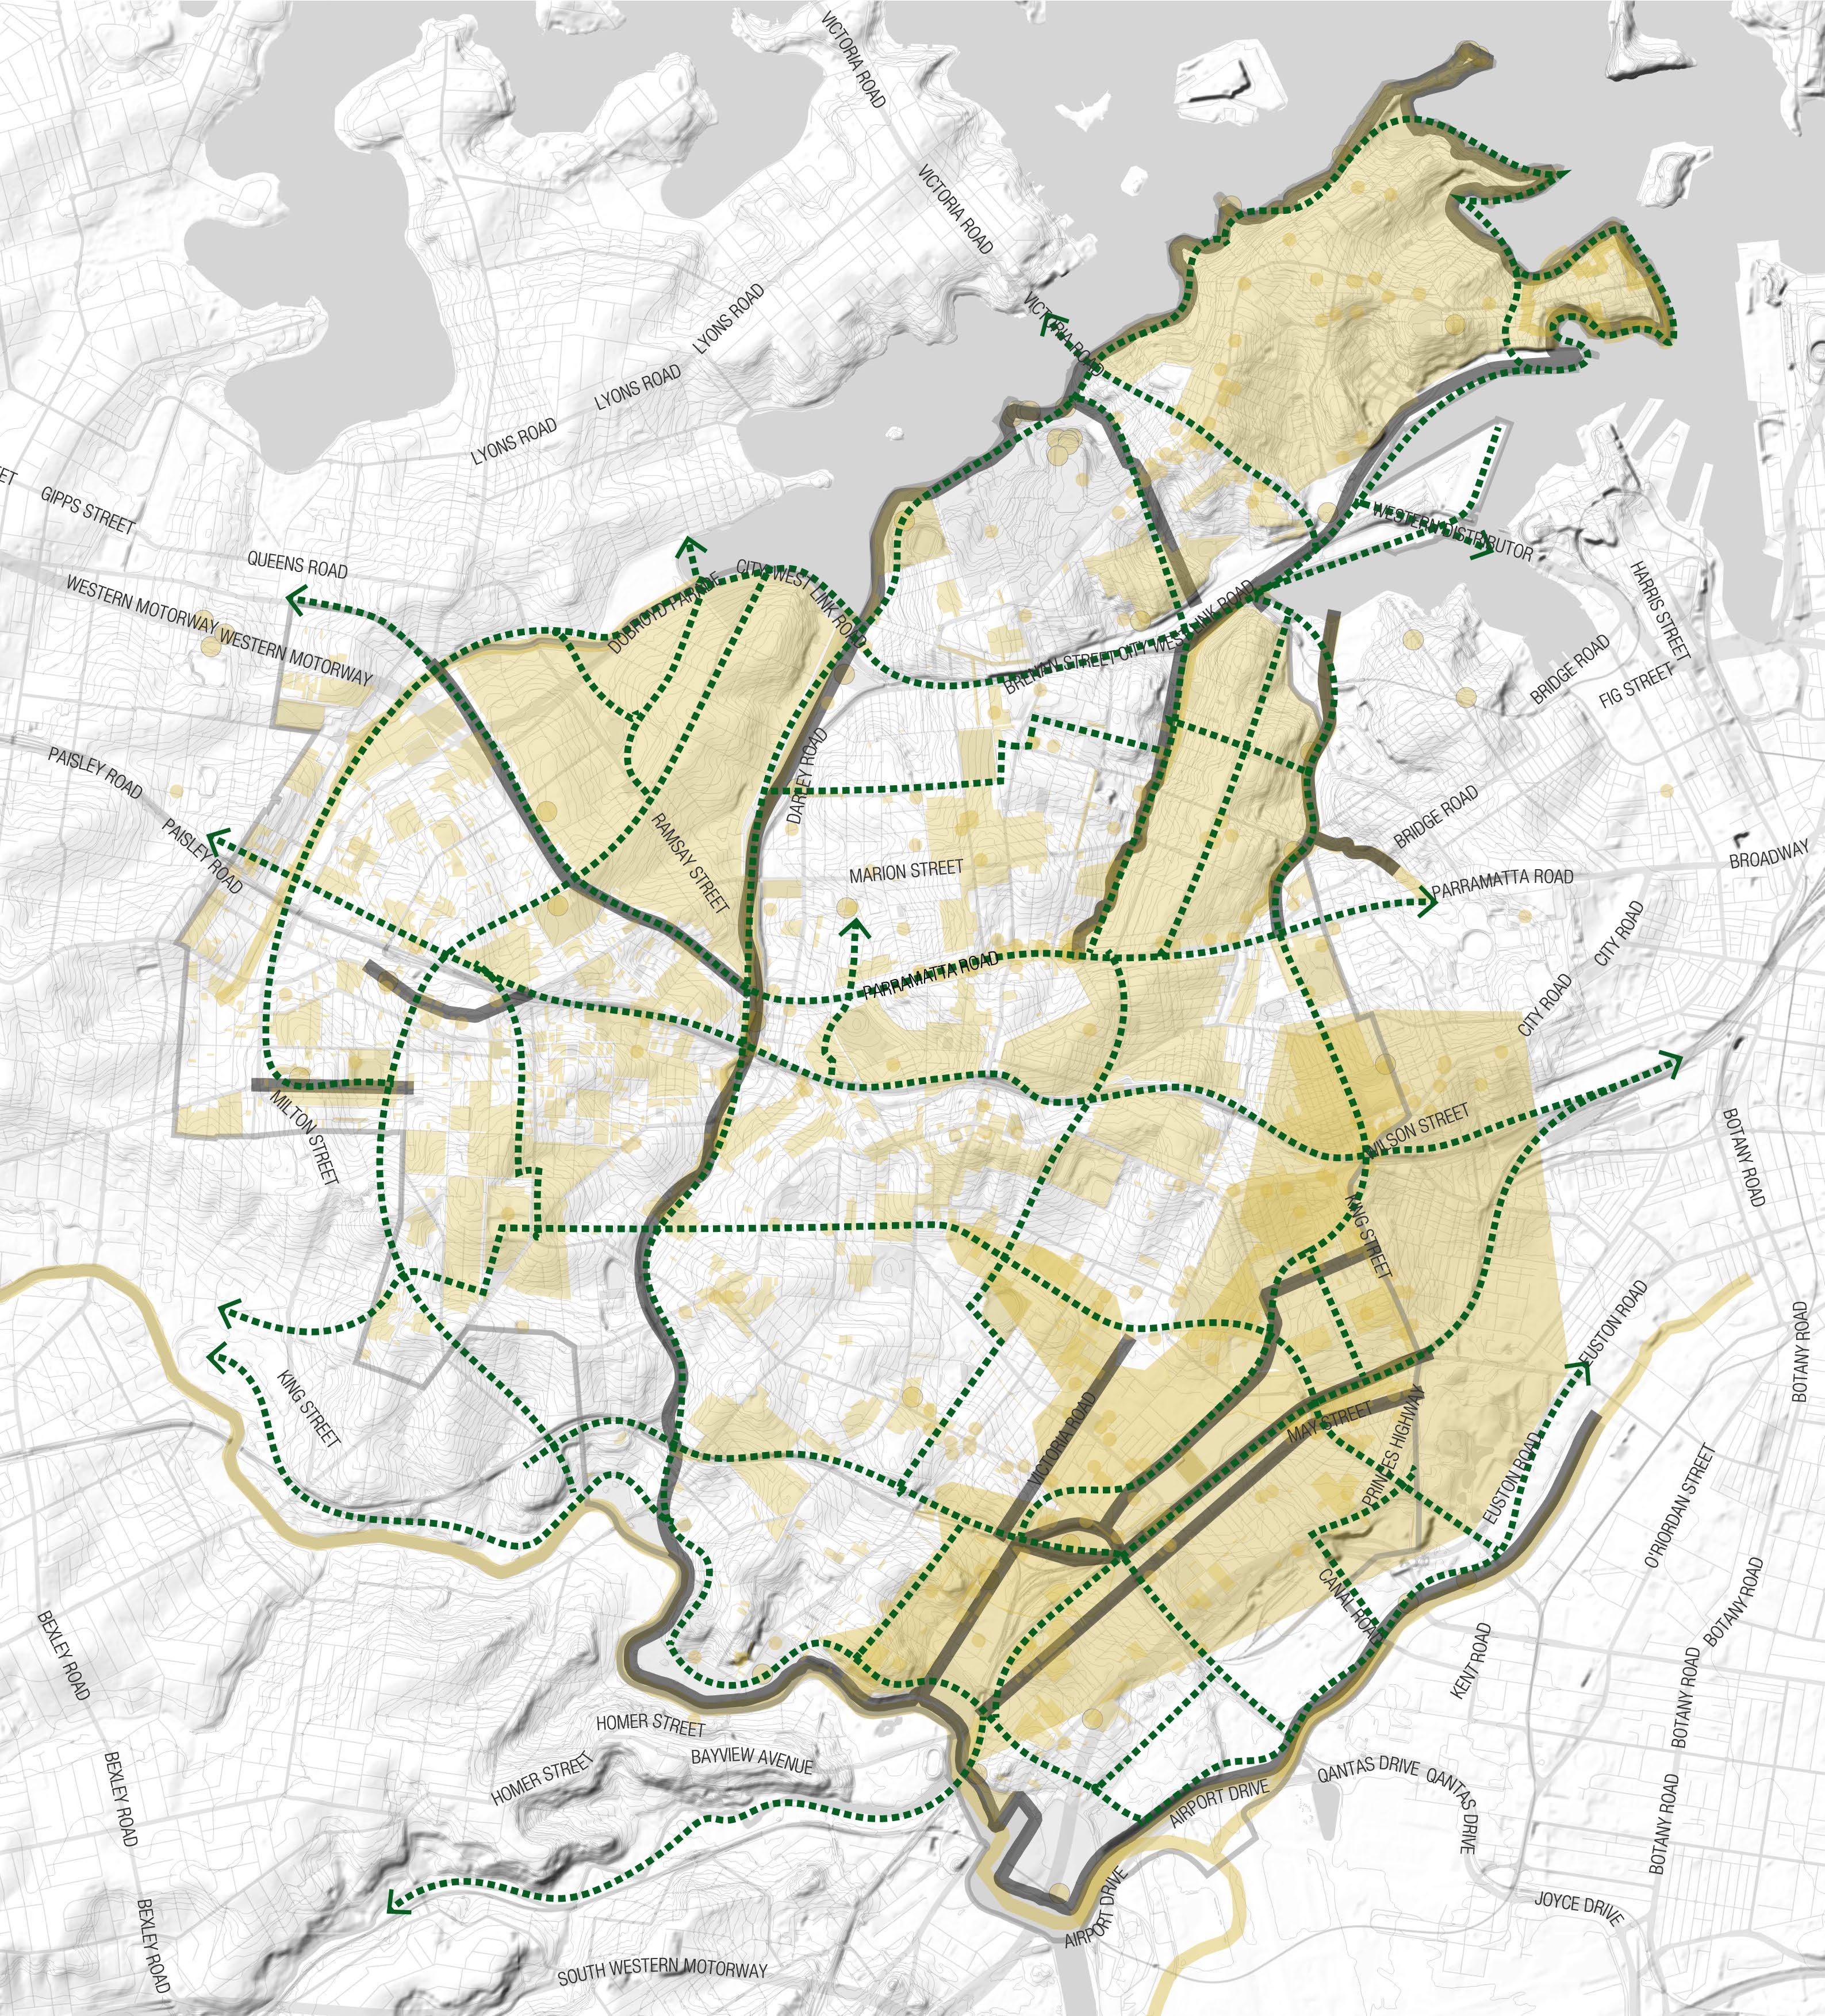
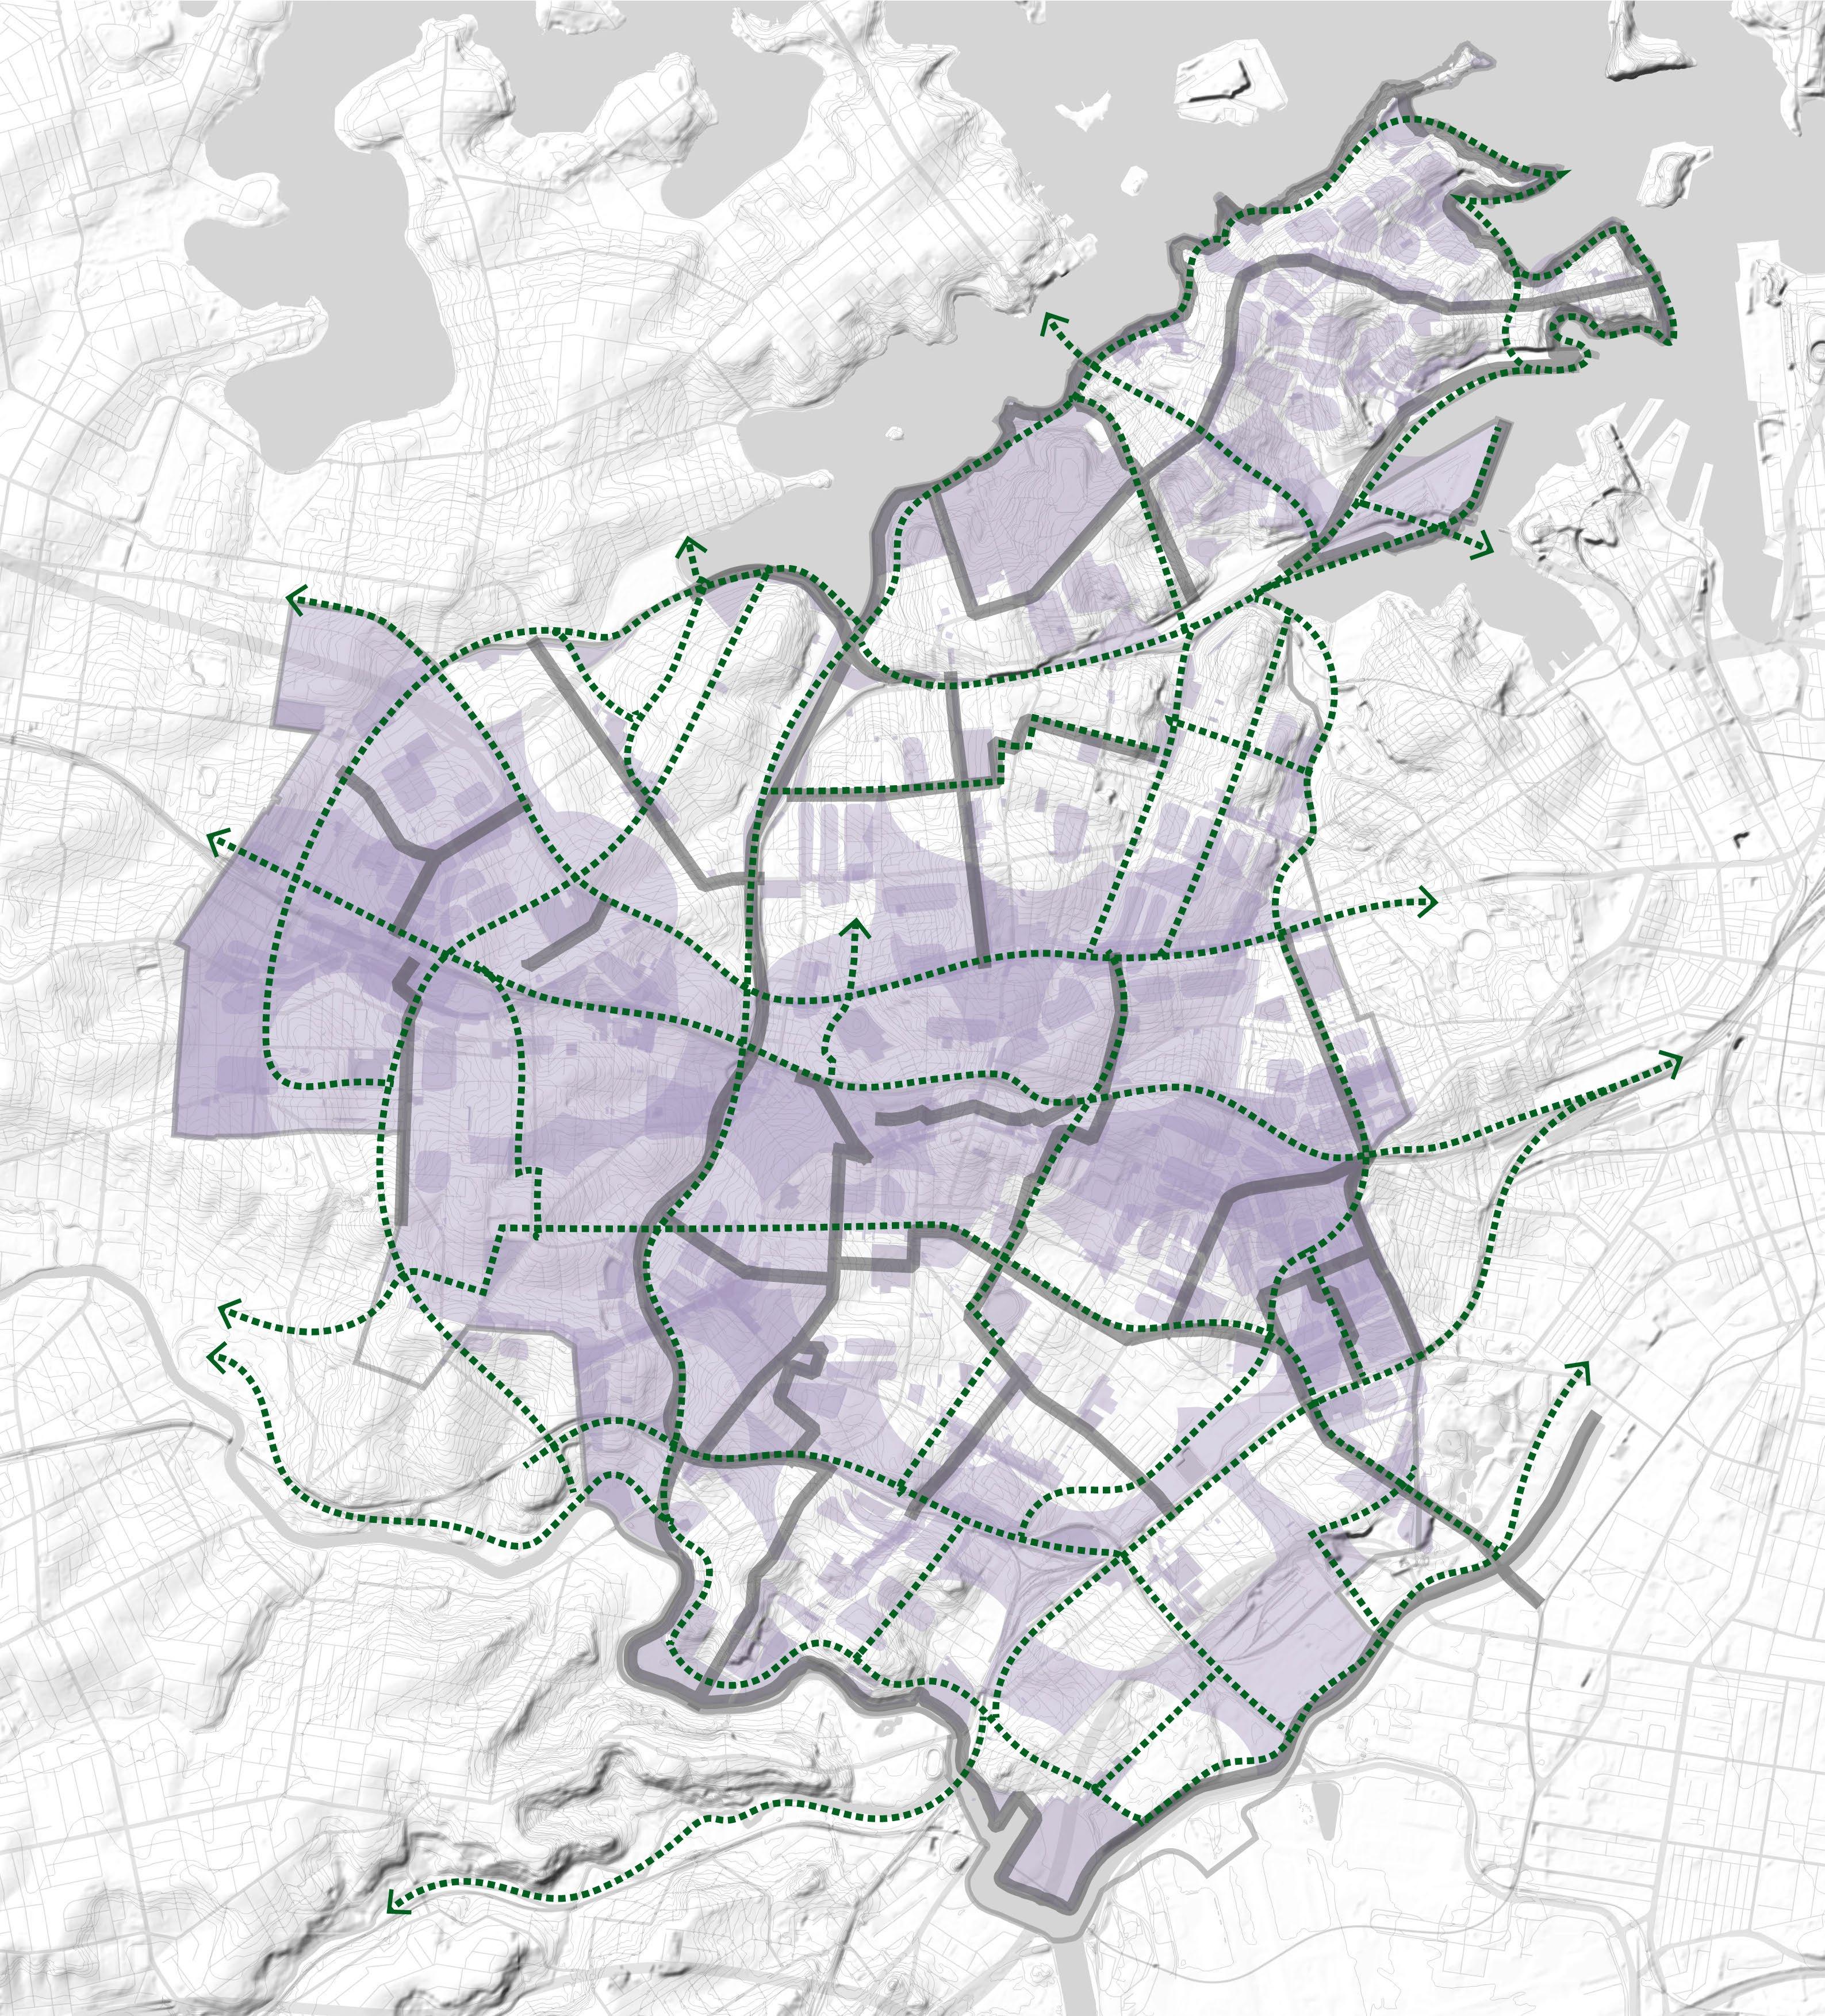
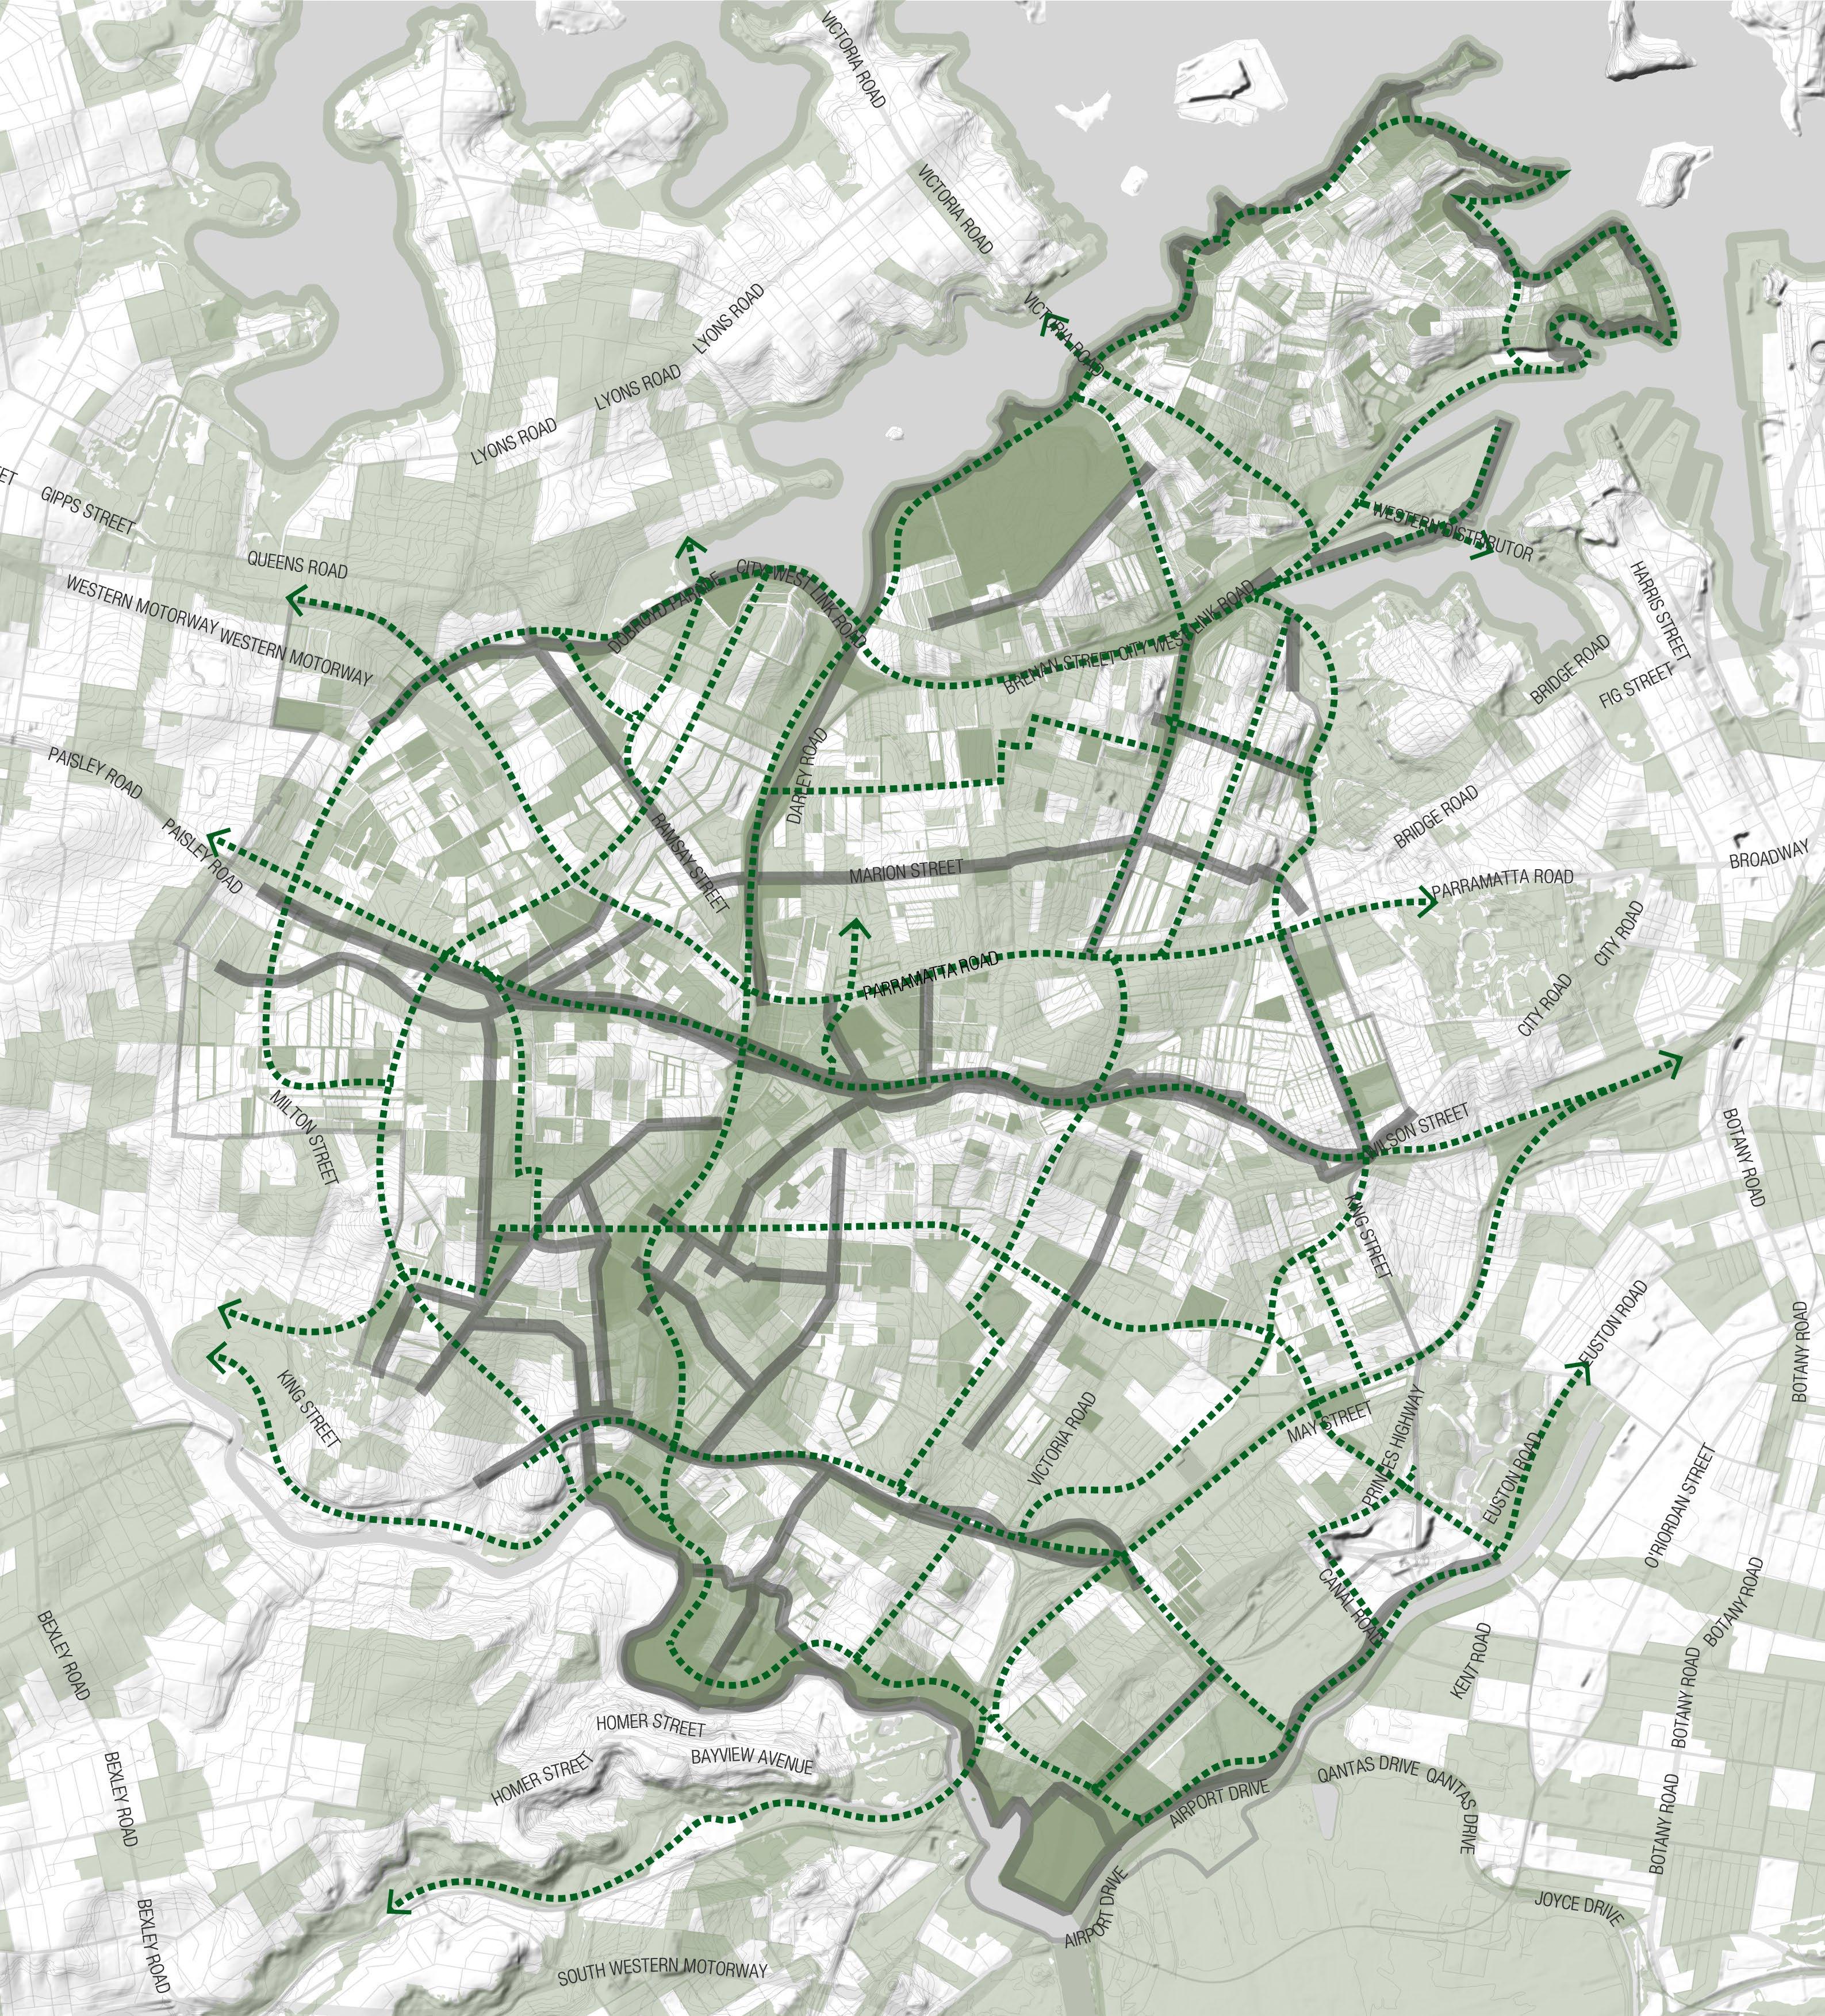
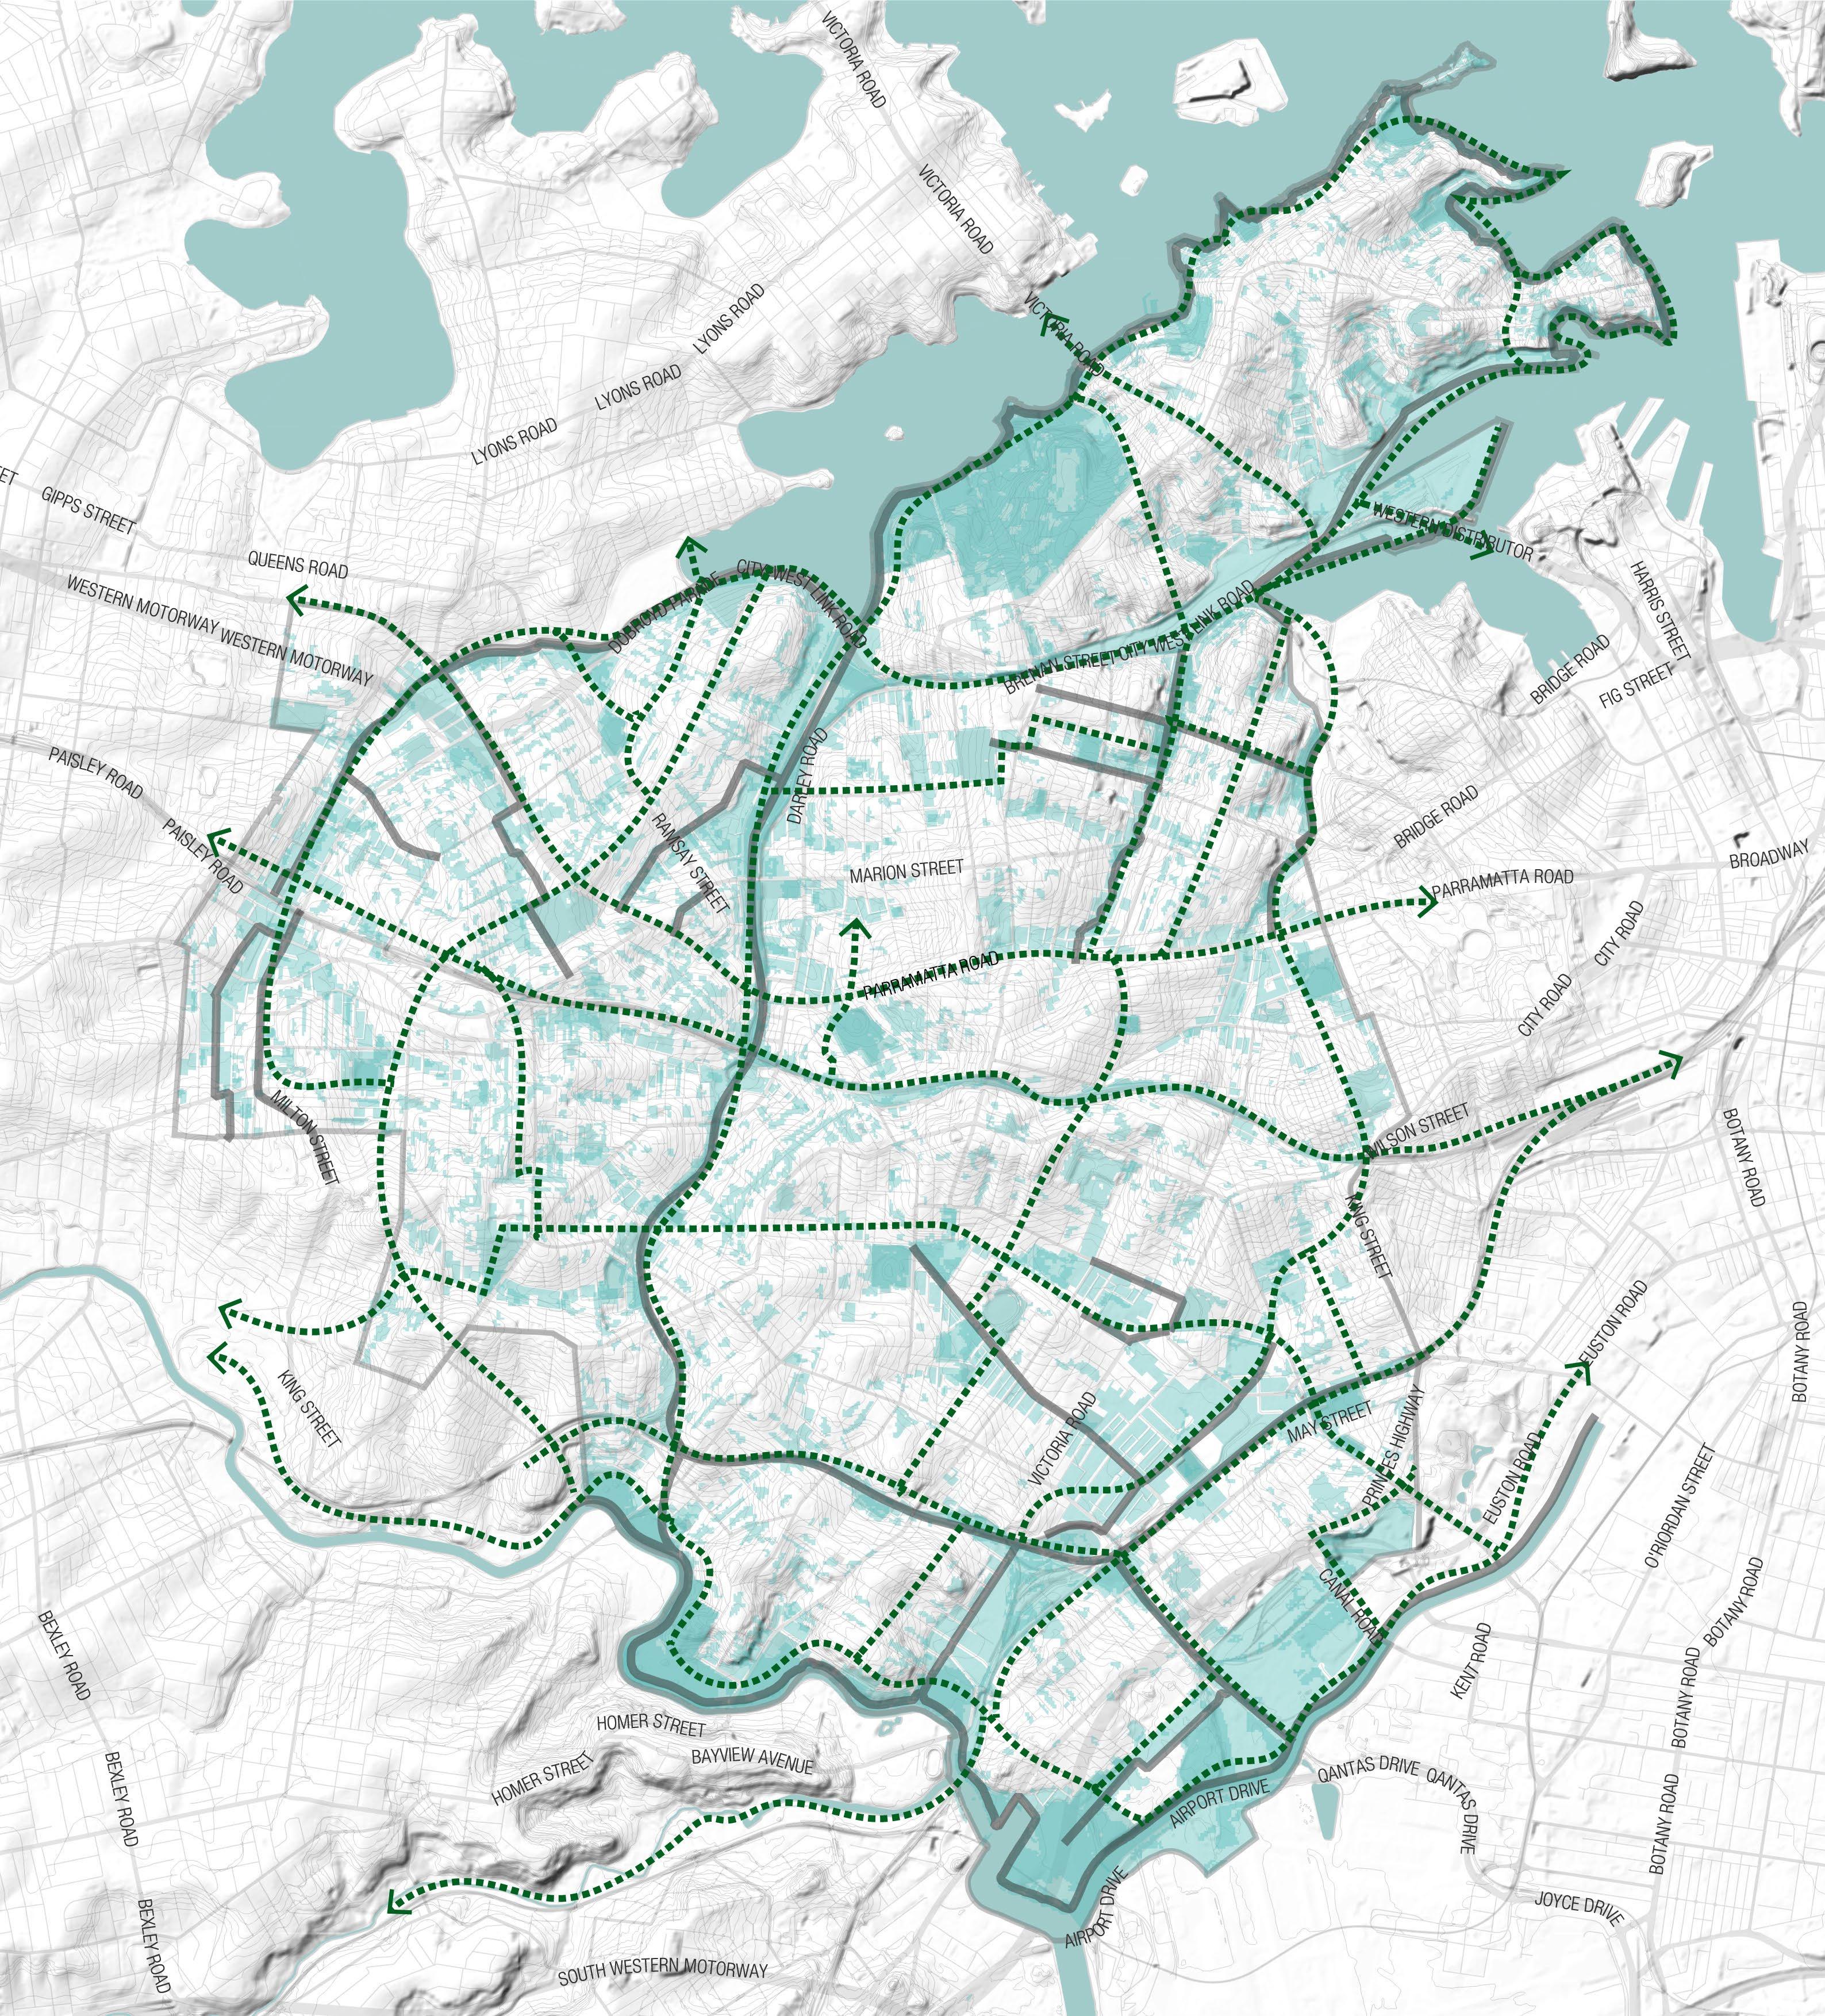
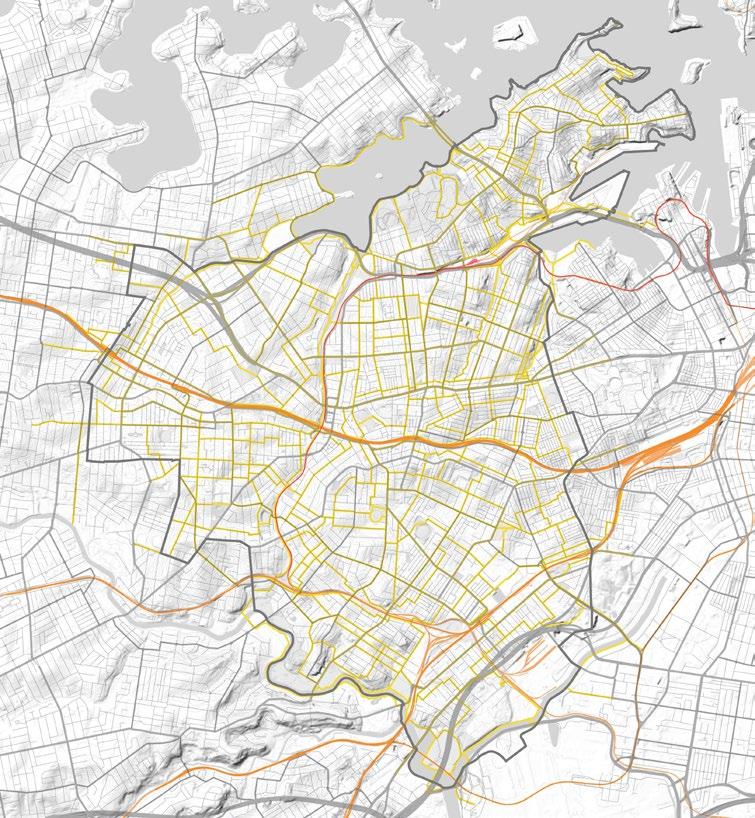
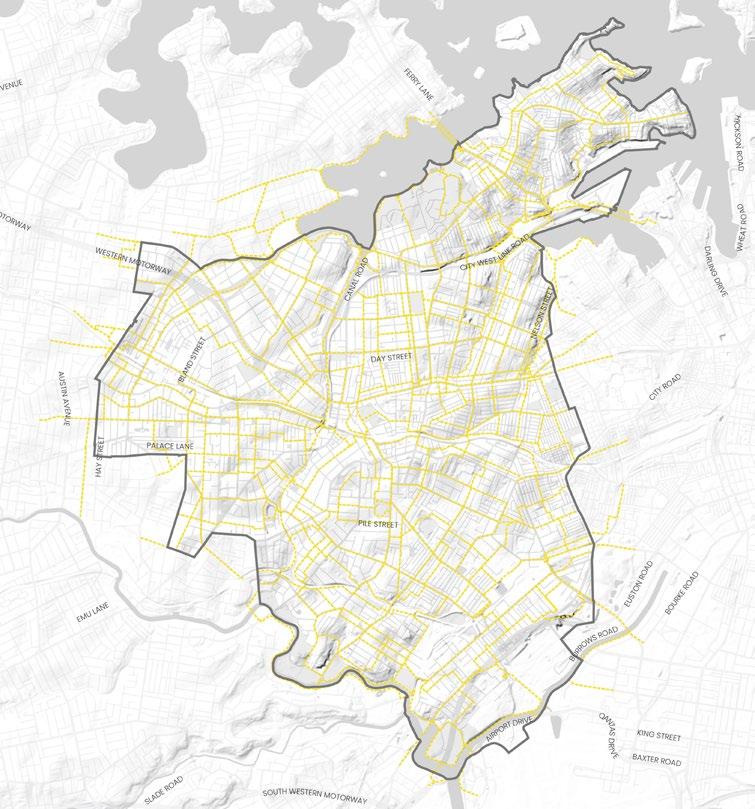
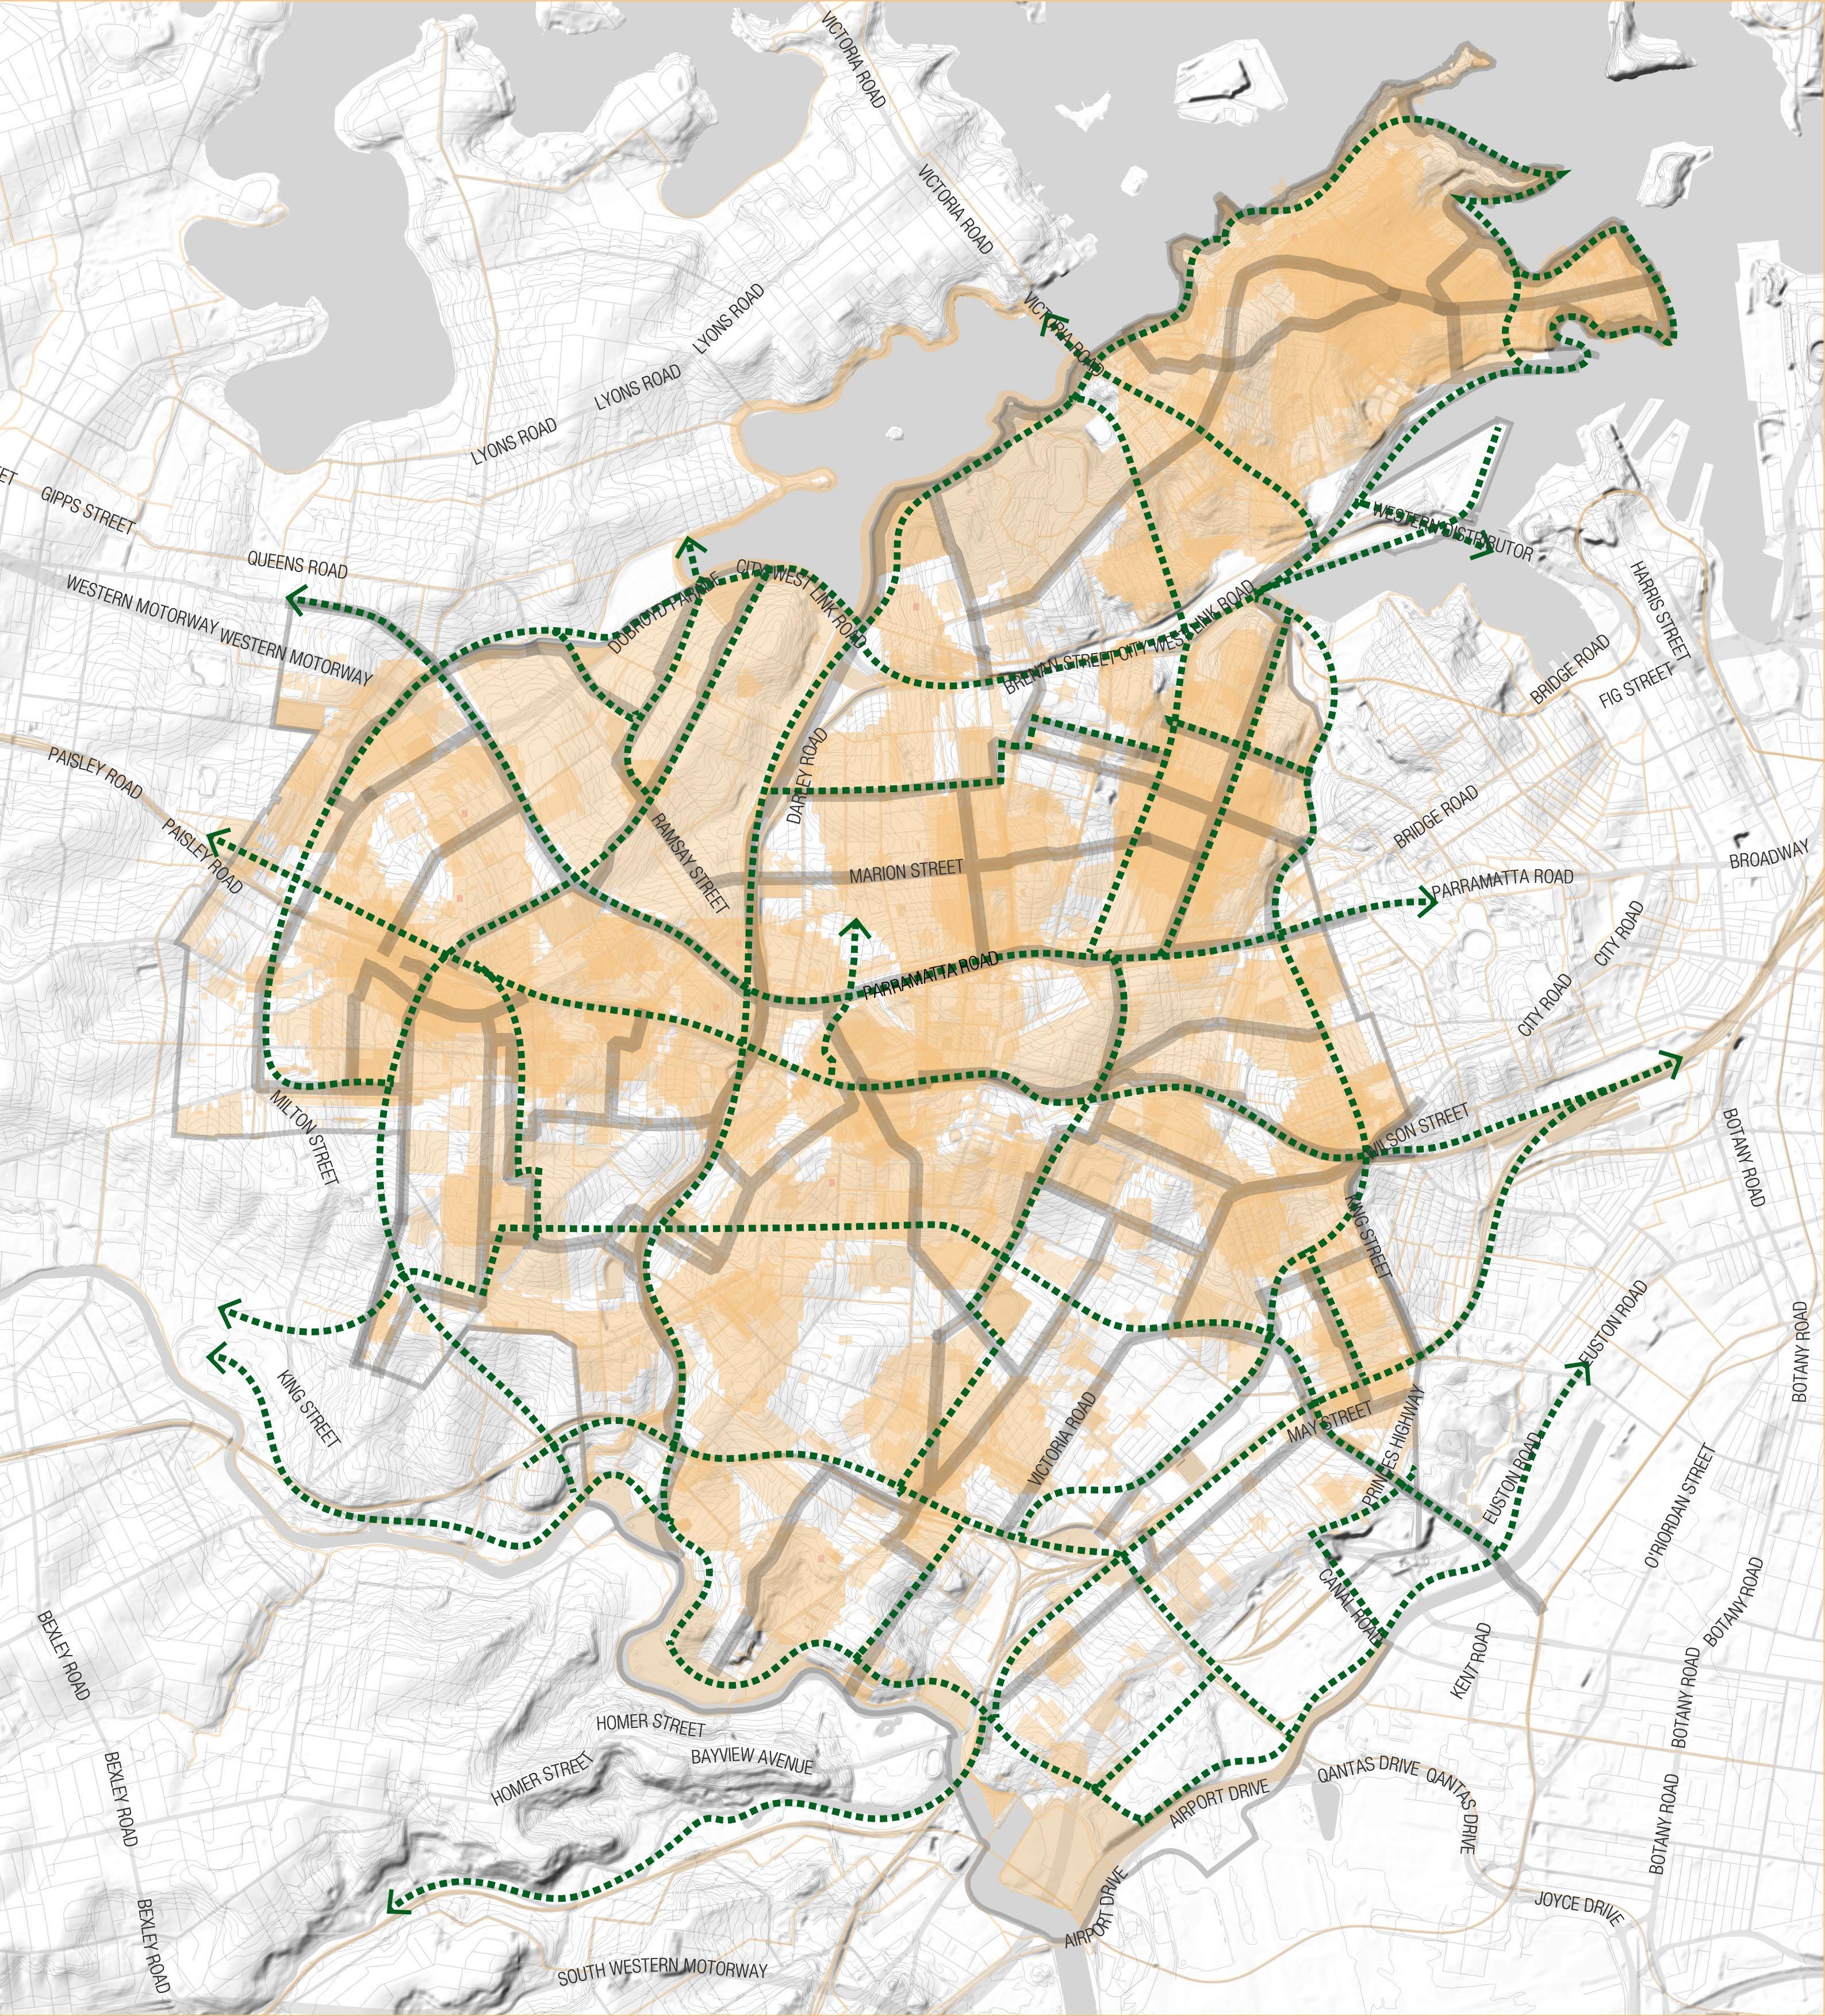
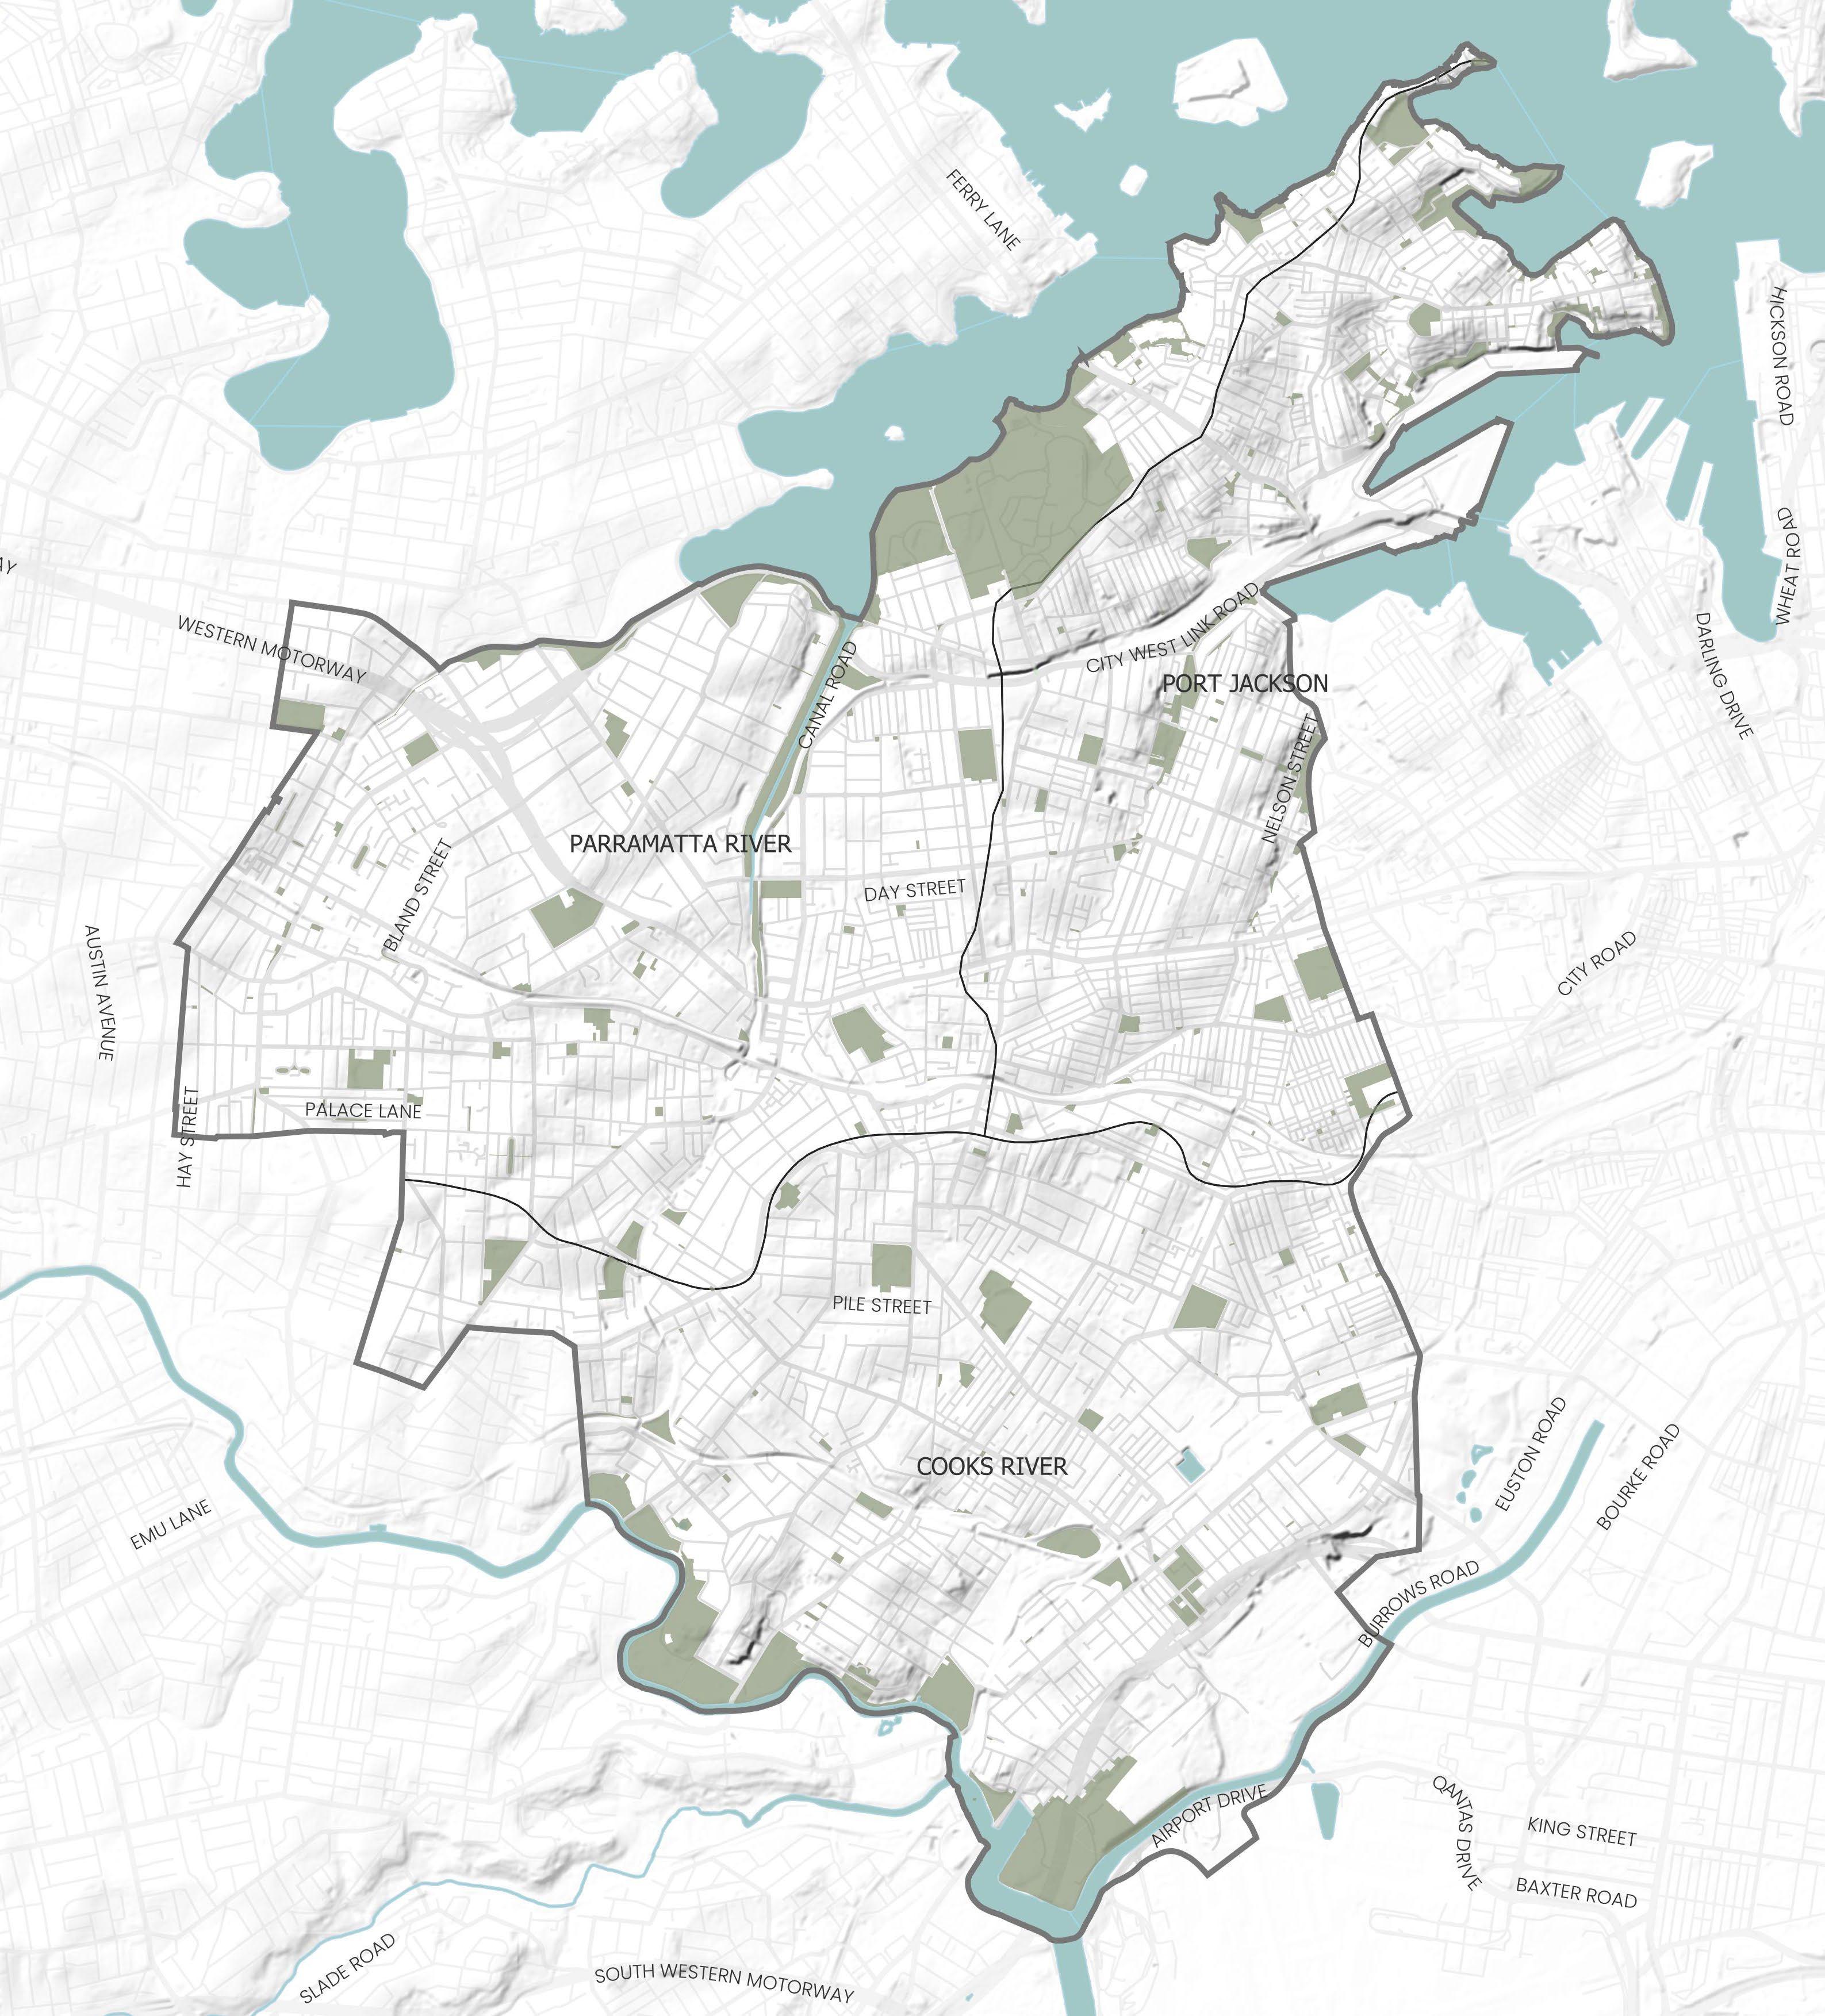
Mapping Layers Movement Network
The Inner West Network is key to movement within, to and from the area, with plans to improve the network with the addition of the Metro.
The existing cycle routes provide hints as to where the Blue-Green Grid could go and indicate gaps to be improved.
Proximity to public transport from the Blue-Green Grid provides accessibility to green spaces, whilst also encourages use of public transport through providing direct accessible paths and active transport over private car use, as the Blue-Green Grid will produce more attractive routes that are lush and cool which people want to use.
The Blue-Green Grid has potential to follow the train lines and main roads, using trees to reduce noise, improve aesthetics and creating a corridor of wildlife and biodiversity.
Map source: Shapefiles provided by Inner West Council, NSW DPIE, Six Maps.
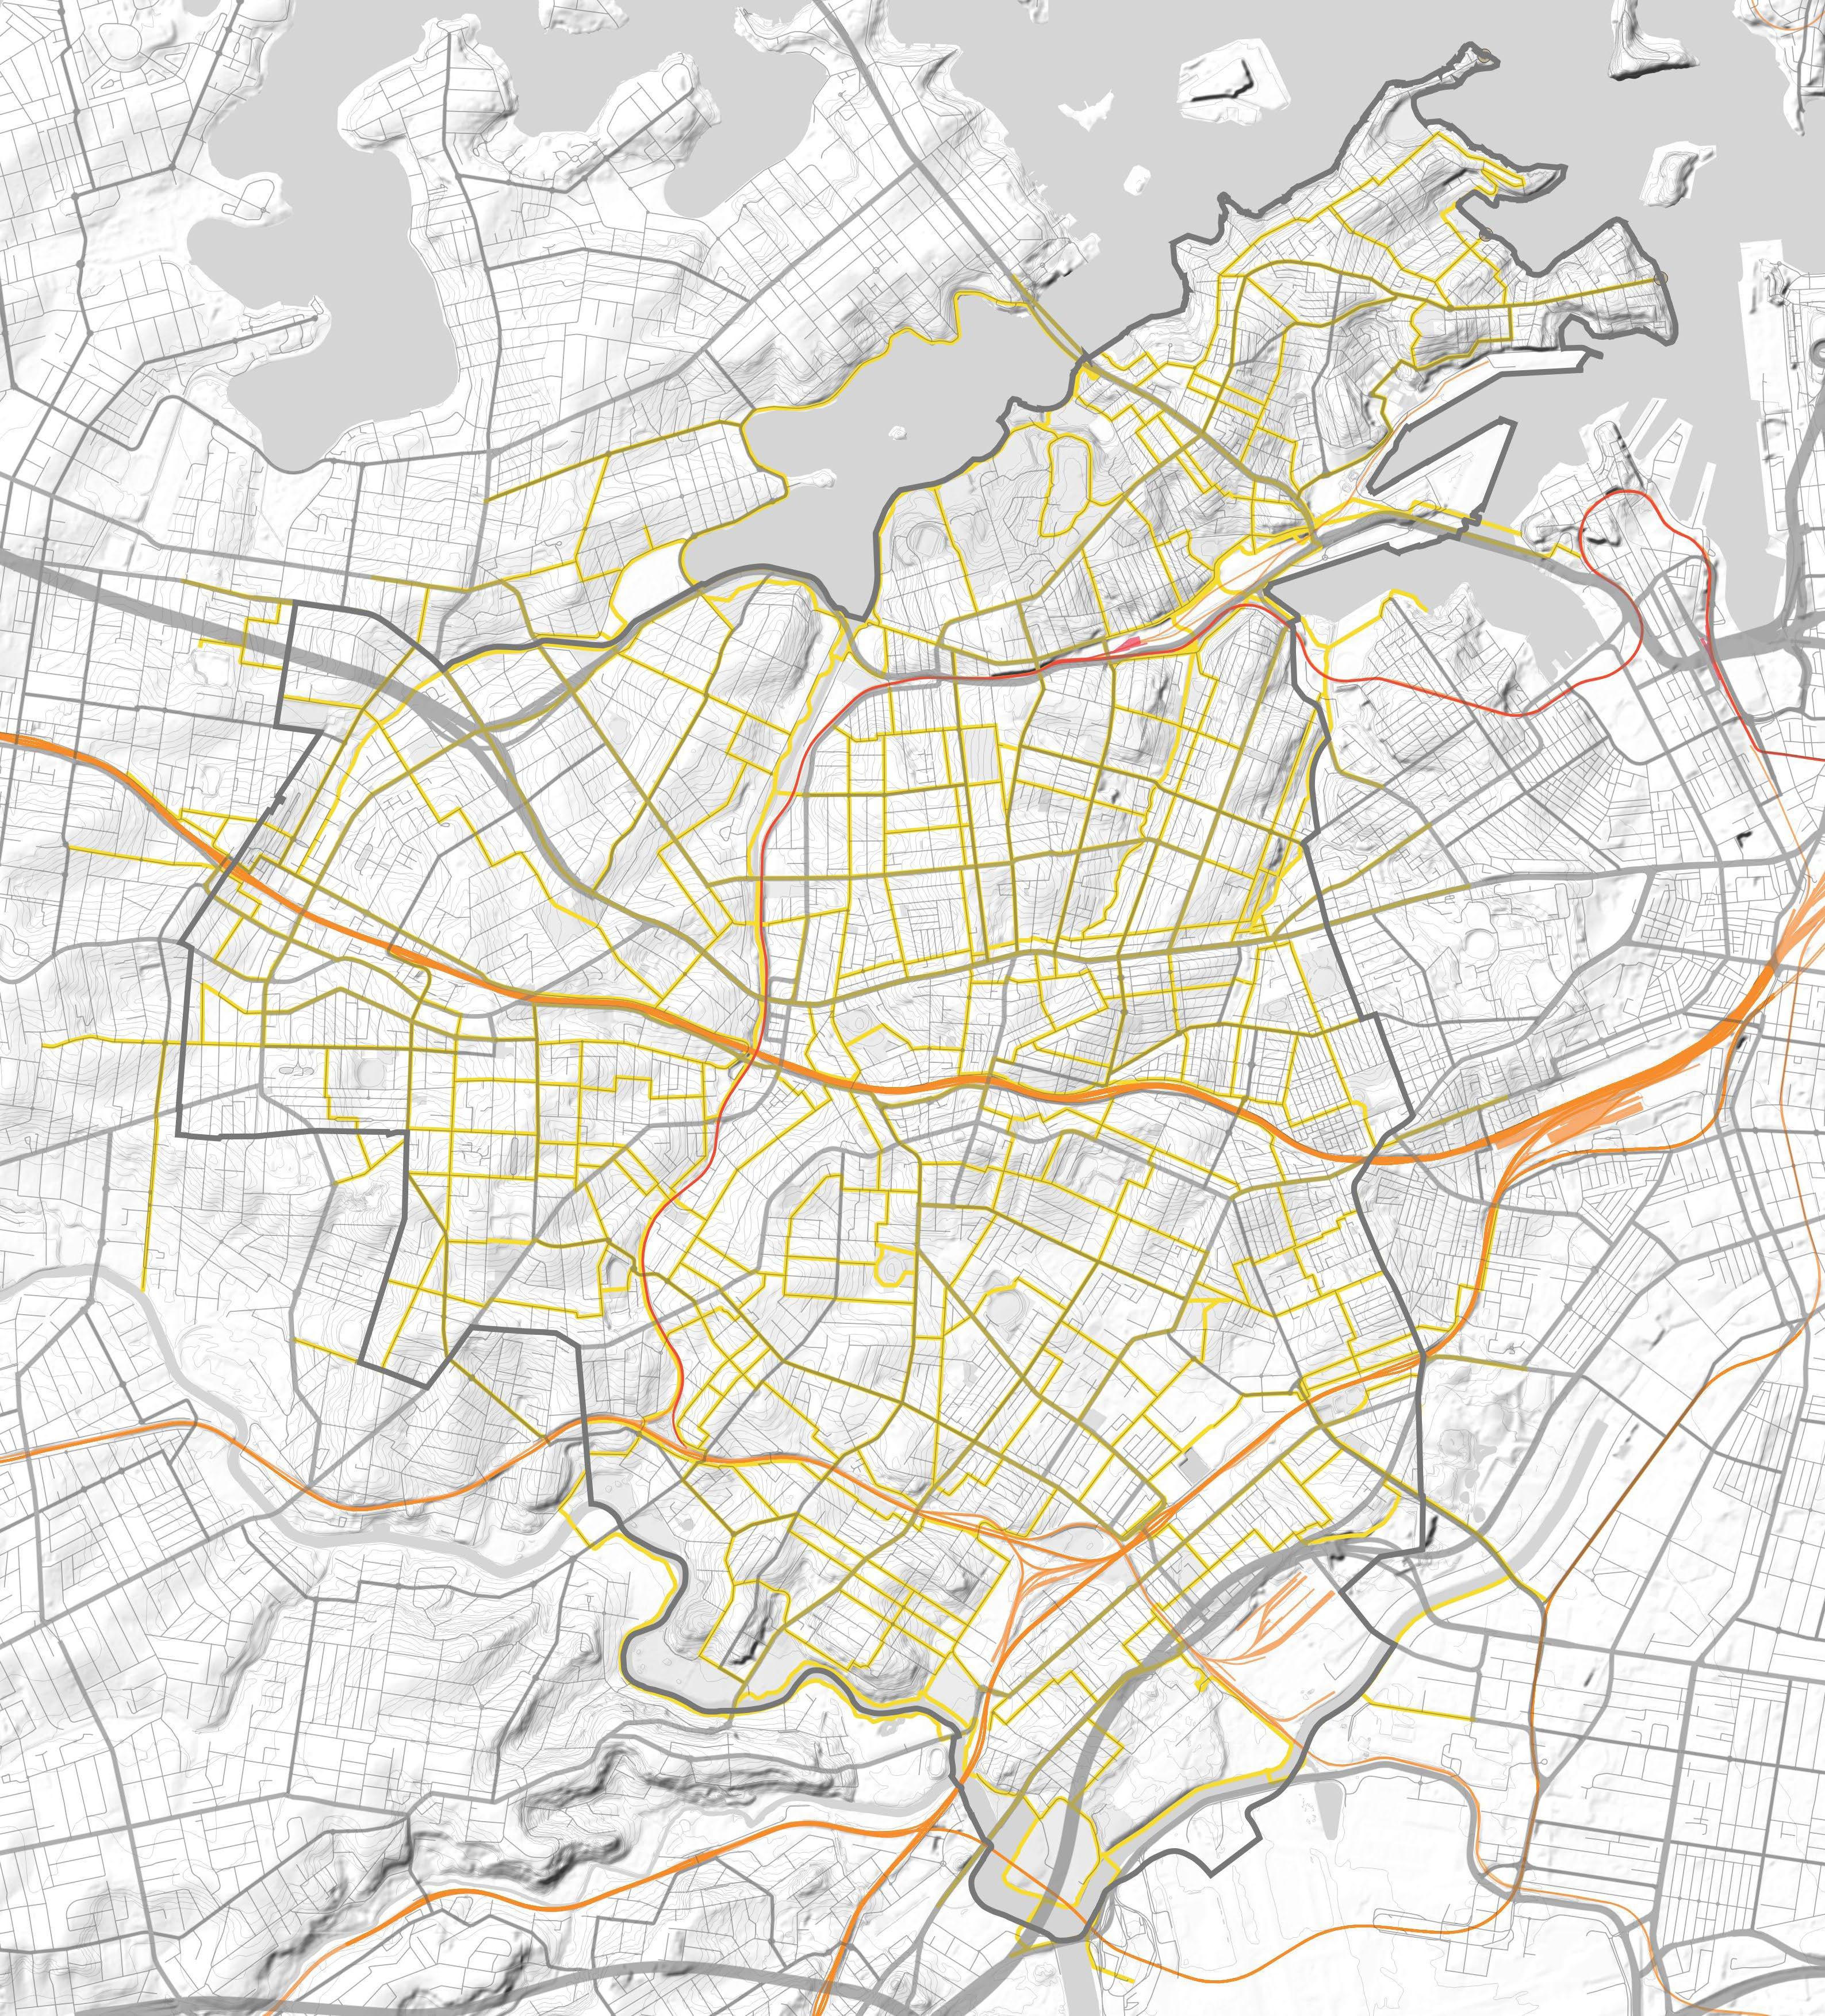
Inner West LGA Boundary
Motorway
Arterial Road
Primary Road
Local Road
Train Line
Train Station
Light Rail
Light Rail Station
Ferry Station
Cycle Routes
Inner West Blue-Green Grid Strategy 2023 131
PrincessHighway PrincessHighway OldCanterburyRoad Hume H ghway
Legend
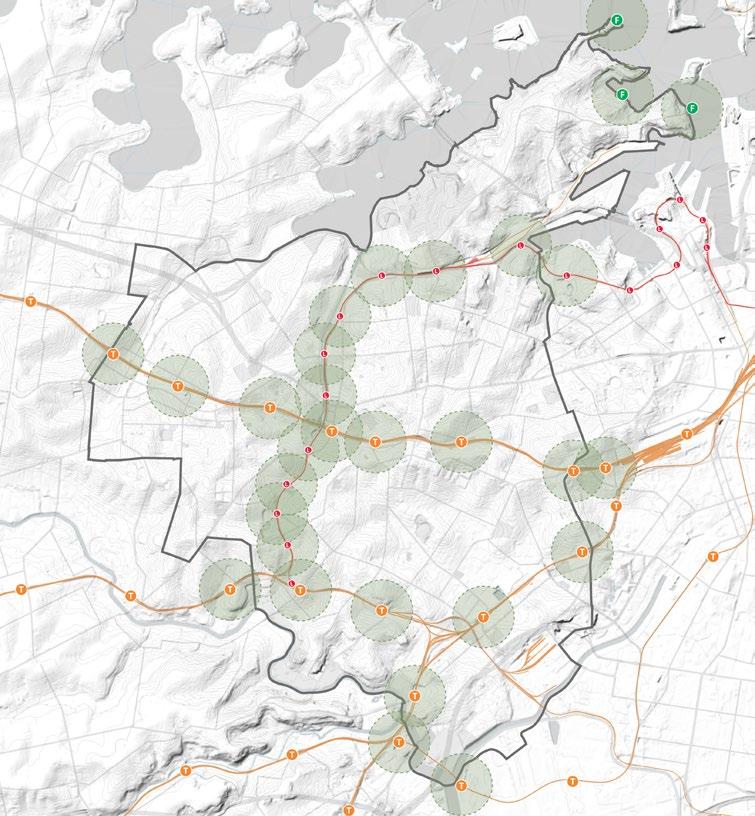
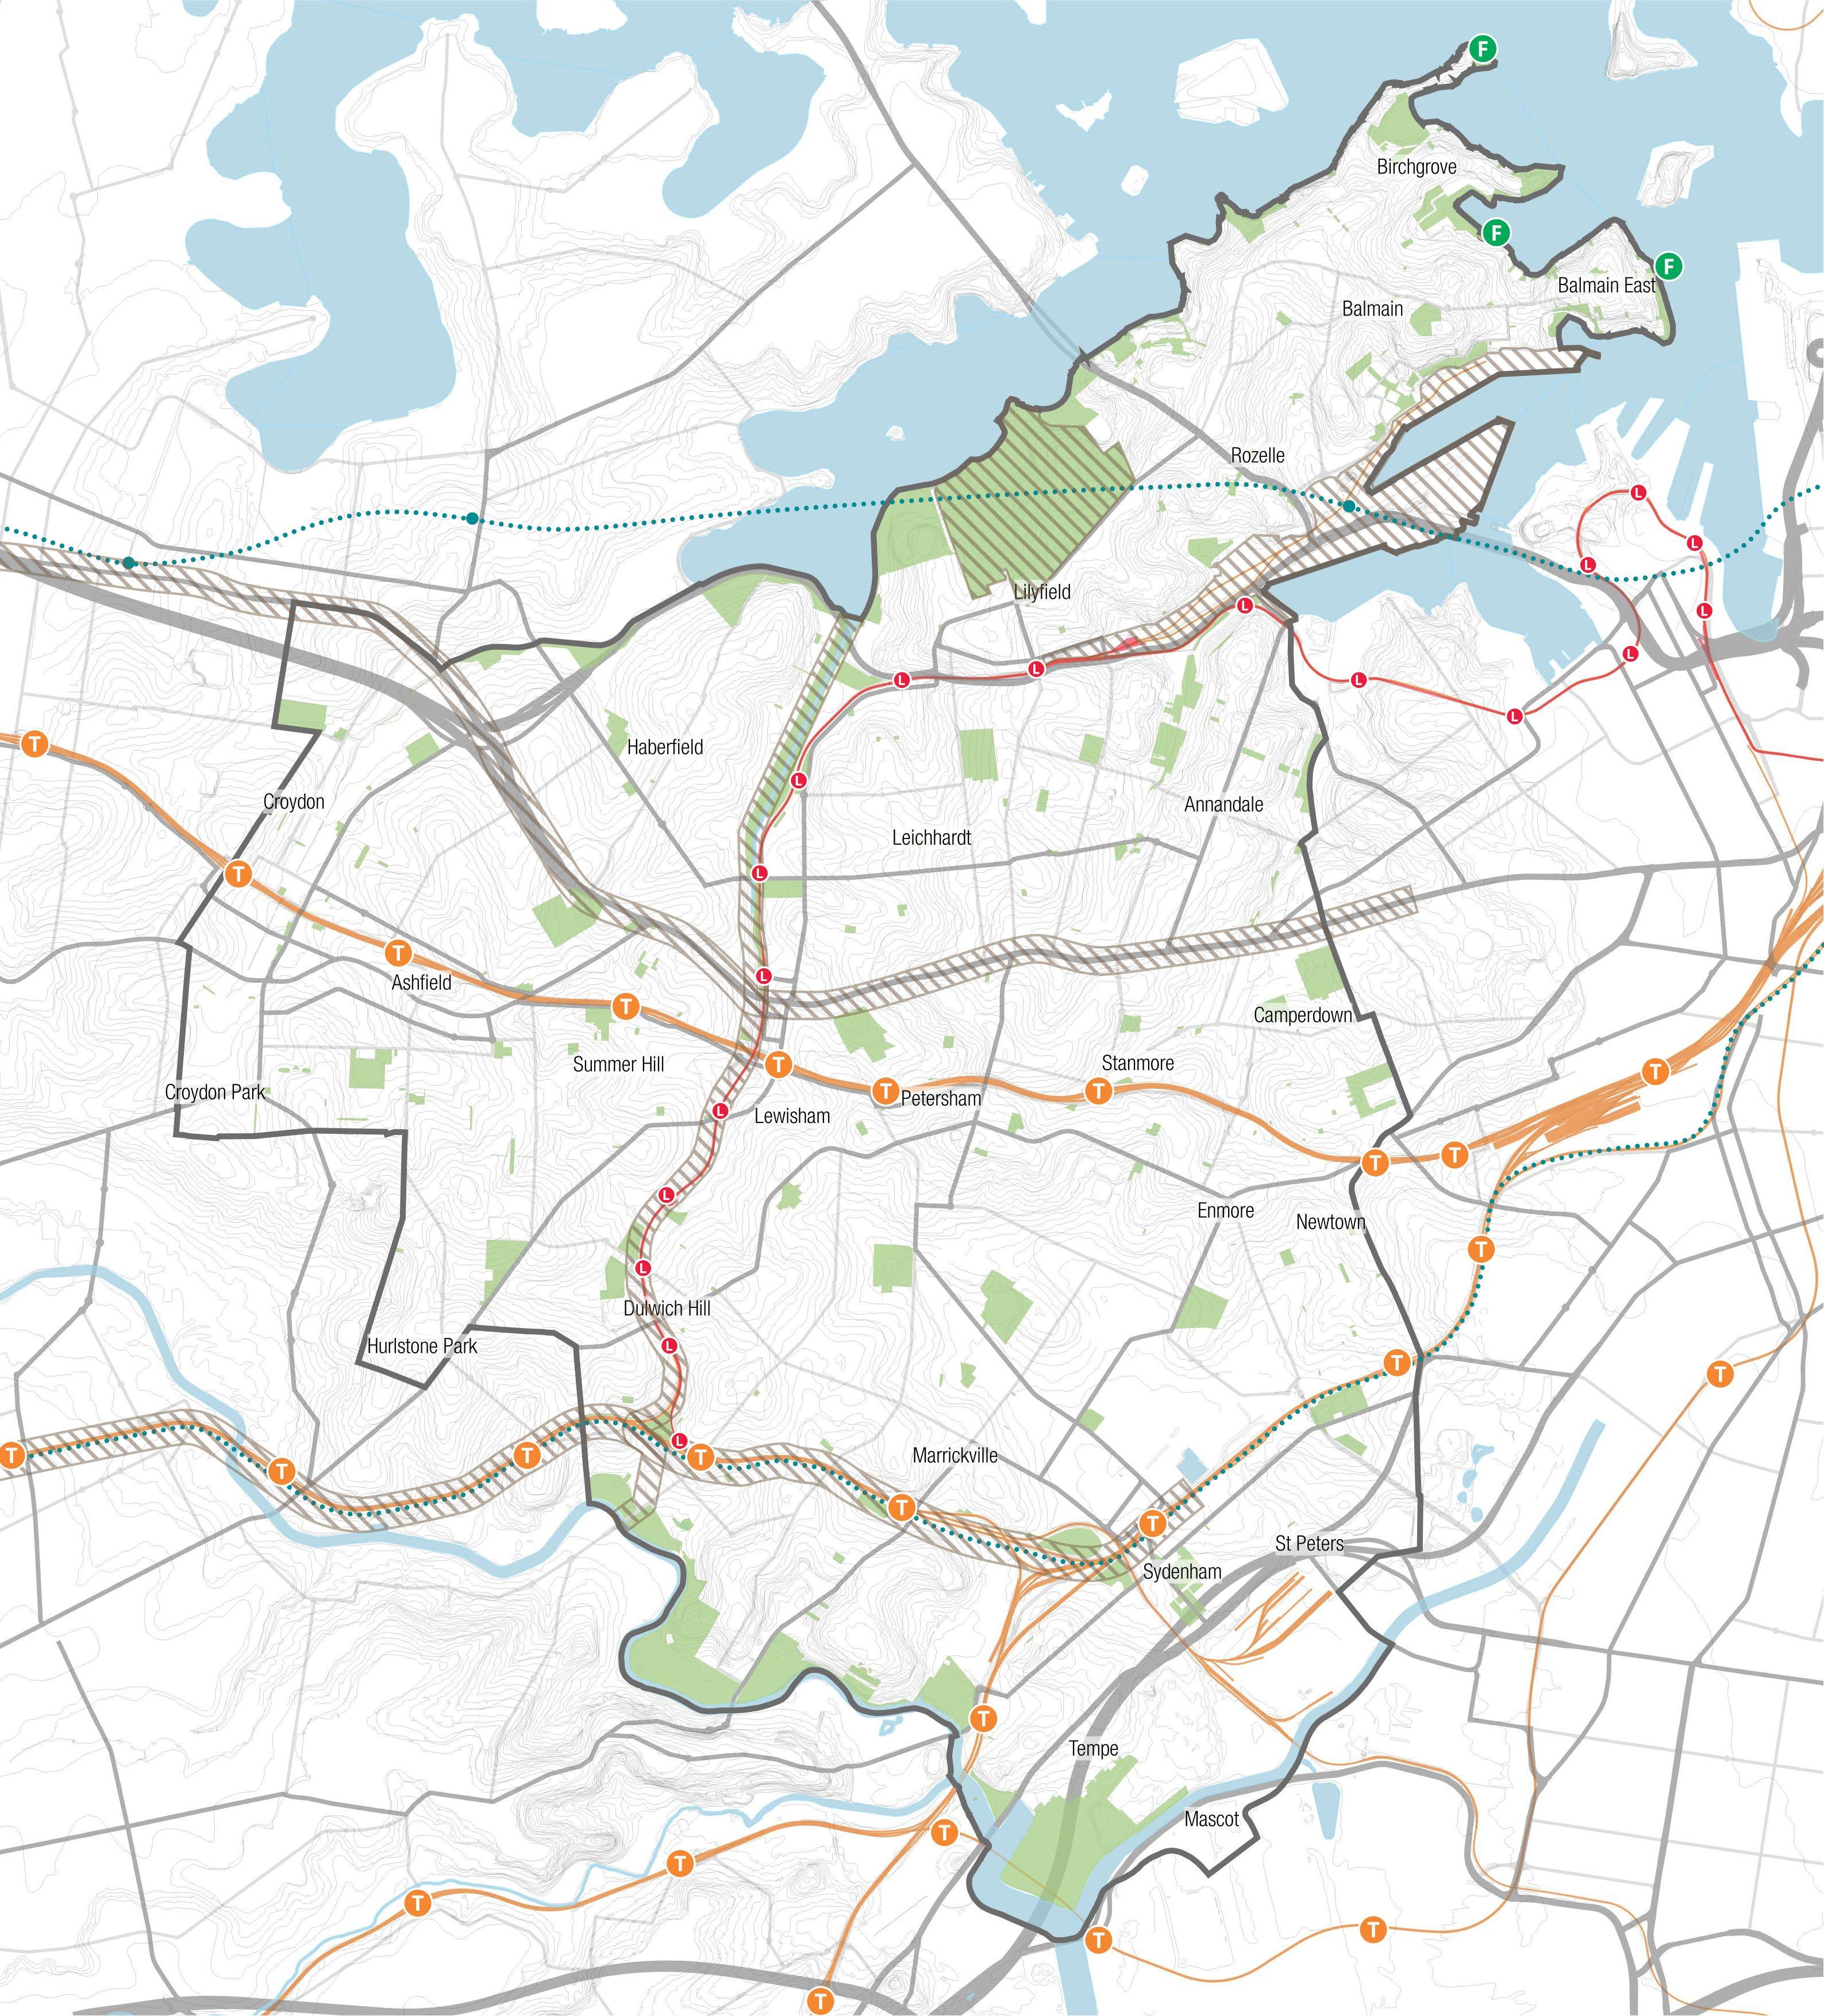
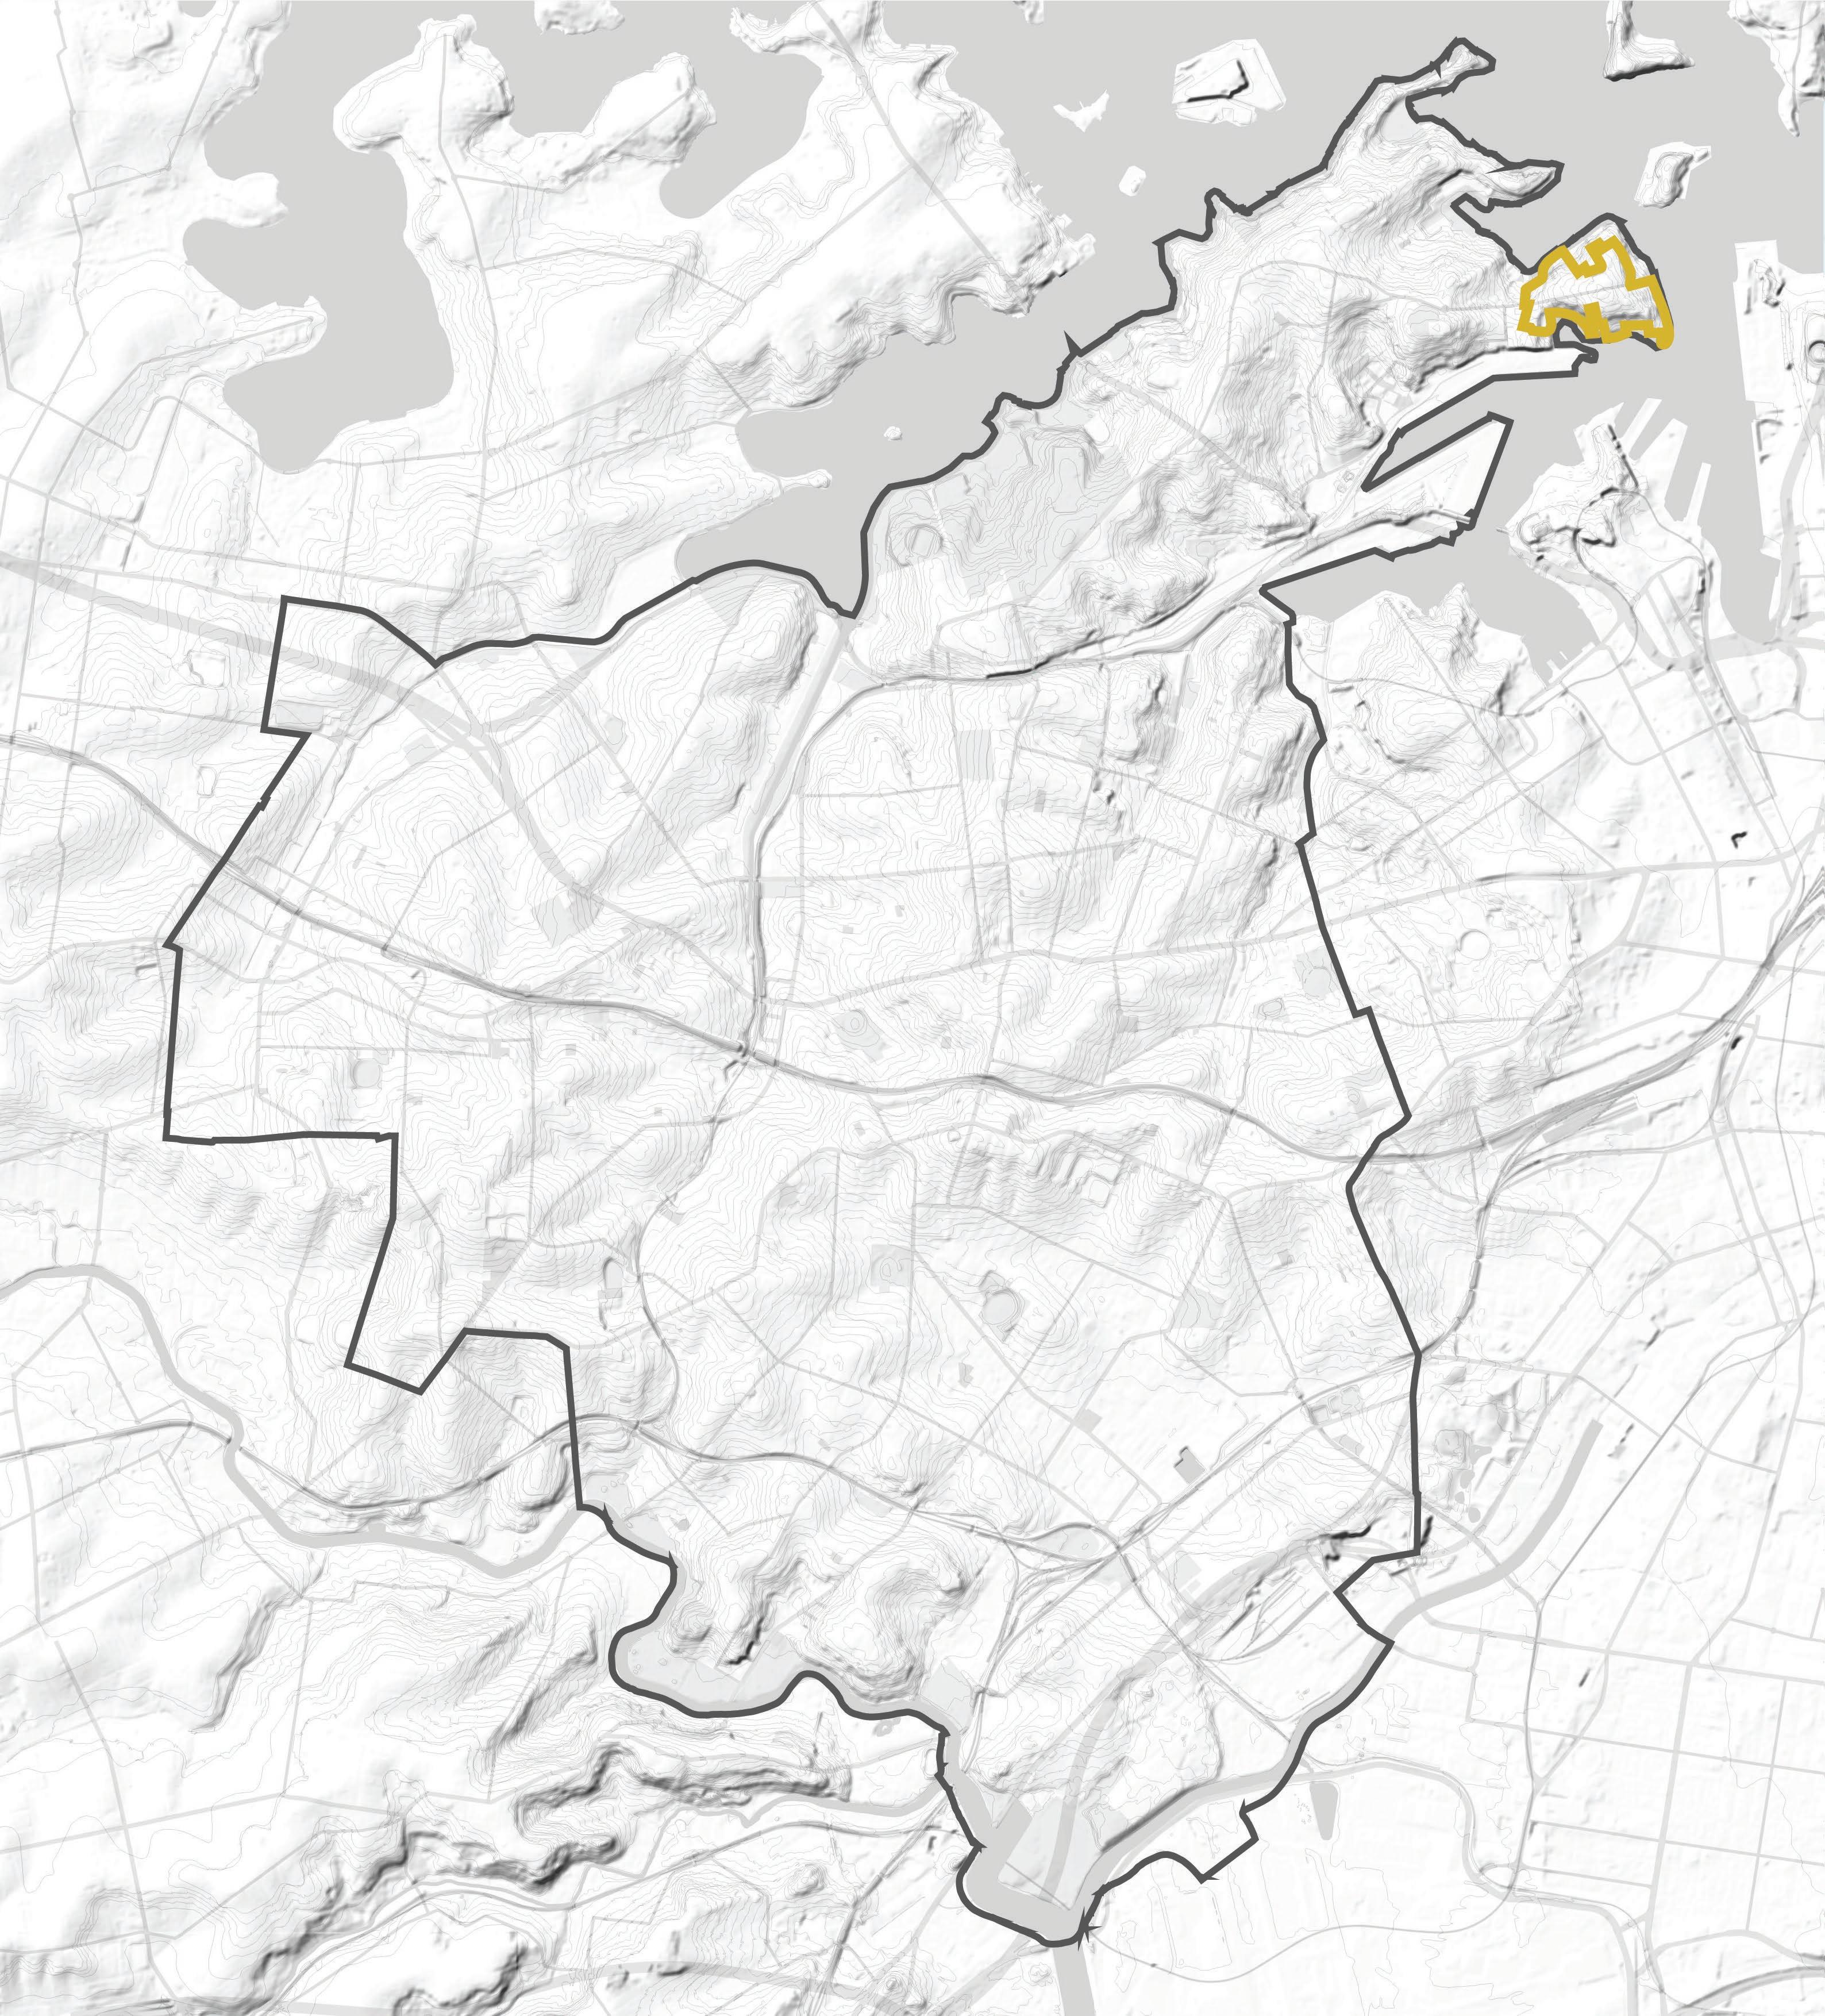
Mapping Layers
Transport Walkability
Whilst the Inner West boasts an excellent rail network, much of the Inner West remains outside the walkable radius of stations.
The Blue-Green Grid can be placed to support longer walking distances, and should be located to create access to stations.
Blue-Green Grid opportunities identified in 7 areas that lack suitable walking connectivity to stations.
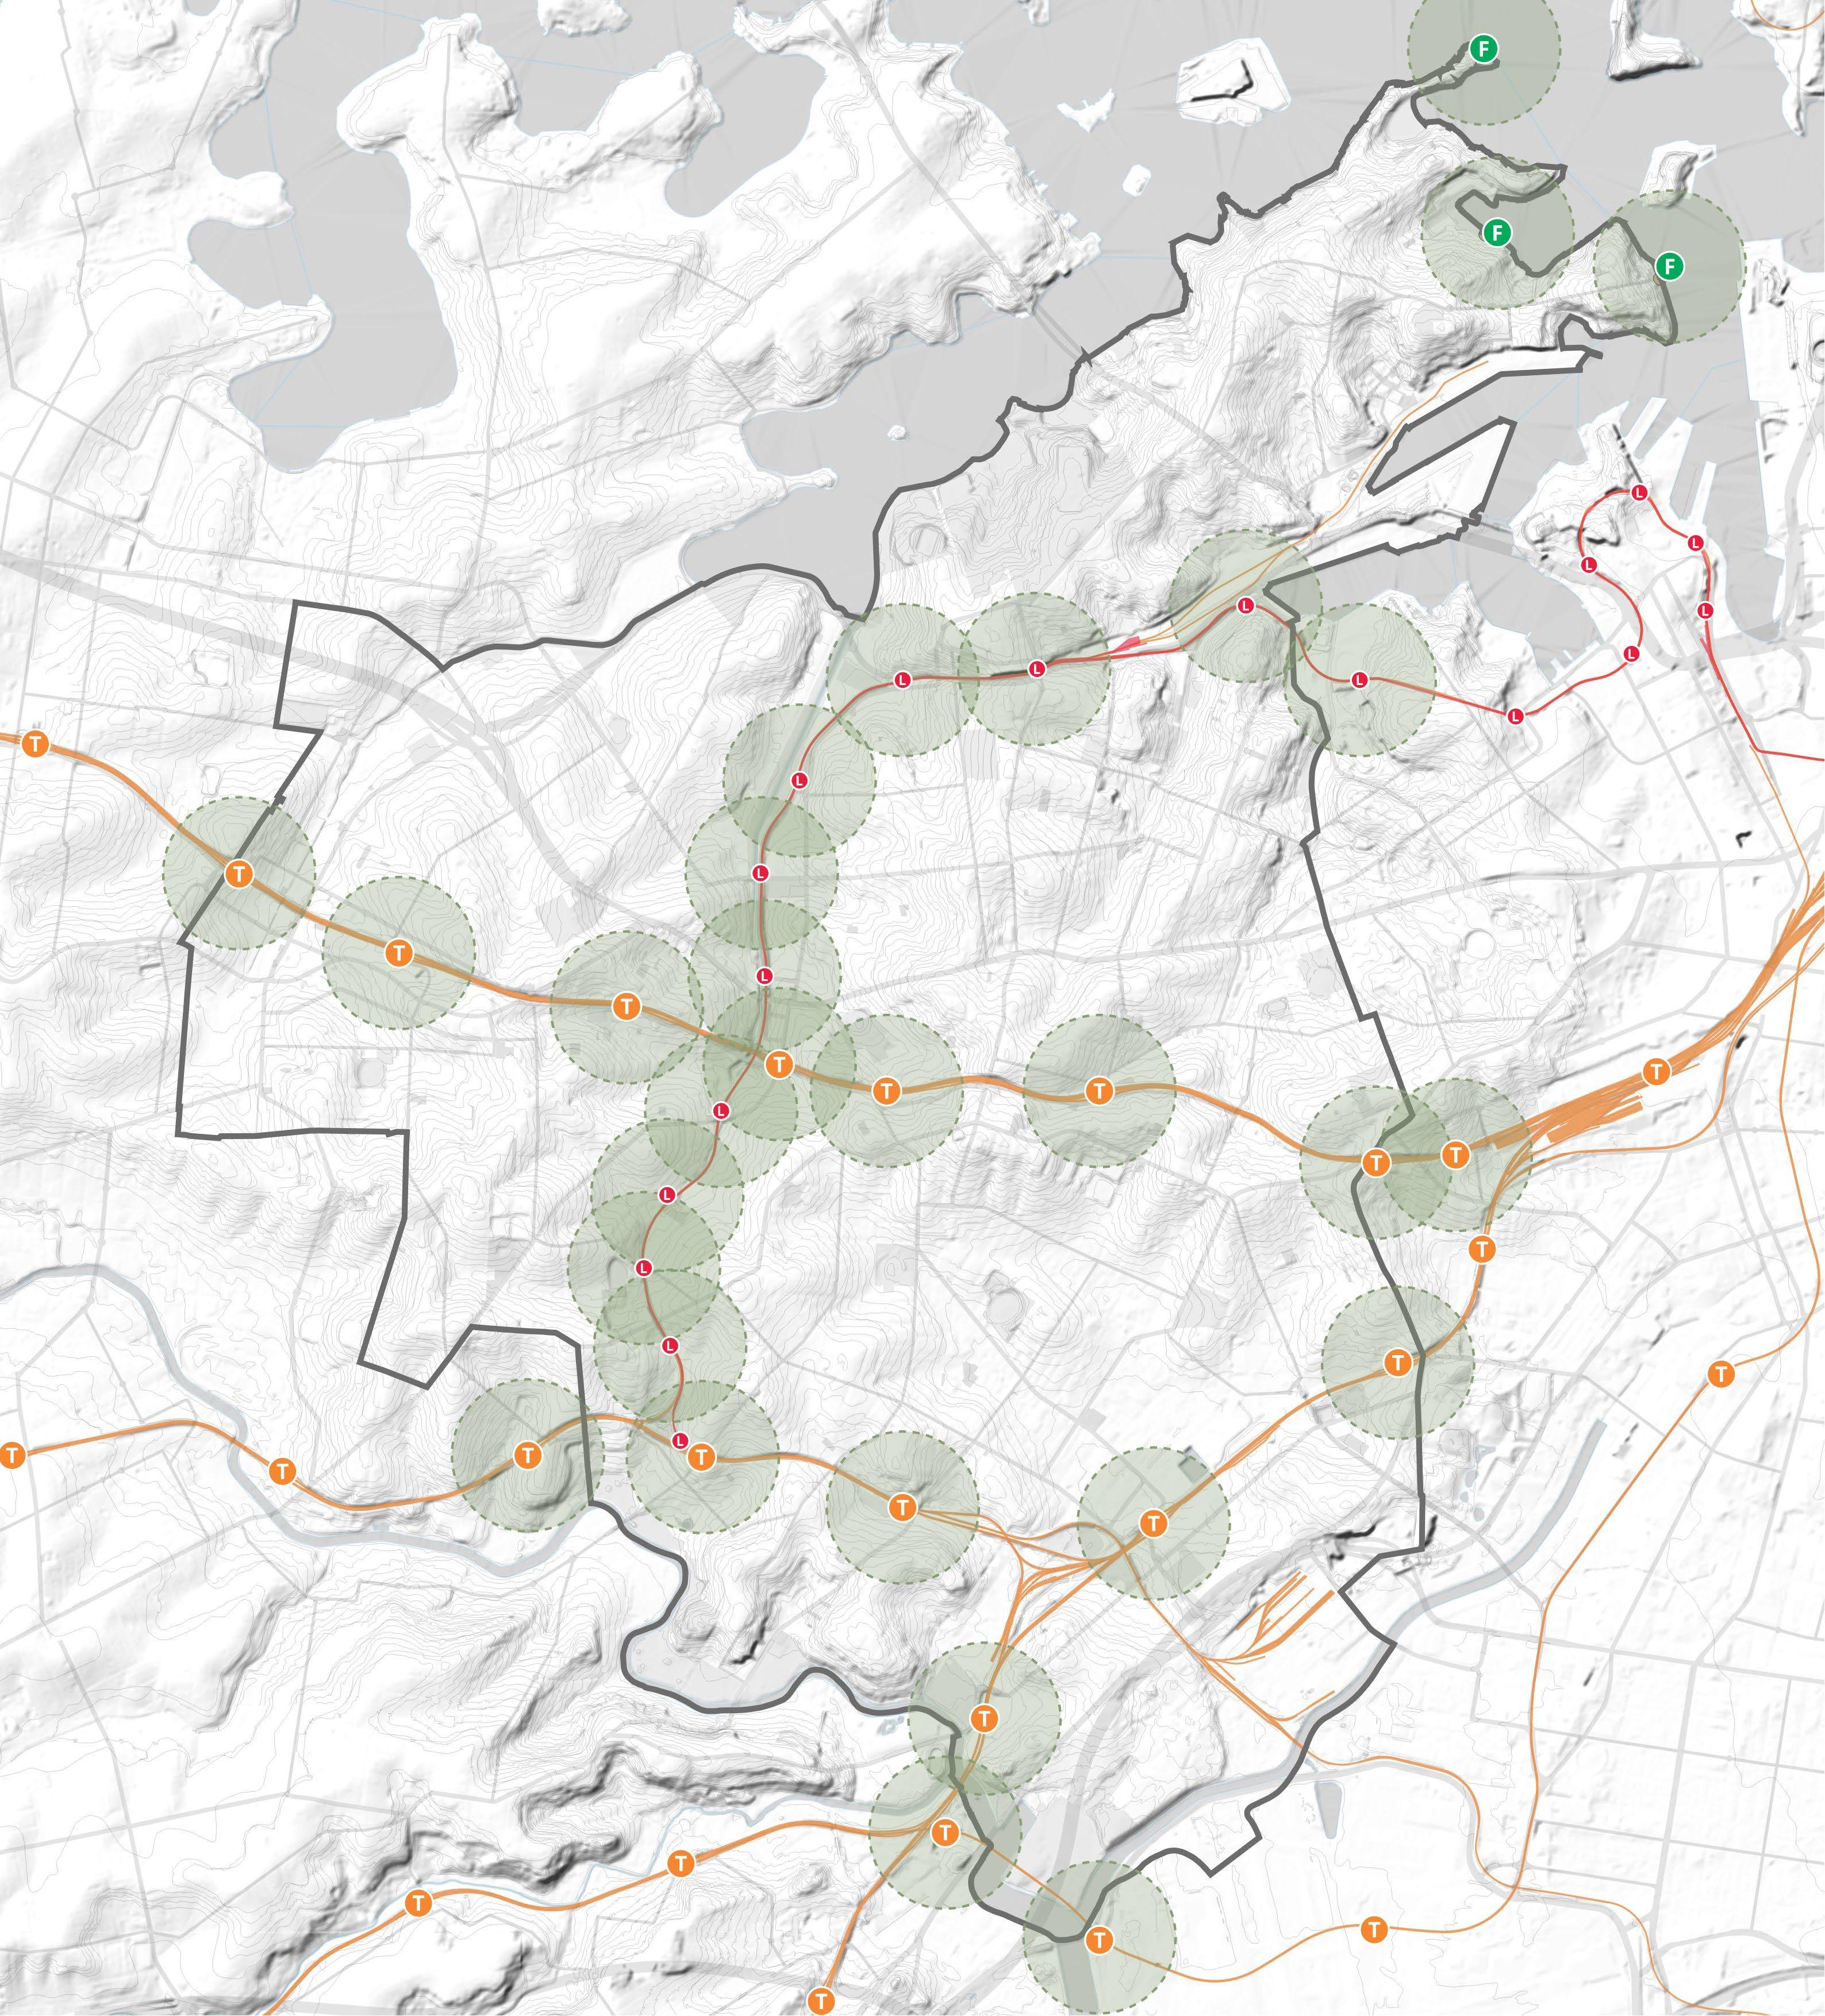
Map Source: Shapefiles provided by Inner West Council, NSW DPIE, Six Maps.
Legend
Inner West LGA Boundary
Train Line
Train Station
Light Rail
Light Rail Station
Ferry Station
400m Walkable Radius
Hurlstone Park
Croydon Park
Camperdown
Balmain East
Summer Hill
Dulwich Hill Marrickville
Petersham
Birchgrove
Annandale
Sydenham
Leichhardt Lewisham
Stanmore Newtown
St Peters
Croydon
Balmain
Enmore Mascot Tempe
Rozelle 1 2 3 4 5 6 7
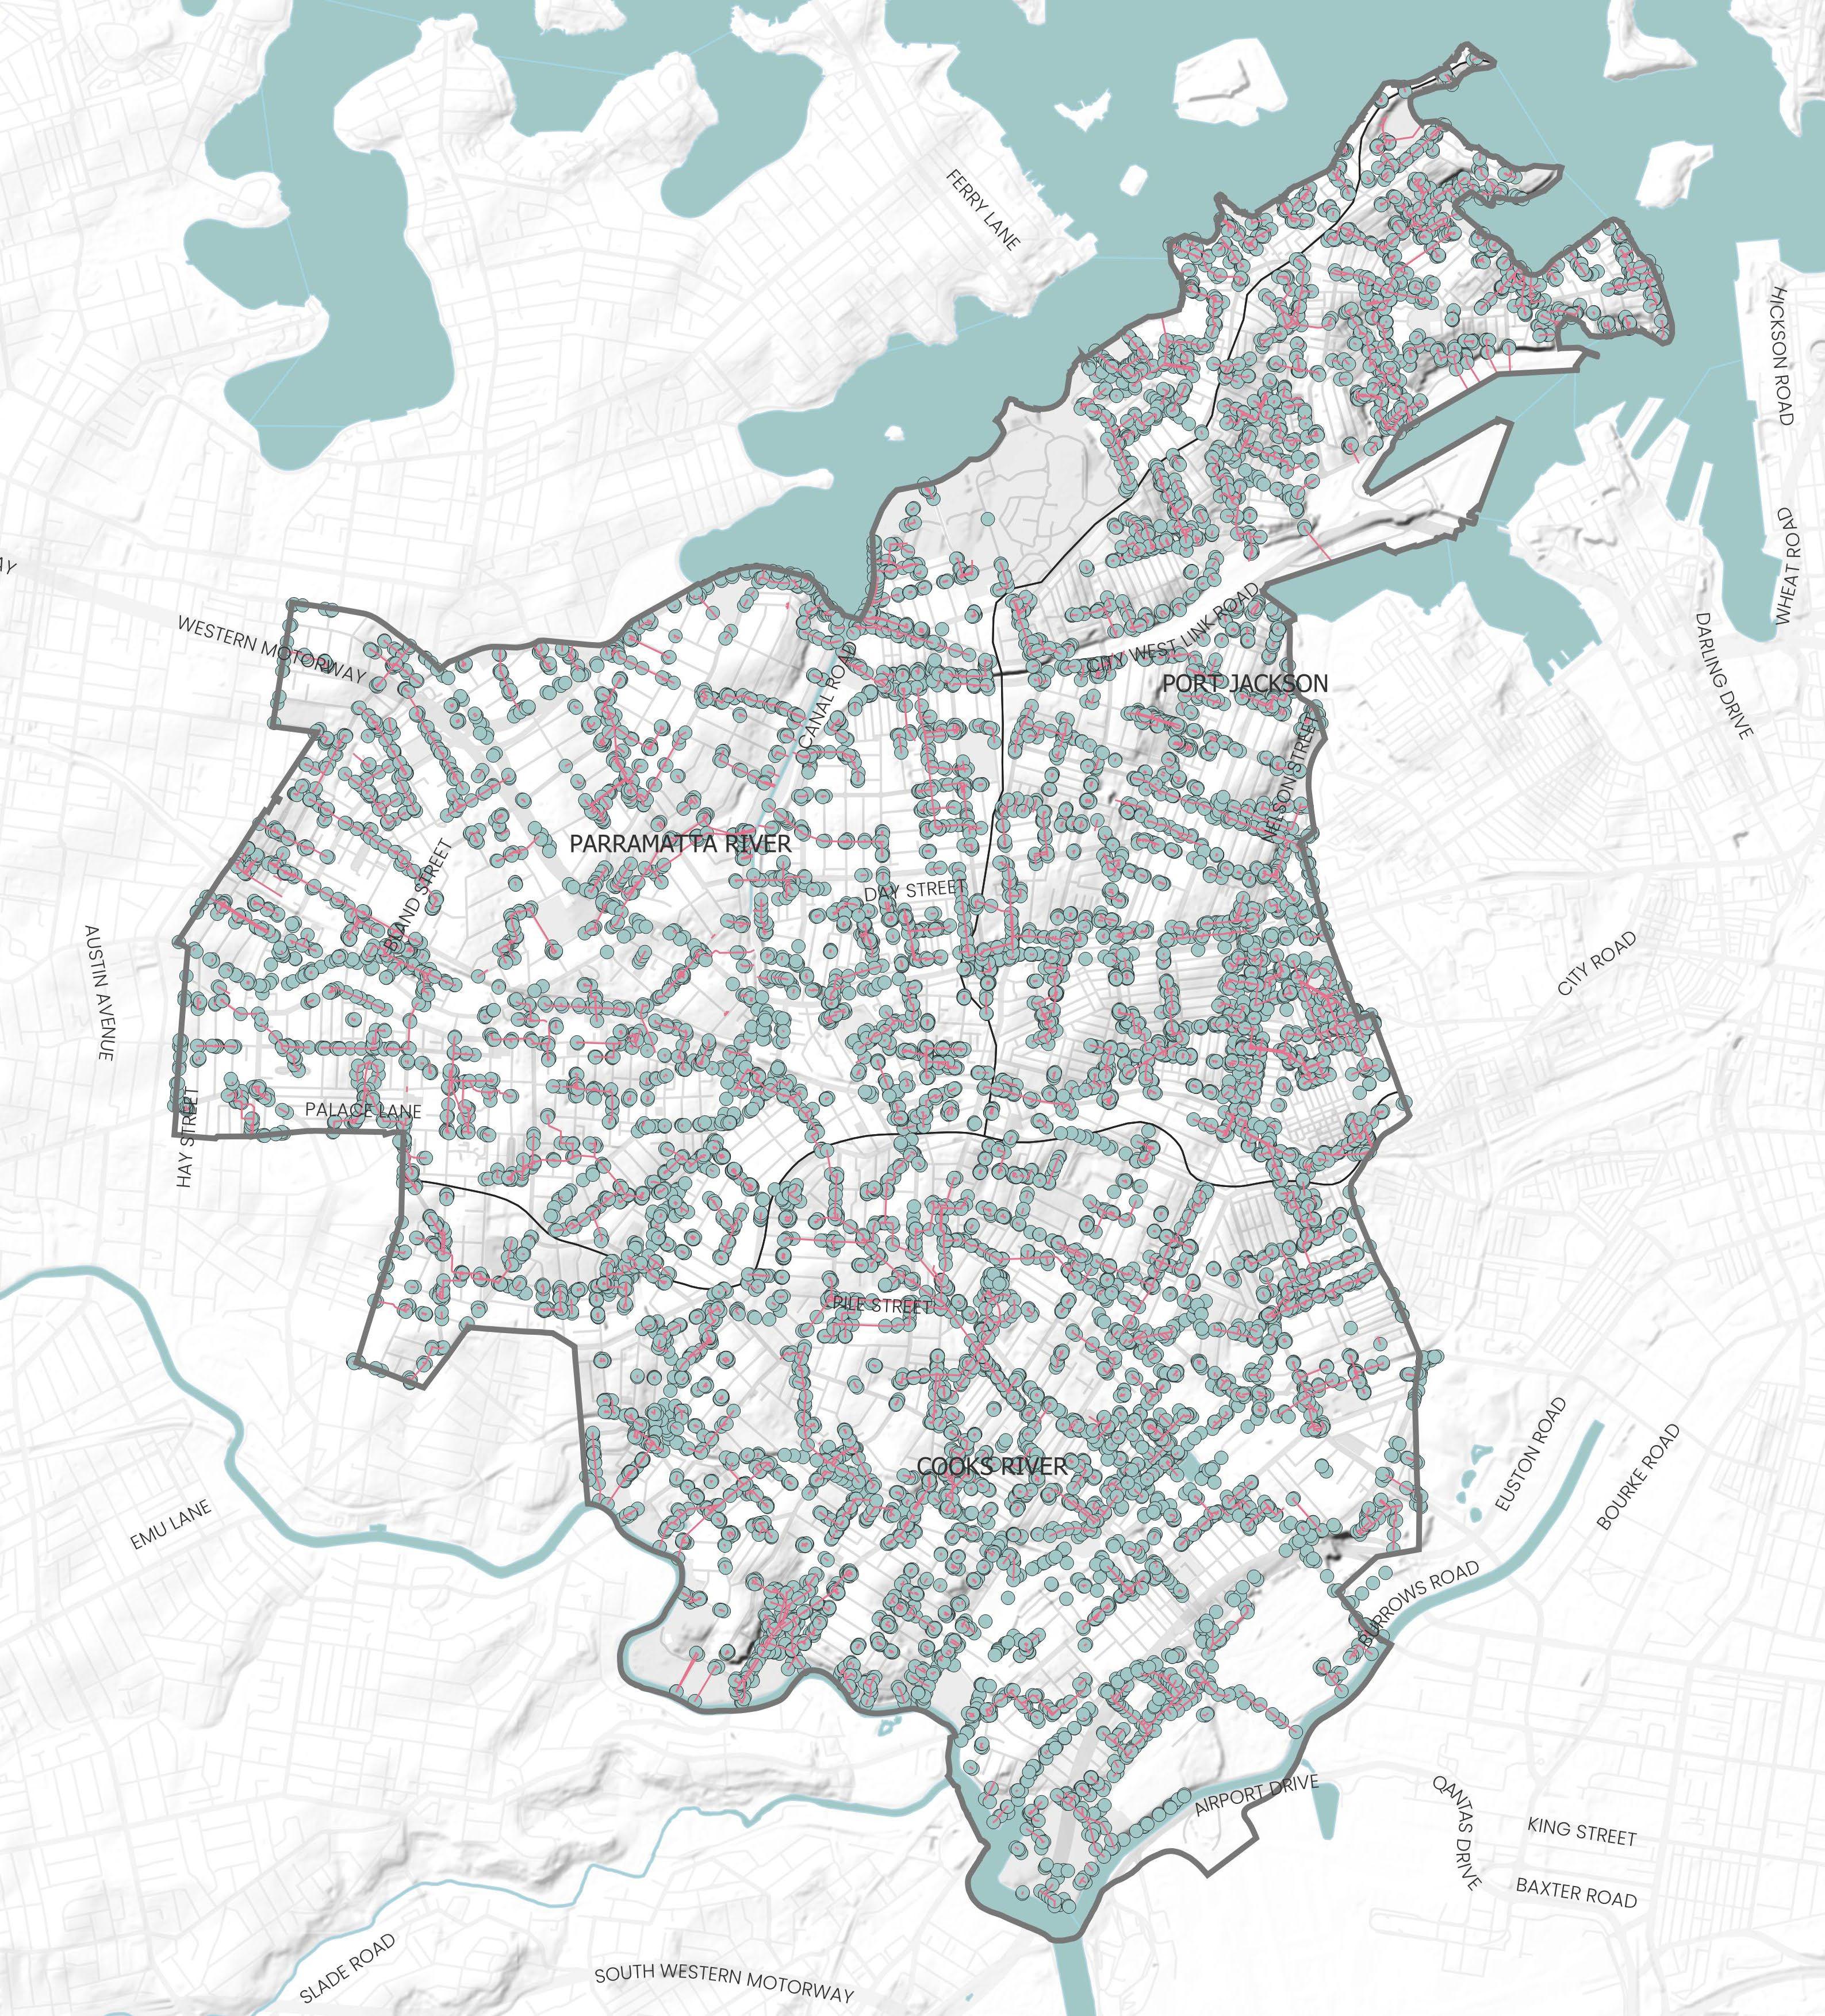
Mapping Layers
Pedestrian Hotspots
The pedestrian heat map represents an aggregate of pedestrian activity across the LGA. The pedestrian location points is a collection of raw data set of mobile location data acquired from Echo Analytics. The spatial analysis technique uses this data set with density calculation to estimate density-clusters across a study area. It calculates the density of events (such as occurrences, observations, or incidents) by spreading the influence of each event throughout the study area using a kernel function. The resulting output of this analysis method helps in analysing pedestrian mobility and behaviour with the LGA.
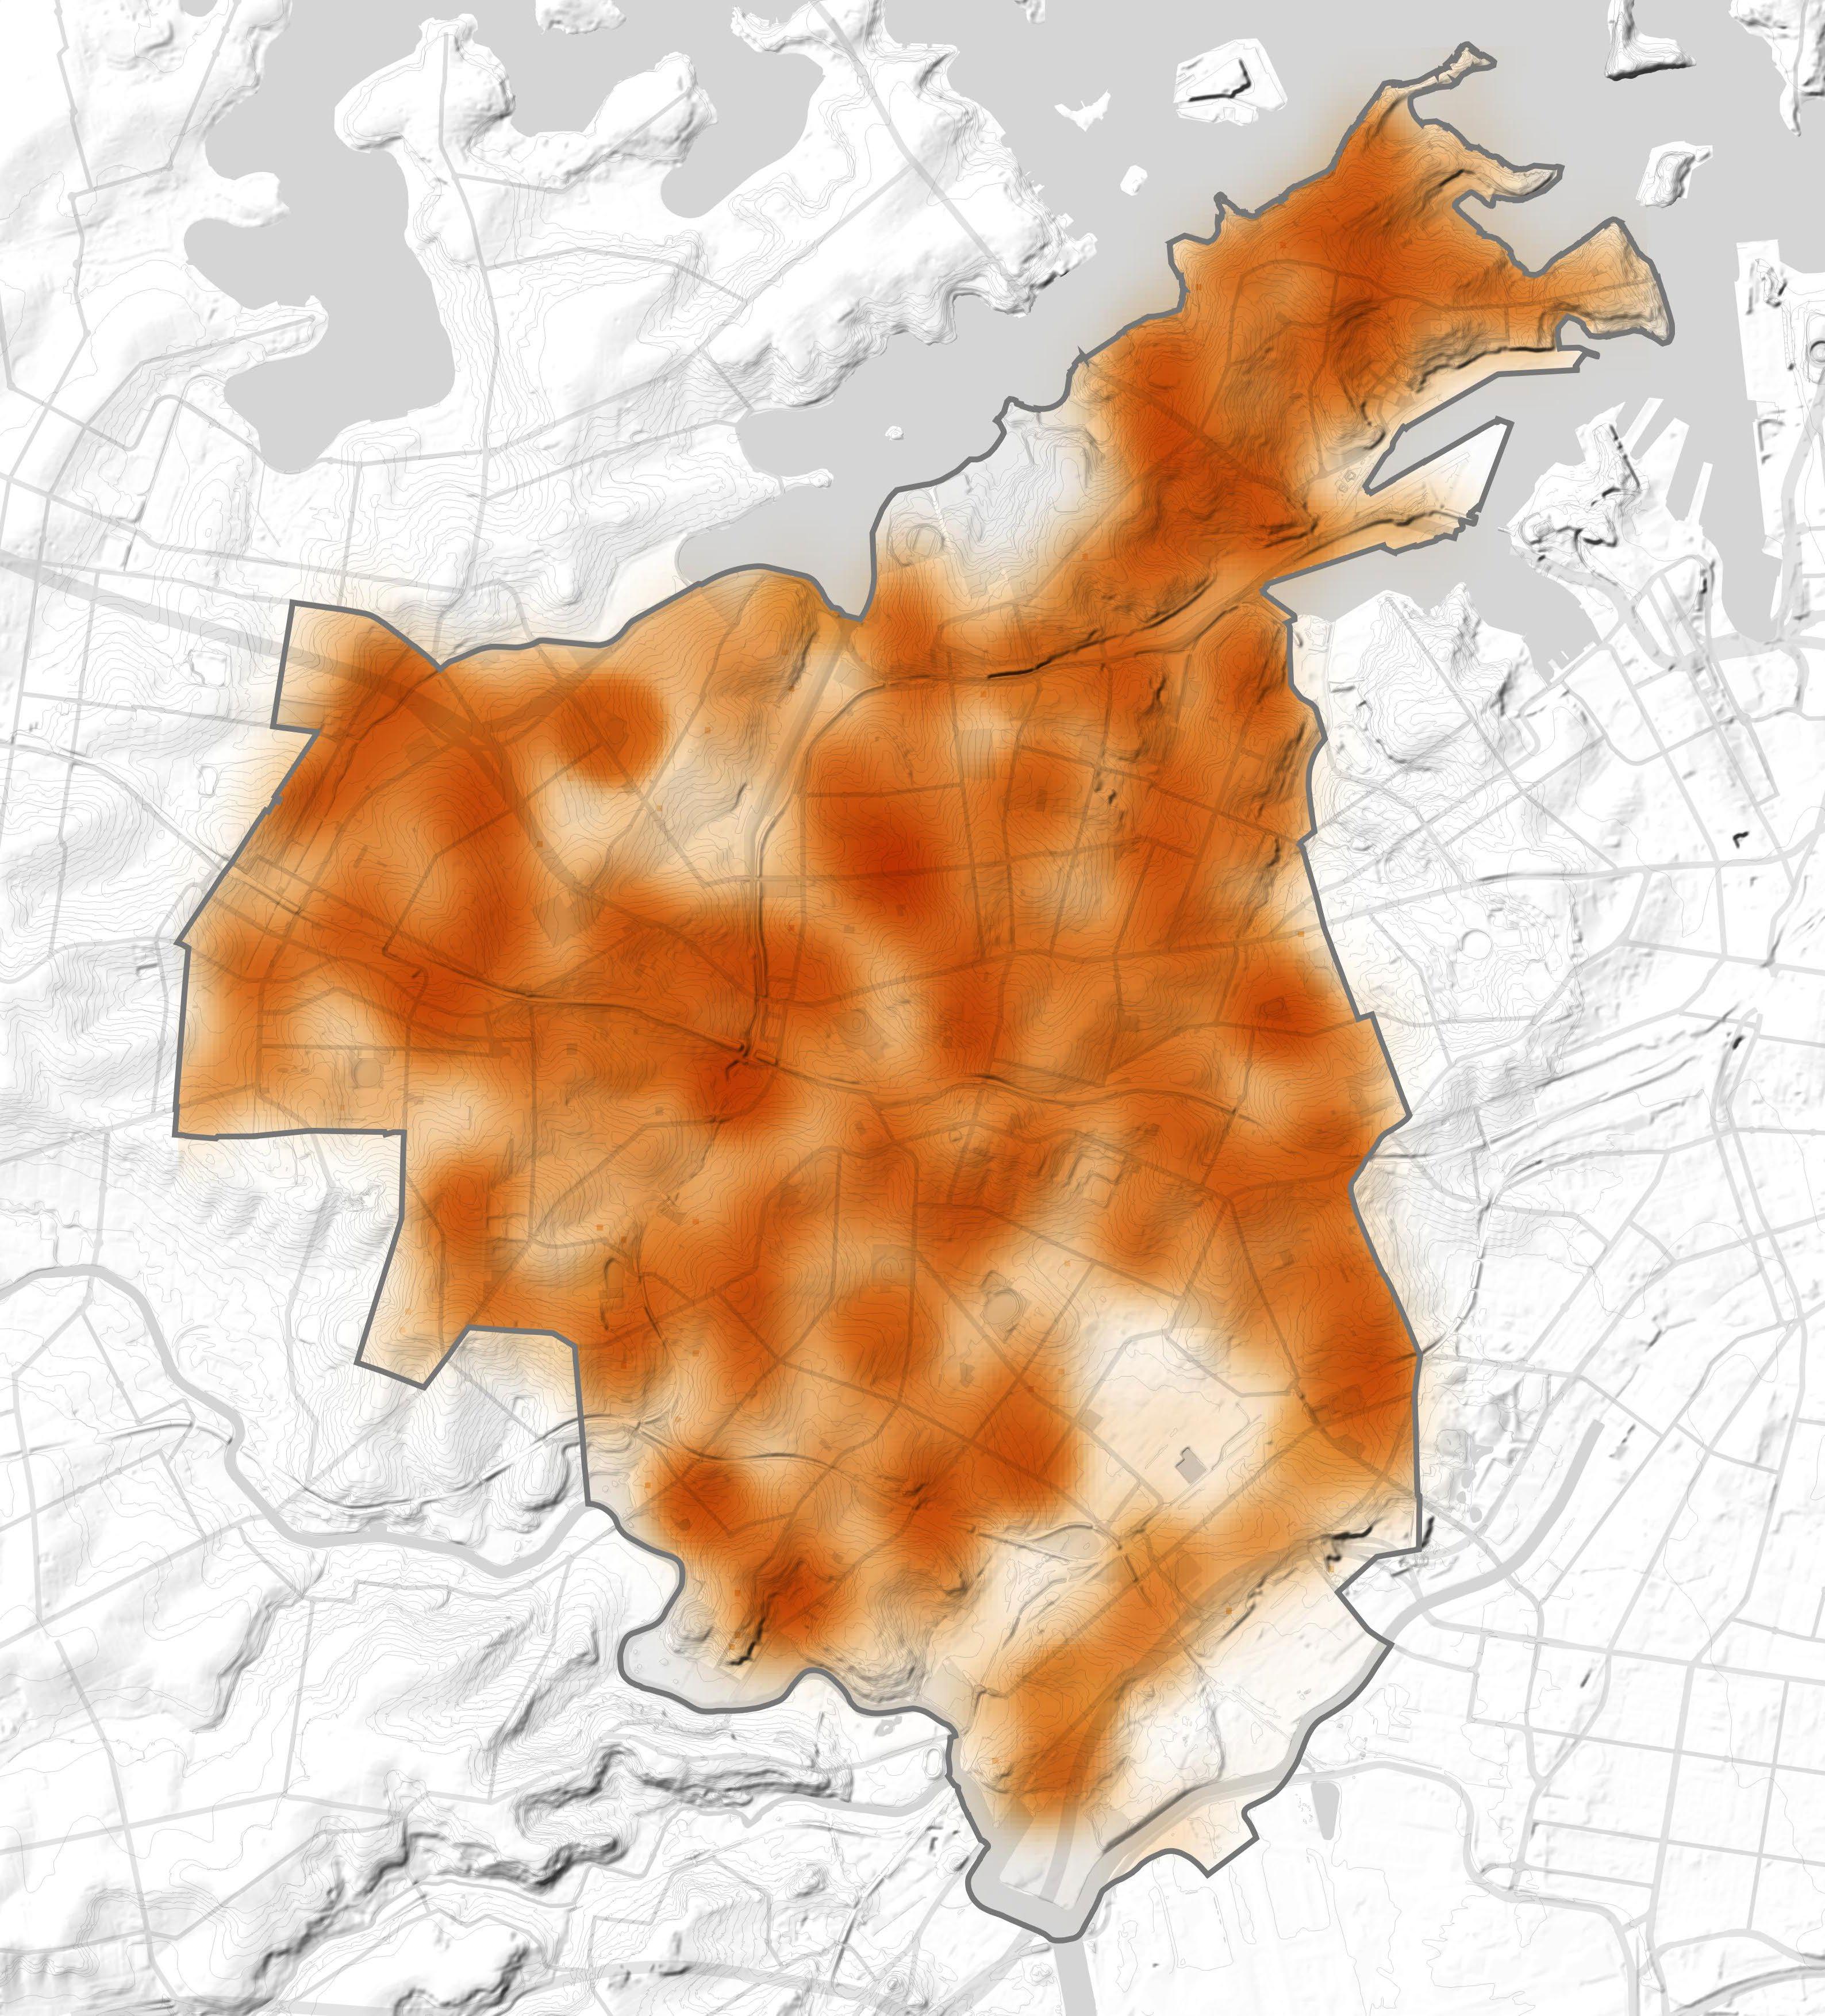
The Blue-Green Grid will go through commonly used routes. This map uses GPS data which mapped locations of people at different times of the day. A heat map was then created using an algorithm that identifies multiple data sets in high location concentration.
Map Source: Echo Analytics.
Map produced by McGregor Coxall with GIS.
Legend
Inner West LGA
Boundary
More footfall
Less footfall
Inner West Blue-Green Grid Strategy 2023 133
Mapping Layers
Public Art
There is Opportunity for public art to comprise some of the Blue-Green Grid to promote art and culture.
Map source: https://www.innerwest.nsw.gov.au/explore/ parks-sport-and-recreation/walking-and-cycling/ walking-and-cycling-routes

Legend
Inner West LGA Boundary
Identified Public Art
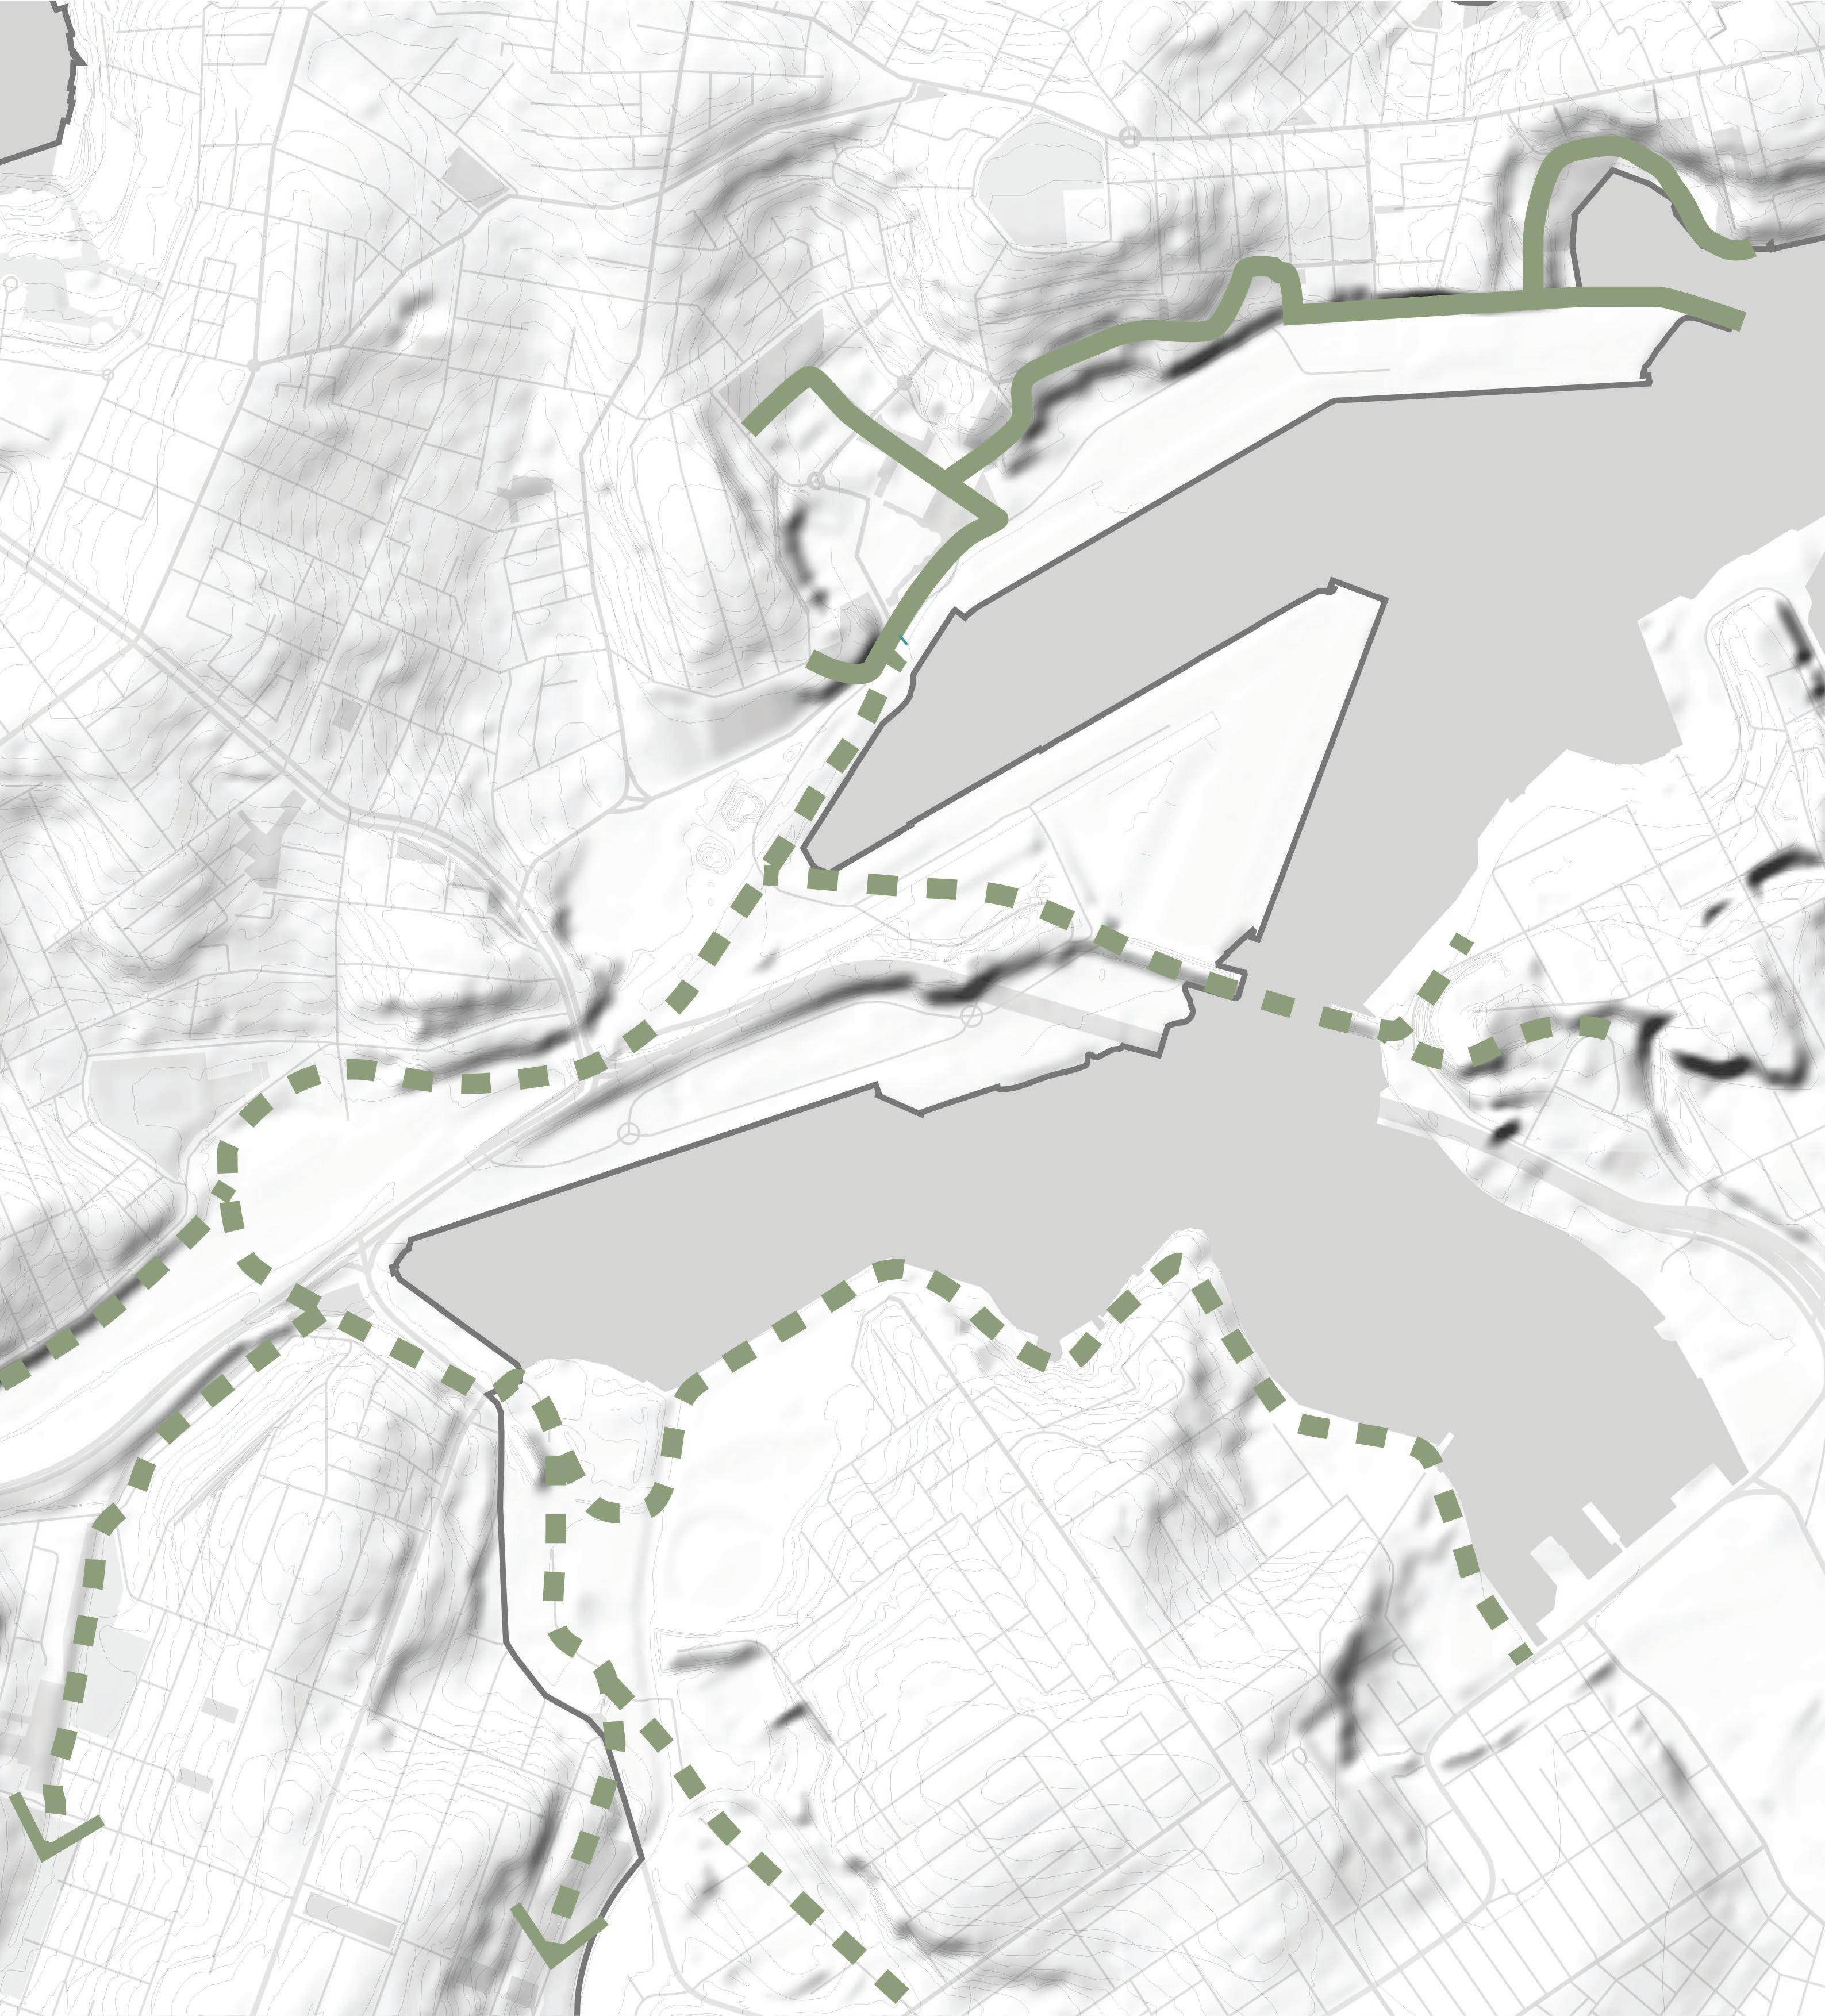
Mapping Layers
Heritage Walks
Trails can contribute to the Blue-Green Grid as existing routes.
Map source: https://www.innerwest.nsw.gov.au/explore/ parks-sport-and-recreation/walking-and-cycling/ walking-and-cycling-routes.
Legend
Inner West LGA Boundary
Local walking tracks
Inner West Blue-Green Grid Strategy 2023 135
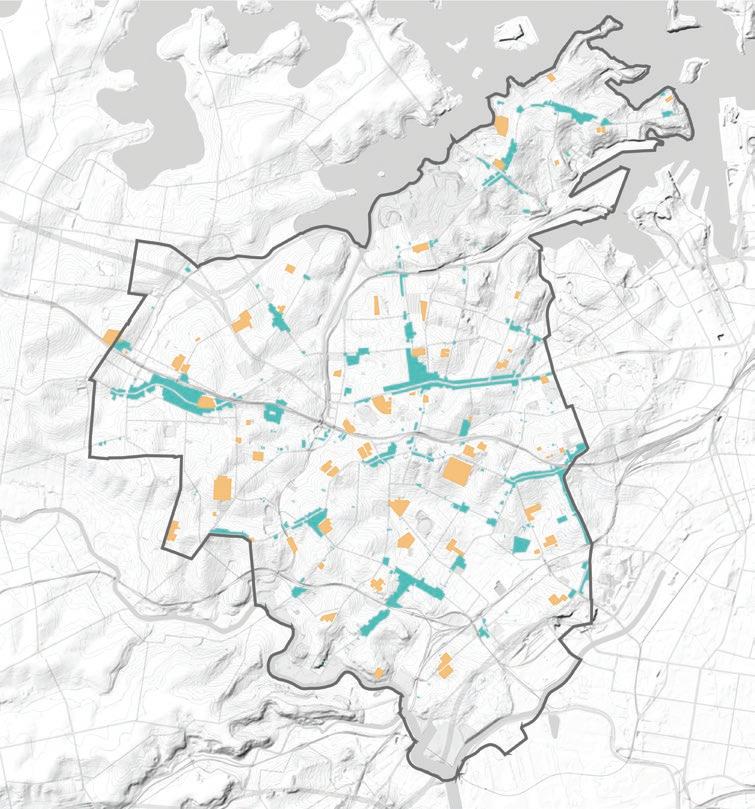
Mapping Layers
Footpath Widths
Footpaths around the Inner West vary in width, shown in the adjacent map.
The width of the footpath impacts how they can be used, the safety of users, streetscape and implementation of blue and green infrastructure. Wider footpaths offer more opportunity due to adequate space allowing the addition of greenery and WSUD.
This map was used on the implementation stage to indicate actions in priority areas.
Map source: Inner West Council
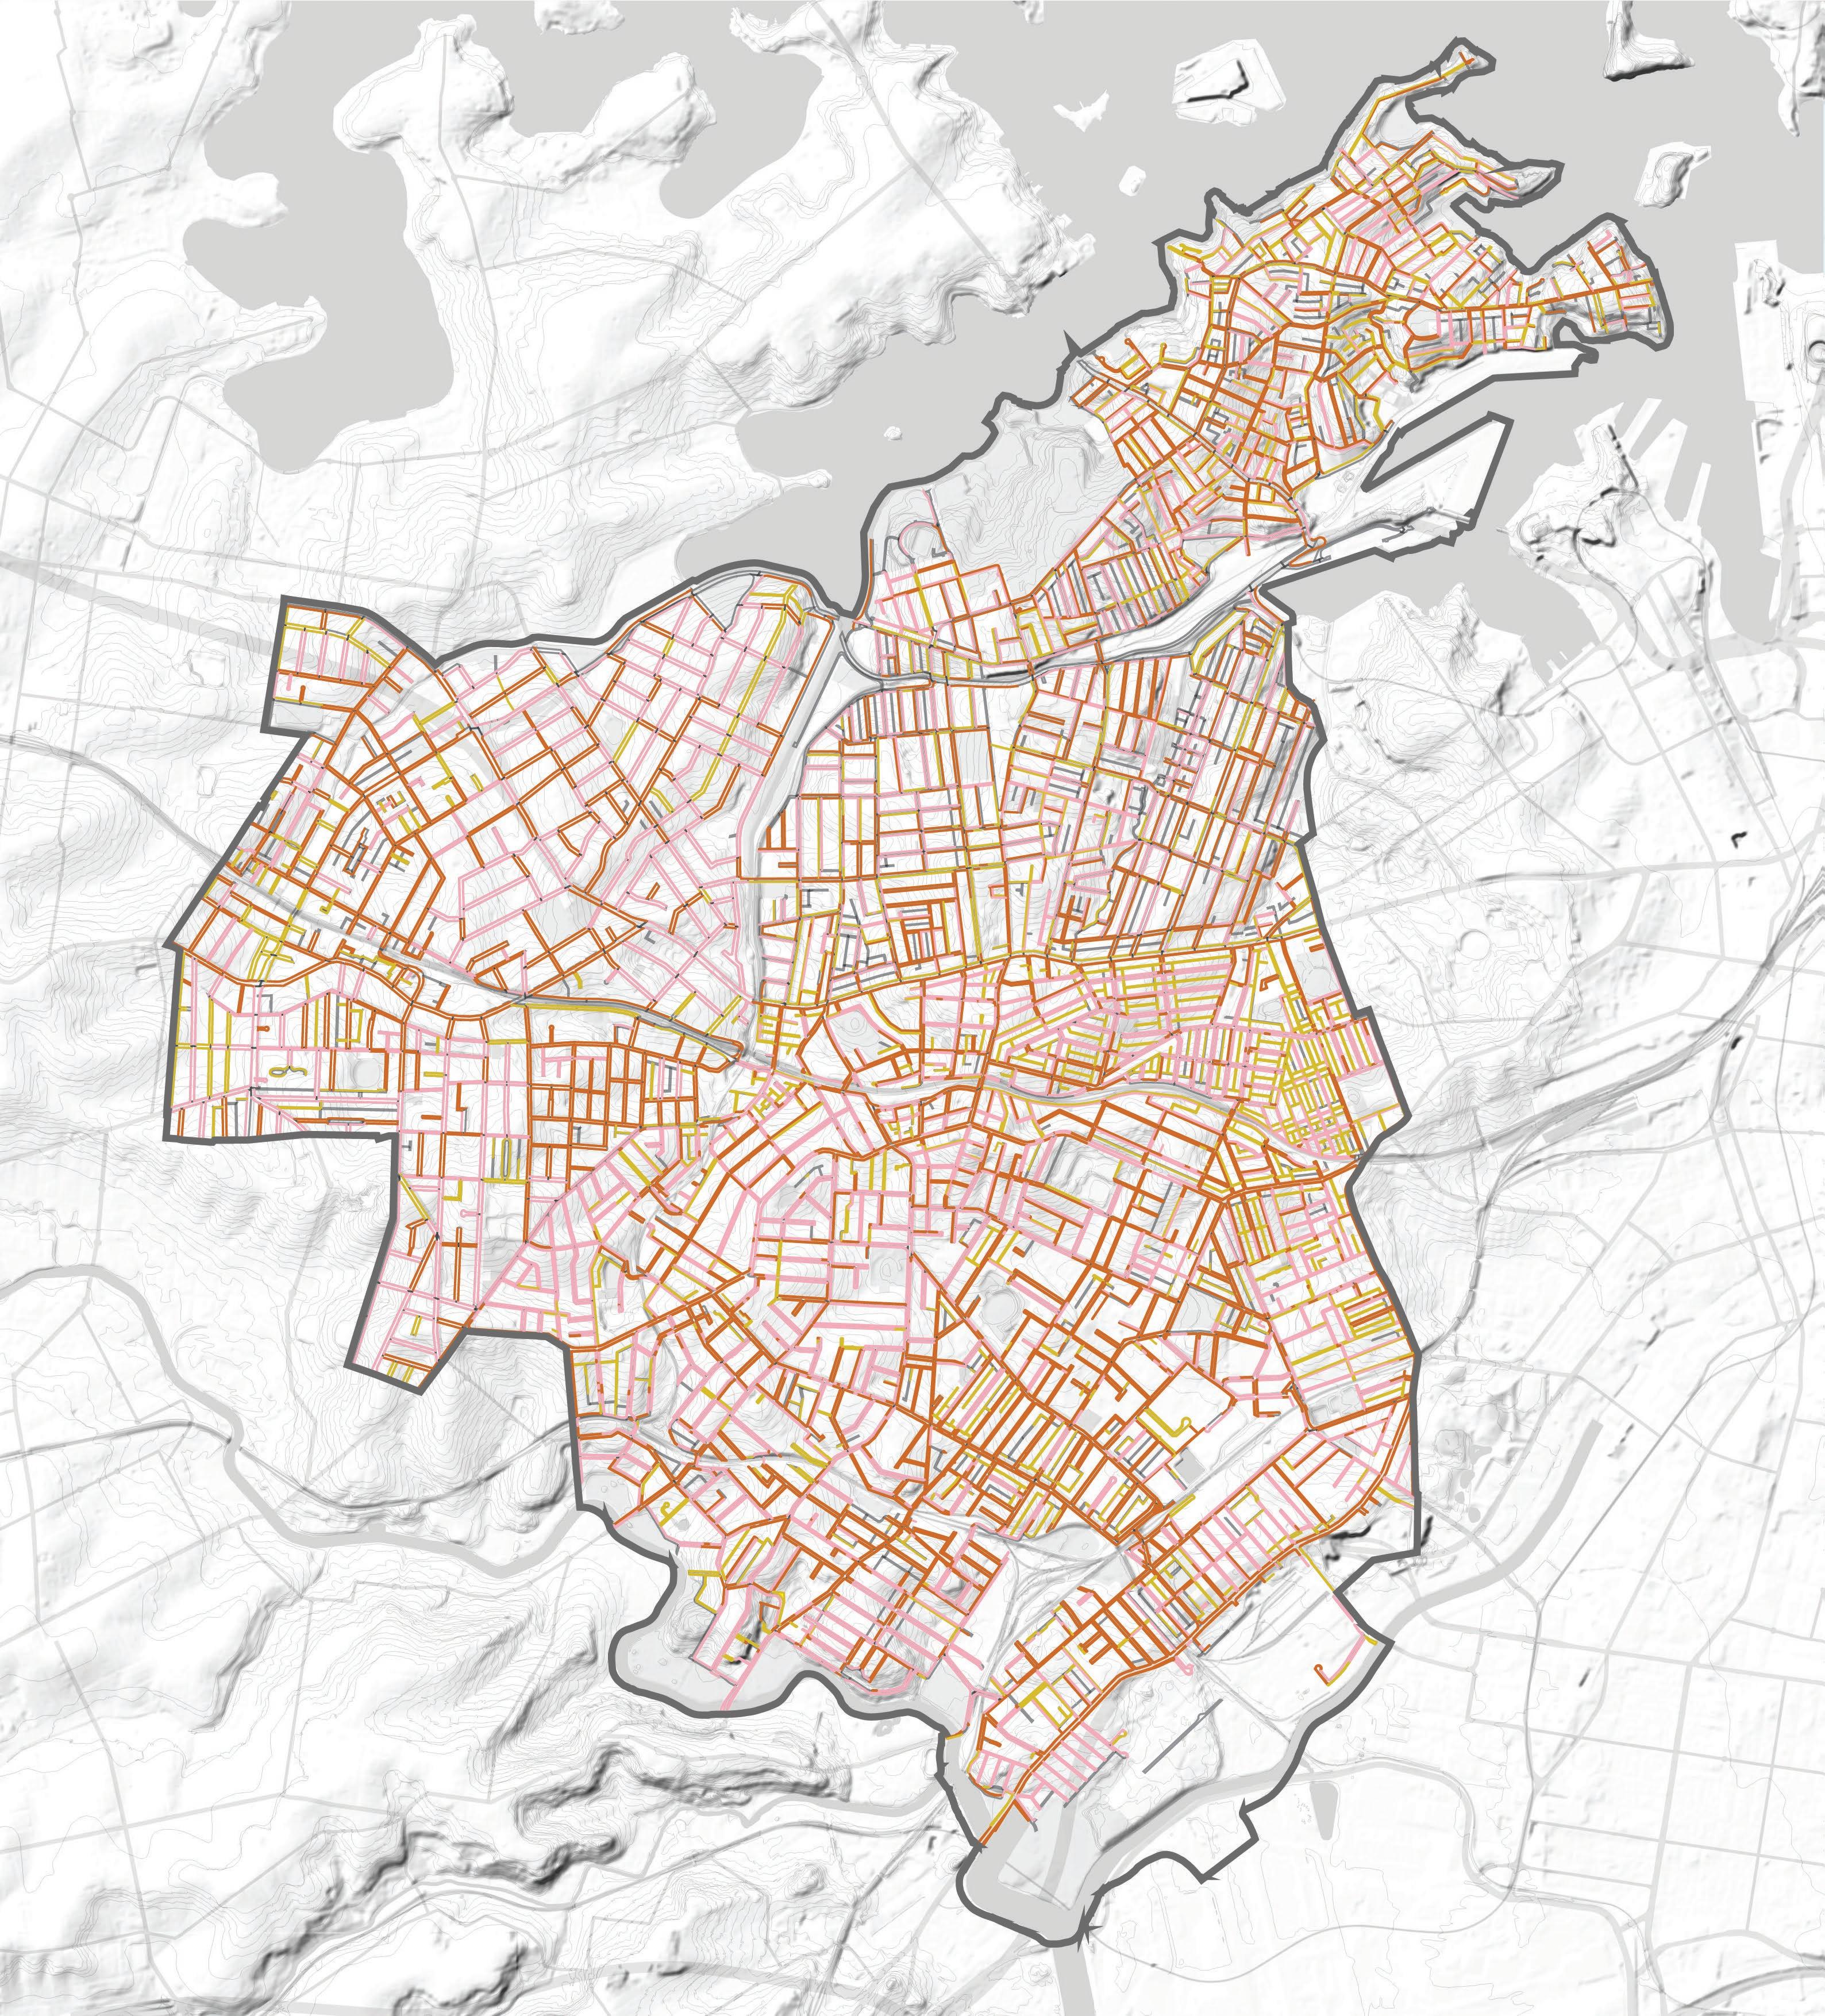
Legend
Inner West LGA Boundary
0-1.5m Footpath
1.5-2m Footpath
2-11m Footpath
Hurlstone Park
Croydon Park
Camperdown
Balmain East
Summer Hill
Dulwich Hill
Marrickville
Petersham
Birchgrove
Annandale
Sydenham
Leichhardt Lewisham
Stanmore Newtown
St Peters
Croydon
Balmain
Enmore
Mascot
Rozelle Tempe
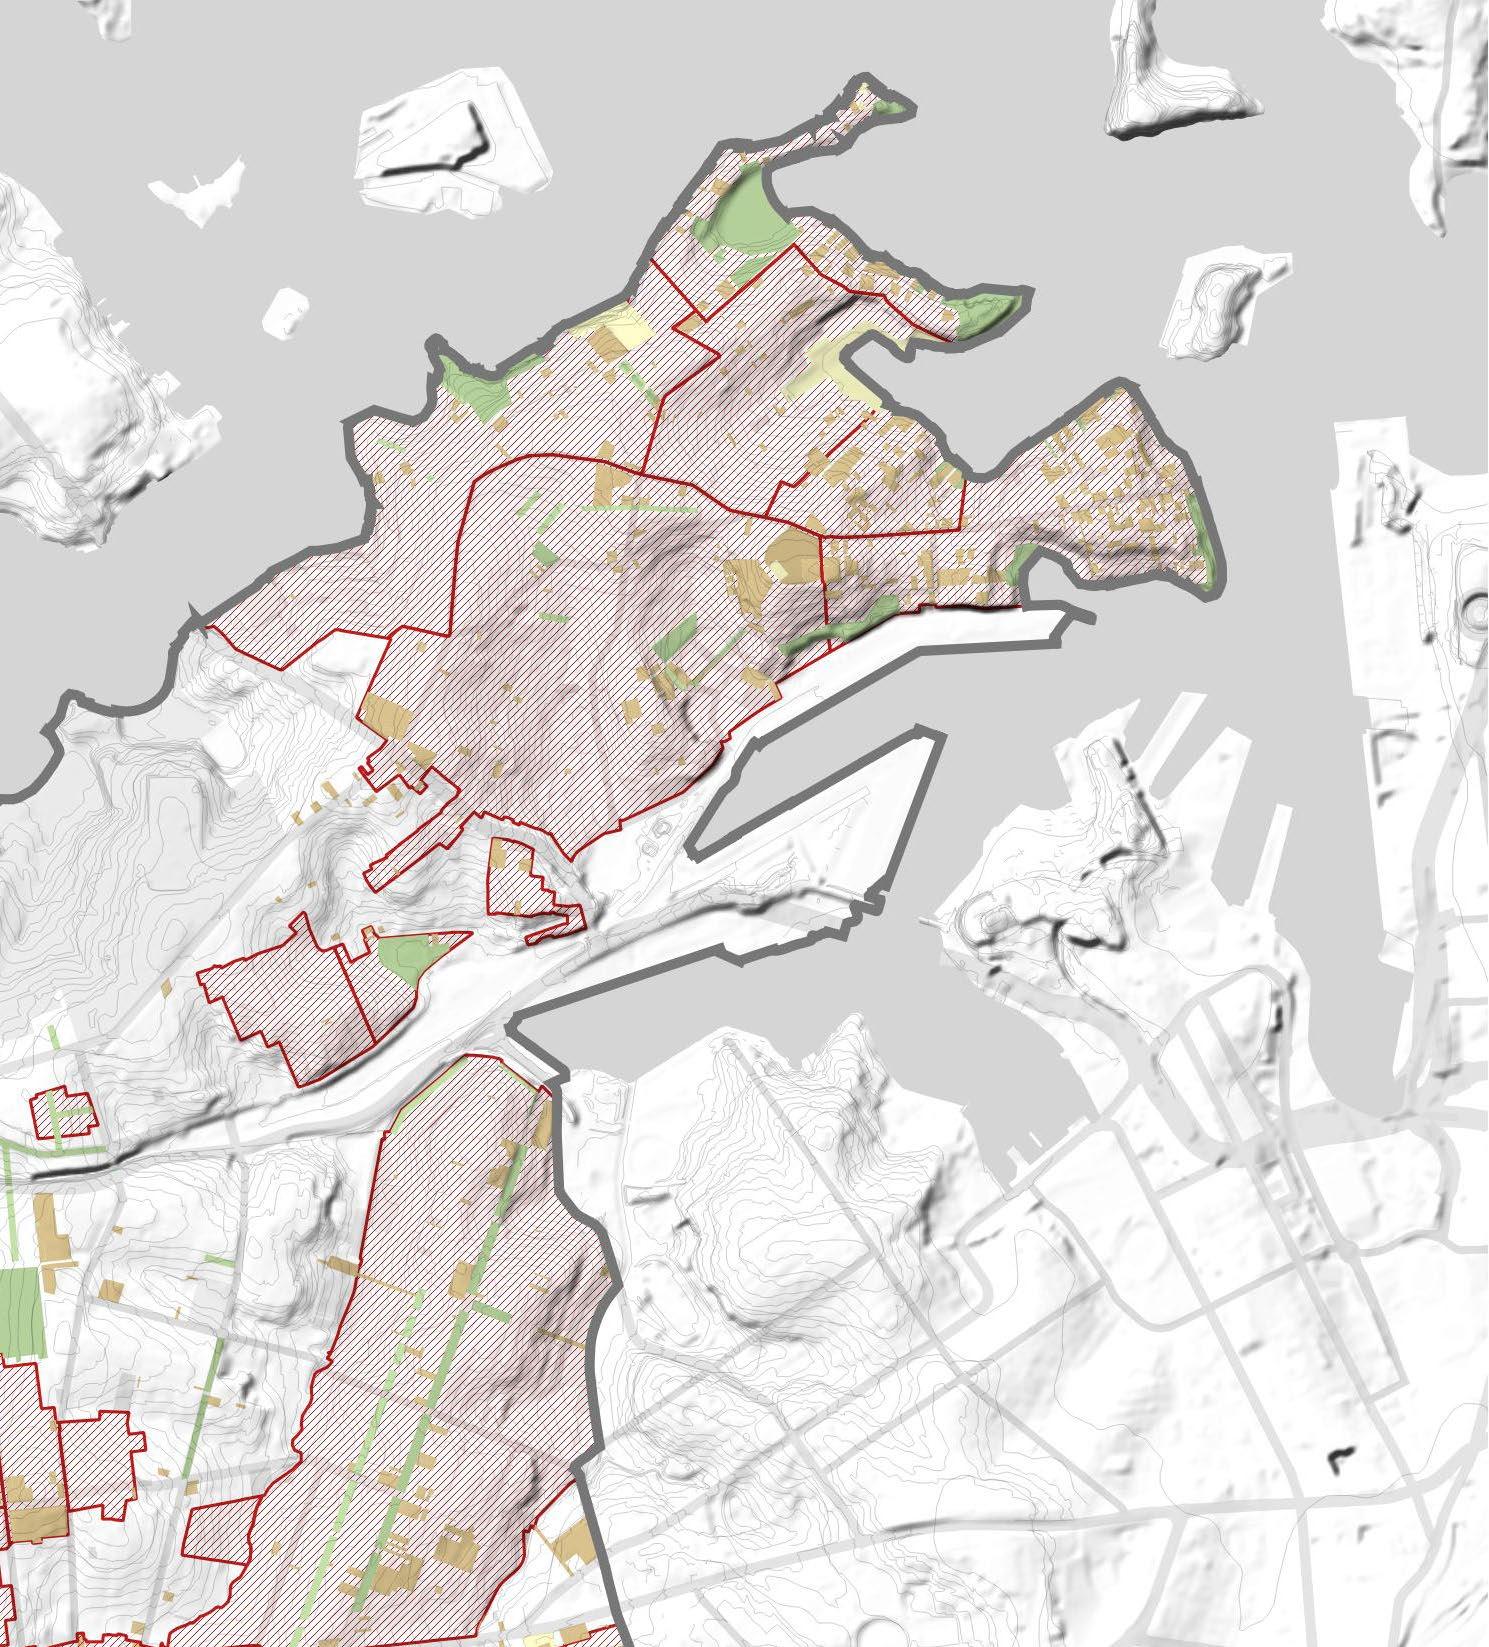
Mapping Layers
Crown Land
Mapping council and crown land shows areas which the strategy can easily be implemented.
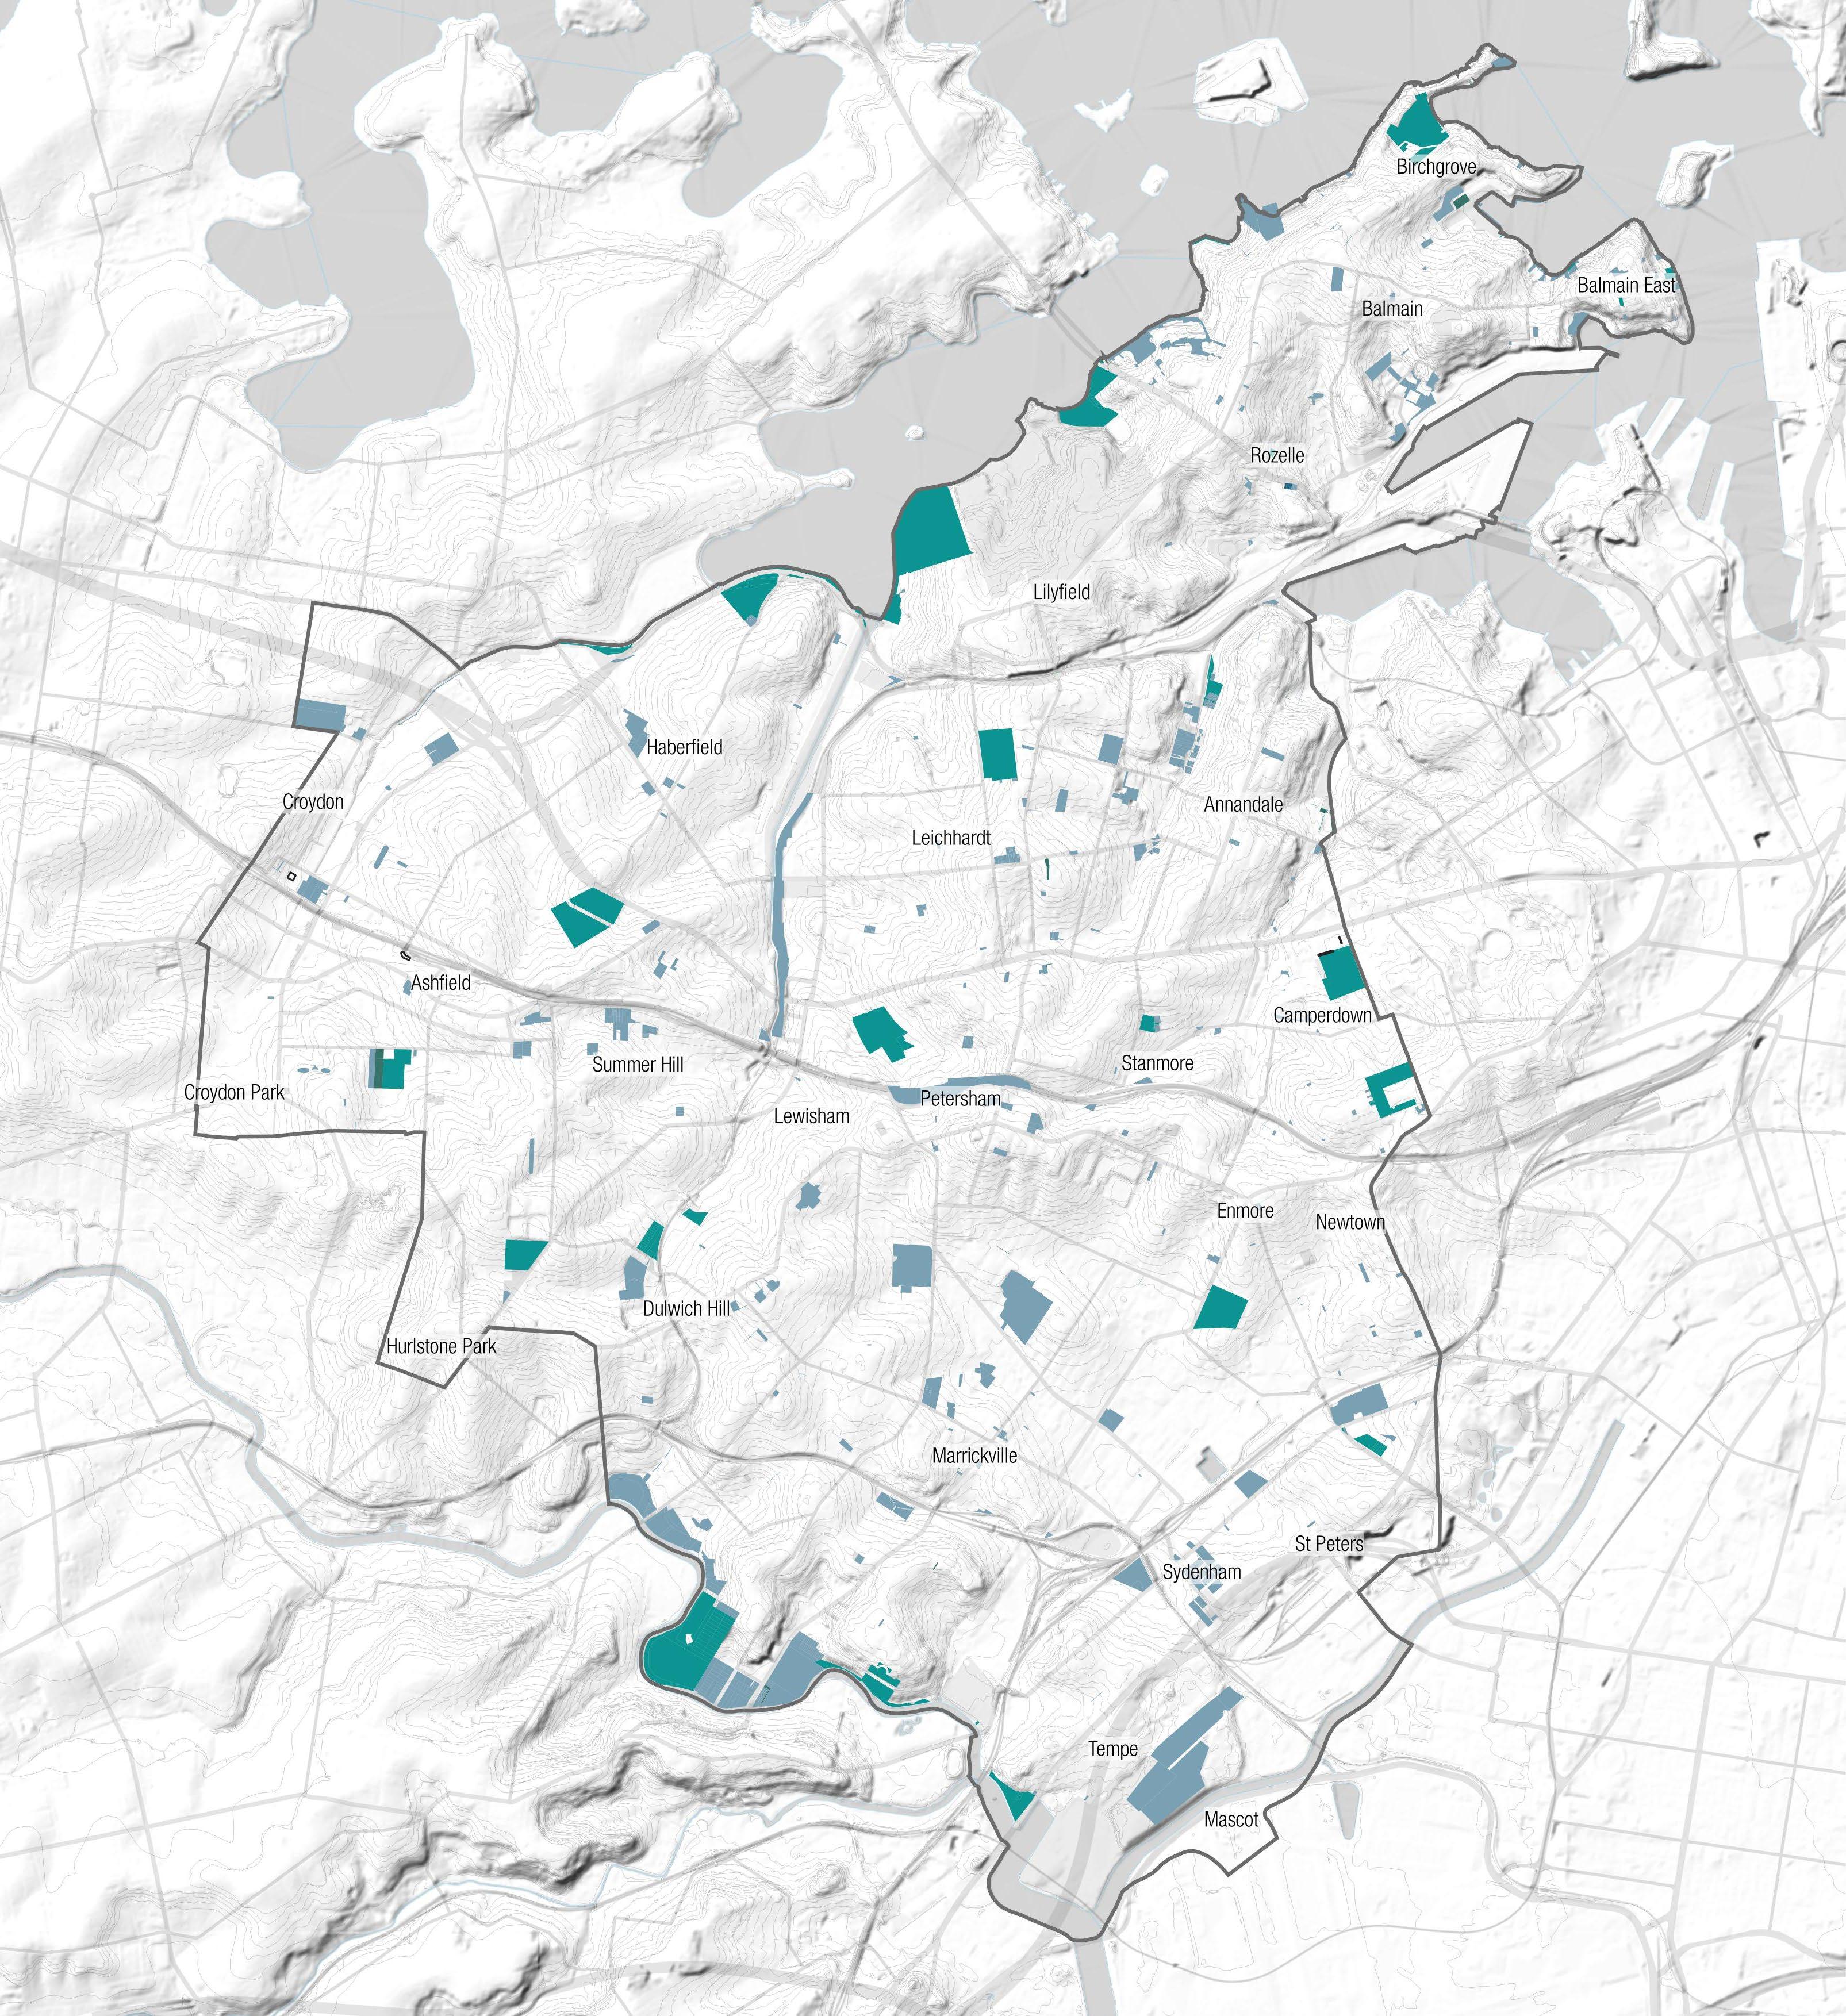
Map source: Shapefile provided by Inner West Council.
Legend
Inner West LGA Boundary
Crown land
Freehold
Local Government Authority
NSW Government Authority
Inner West Blue-Green Grid Strategy 2023 137