Inner West Council
Property Asset Management Plan 2022-2032

i
ii Document Control......................................................................................iii Document History......................................................................................iii Definitions ................................................................................................. iv 1 Executive Summary......................................................................5 1.1 The purpose of the Plan ...............................................................5 1.2 Current State of Council’s Assets .................................................5 1.3 Asset Funding Levels ...................................................................7 1.4 Monitoring and Improvement Program .........................................8 2 Asset Class Information ...............................................................9 2.1 Background..................................................................................9 2.1.1 Buildings Included in this AM Plan ...............................................9 2.1.2 Buildings & Structures Exclusions ..............................................11 2.2 Current State of the Assets ........................................................11 2.2.1 Current Replacement Costs........................................................13 2.2.2 Building Information Management .............................................14 2.2.3 Current Asset Performance........................................................14 2.2.4 Condition Assessment ...............................................................16 2.3 Lifecycle Management ...............................................................17 2.3.1 Operations & Maintenance Plan..................................................17 2.3.2 Renewal/Replacement Plan........................................................18 2.3.3 Upgrade/Expansion Plan ............................................................18 2.3.4 Creation/Acquisition Plan...........................................................20 2.3.5 Disposal Plan .............................................................................20 2.4 Leadership and Accountability....................................................21 3 Levels of Service........................................................................22 3.1 Social Infrastructure Planning ....................................................22 3.2 Customer Research and Expectations ........................................23 3.3 Strategic and Corporate Goals Alignment...................................24 3.4 Key Stakeholders .......................................................................26 3.5 Legislative Requirements ...........................................................27 3.6 Level of Service..........................................................................31 3.6.1 Customer Levels of Service........................................................33 3.6.2 Technical Levels of Service........................................................34 Table of Contents
Document Control
iii 4 Future Demand...........................................................................36 4.1 Demand Drivers..........................................................................36 4.2 Demand Forecasts .....................................................................36 4.3 Changes in Technology ..............................................................37 4.4 New Assets from Growth............................................................38 4.5 Demand Management Plan.........................................................39 5 Risk Management Planning........................................................40 5.1 Asset Criticality / Hierarchy........................................................40 5.2 Risk Management Plan...............................................................41 5.3 Risks Assessment......................................................................42 5.3.1 Risk Plan....................................................................................42 6 Financial Summary.....................................................................44 6.1 Forecasted Funding Requirements .............................................44 6.2 Funding Scenarios......................................................................45 6.3 Forecast 10-Year Capital Renewal Funding.................................46 6.4 Financial Ratios..........................................................................47 7 Plan Improvement and Monitoring..............................................49 7.1 Assumptions ..............................................................................49 7.2 Improvement Plan......................................................................50 7.3 Monitoring and Review Procedures ............................................52 7.4 Performance Measures ..............................................................52
Document History Version Date Status Author Summary of changes 0.2 10/5/2022 Draft T. Blefari Initial draft PAMP 0.3 21/5/2022 Draft R. Nga Updated financials based on new LTFP. 0.4 26/5/2022 Final T. Blefari Updates following internal feedback
Definitions
Explanation of definitions and acronyms used in this plan.
Term/Acronym Definition
AASB Australian Accounting Standards Board
AM Strategy Asset Management Strategy
AMSC Asset Management Steering Committee
Backlog
The quantum of assets that meet the levels of service reflected in the modelling rule base and hence due for a capital treatment, however, funding is not enough to treat these assets.
The current hypothetical cost of recouping this backlog (i.e. funding required to bring every asset in condition state 5, Very Poor, back to a condition state 1, being Very Good) by immediate capital renewal.
CANS Inner West Community Asset Needs Strategy
Condition or Service State
The service state involves the use of a single integer between 1 and 5 to describe the ability for the asset in question to fulfill its function; where 1 is very good and 5 is very poor.
IIMM International Infrastructure Management Manual
ISO55000 55000 Series, International Suite of Asset Management Standards
LTFP Long-Term Financial Plan
PAMP Property Asset Management Plan
Net Strategy Cost
Non-current assets
Total cost lifecycle scenario strategy. Calculation; Total Capital Cost over 20 Years + Total Maintenance & Operational Cost over 10 Years – Backlog Movement Over 20 Years.
Physical and intangible infrastructure assets, including information and communication technology (ICT) assets, controlled by the organisation
SAM Strategic Asset Management
iv
Property Asset Management Plan 2022-2032
1 Executive Summary
1.1 The purpose of the Plan
The purpose of this Property Asset Management Plan (PAMP) is to inform Inner West Council’s (Council) commitment to best practice asset management and provide principles for sound building asset investment decision making.
The PAMP documents the overall integrated planning framework to guide and improve Council’s long-term strategic management of its buildings and major structures (property building assets) in order to cater for the community’s required levels of service into the future as detailed in Section 3.6 Level of Service. The PAMP defines the state of Council’s building assets as at the 2022 Financial Year, the 10year funding required to achieve Council’s adopted asset performance targets and planned asset management activities over a 10-year planning period.
This PAMP is to be read in conjunction with Council’s Asset Management Strategy.
1.2 Current State of Council’s Assets

The value of building assets covered by this PAMP is estimated at $473.5M, as at 30th June 2021 and summarised in the table below:
Table 1 - Assets Valuations as at 30th June 20211
The following dashboard provides a high-level overview of the current condition (service state) of all buildings owned and maintained by Council. The service state is 1 Source: Inner West Council | Annual Report 2020-21 | Notes to
Page 5 of 52
OFFICIAL-Sensitive
Asset Type Quantity (Number) Replacement Cost Accumulated Depreciation Fair Value Annual Depreciation Aquatic Centres 15 $95,529,000 $14,677,000 $80,852,000 $2,088,000 Buildings, Structures & Land Improvements 349 $378,002,000 $106,971,000 $271,031,000 $8,882,000 Grand Total 364 $473,531,000 $121,648,000 $351,883,000 $10,970,000
the Financial Statements 30 June 2021
Property Asset Management Plan 2022-2032
a numerical score assigned to each major building component (asset) to represent its current performance (i.e. where is the asset on its lifecycle path). Utilising predictive modelling software and techniques, Council is able to simulate each assets degradation (the way it moves from one condition state to another throughout its lifecycle) to predict when assets will fail and require future treatment intervention.
Refer to Table 6 – Asset Condition Rating Guidelines for condition definitions.
The following diagram provides a condition snapshot of Council’s buildings assets by asset function.
Page 6 of 52
OFFICIAL-Sensitive
$473.5M Asset Value 1,583 Asset Component Quantities $20.3M Backlog Value 1.7 out of 5 Average Condition (Service State) All Building Asset Component Condition Distribution Component Condition Distribution by Replacement Value
Figure 1 – State of Assets Snapshot as at FY2022
56.1% 25.3% 14.3% 3.9% 0.4% Condition 1 Condition 2 Condition 3 Condition 4 Condition 5 $265.63 $119.82 $67.75 $18.58 $1.75 $0 $50 $100 $150 $200 $250 $300 1 2 3 4 5 Millions Condition
Property Asset Management Plan 2022-2032
1.3 Asset Funding Levels
The Financial Summary in this PAMP recognises that Council has considered multiple strategic predictive modelling scenarios in the process of deriving its 10-year longterm financial budget, in line with the guiding principles of best practice asset management.
Presently, there are plans to spend approximately $25 86M over the following 10 years to upgrade Council’s buildings and these have been documented in Council’s current 10-Year Works Program.
In addition to the upgrading of building facilities funding, the current levels of funding reflected in Council’s Long-Term Financial Plan (LTFP), relative to Council’s existing buildings asset portfolio, have been determined as follows:
• Capital Renewal: $141.12M; and
• Maintenance & Operations: $136.82M or $13 68M on average per annum.
The total capital funding (including renewals and upgrades) is $166.98M. This is the recommended funding option, which is expected to be sufficient to enable the building
Page 7 of 52
OFFICIAL-Sensitive
Figure 2 – Component Condition Distribution by Asset Function & Replacement Cost as at FY2022
0.0% 20.0% 40.0% 60.0% 80.0% 100.0% Administration Amenities Caretaker Residence Childcare Childcare - Commercial… Childcare - Council Operated Childcare - Leased Out Childcare - OSHC Commercial Lease Community Centre Emergency Greenhouse Libraries Operational Other Public Halls Recreational Residential SES Storage Condition 1 Condition 2 Condition 3 Condition 4 Condition 5 Replacement Cost $2.1M $4.8M $15.8M $148.7M $56.7M $1.9M $11.6M $37.6M $0.19M $0.017M $26.8M $1.5M $1.2M $4.6M $9.1M $1.2M $20.9M $1.8M $33.9M $90.2M
Property Asset Management Plan 2022-2032
portfolio to achieve its current useful lives through capital and maintenance activities, thereby achieving the level of service targets.
Further financial option details are detailed in the Financial Summary Section. It is envisaged the financial projections will be improved as further information becomes available on the desired levels of service, asset dataset and current asset performance.
1.4
The improvement action items identified can be found in the Plan Improvement and Monitoring Section.
Page 8 of 52
OFFICIAL-Sensitive
$166.98M Total Capital Cost $20 33M Initial Backlog 1.7 Initial Condition $ 136 82M Total Maintenance & Operational Cost $ 8 68M Backlog at Yr 10 1.2 Condition at Yr 10 $ 303 80M Total Lifecycle Cost -$11 65M Change in Backlog $ 155 33M Net Strategy Cost
Figure 3 – Total Capital Renewal Cost and Service State (Condition) by Year
Table
2 –10-Year Funding & Strategy Results - Recommended Funding Option
Monitoring and Improvement Program
1 1.5 2 2.5 3 3.5 4 4.5 5 $0 $5,000 $10,000 $15,000 $20,000 $25,000 1 2 3 4 5 6 7 8 9 10 Service State Cost Thousands Year Option 1 - Current Funding Allocation Option 2 - Maintain LoS
2 Asset Class Information
2.1 Background
The building asset portfolio of Inner West Council (Council) provides a vital service to the local community. Council is widely known for its diverse, engaged, and creative community. Supporting this identity is a network of public and private community assets (including libraries, social and cultural assets) that support the local community and attract people from the wider Sydney region.
These building assets represent a significant investment by Council and are of vital importance to providing its residents and neighbouring communities with quality services
New and upgrade building needs and project candidates are identified in the ‘Inner West Community Asset Needs Strategy 2021-2036’ This strategy provides an assessment of community asset needs based on a range of indicators (such as stakeholder engagement, capacity & utilisation) to identify priorities for existing and future community building asset needs to 2036.
Council’s buildings have been constructed over time and serve a range of purposes from civic administration, town halls and depot facilities to libraries, childcare and amenities. These buildings may be owned by Council, leased or managed in order to facilitate the delivery of required services to the community.
Changing patterns of use and demand with differing maintenance practices and techniques have resulted in a complex network of buildings in varying conditions. As the responsible authority for the provision and maintenance of this infrastructure asset base, Council recognises the need to ensure the management of this valuable asset portfolio, to ensure that the current and future benefit to the community is delivered at a cost that the community can afford.
2.1.1 Buildings Included in this AM Plan
In all, this PAMP covers 305 buildings and structures and 59 land improvement items as classified by their asset subclass (building function) and set out in Table 3 –Building Quantity by Asset Subclass
Page 9 of 52
Asset Management Plan 2022-2032 OFFICIAL-Sensitive
Property
Property Asset Management Plan 2022-2032
This PAMP covers all buildings and structures (building assets) which are owned or controlled by Council Buildings for which Council is the responsible authority are classified under the Building Code of Australia (BCA) as Class 1 through to Class 10a2 with enclosing walls. Other structures included in this PAMP are classified under the BCA as class 10a non-habitable structures with open walls such as park shelters, and class 10b3 structures such as swimming pools.
Page 10 of 52
OFFICIAL-Sensitive
Asset Subclass (Function) Quantity Administration 20 Amenities 81 Caretaker Residence 5 Childcare 13 Childcare - Commercial Lease 2 Childcare - Council operated 7 Childcare - Leased out 3 Childcare - OSHC 5 Commercial Lease 2 Community Centre 29 Emergency 1 Greenhouse 3 Land Improvements 59 Libraries 5 Operational 26 Other 1 Public Halls 8 Recreational 62 Residential 20 SES 3 Storage 9 Total Buildings 305 Total Land Improvements 59
Table 3 – Building Quantity by Asset Subclass
2 Class 10a – a non-habitable building being a garage, carport, shed or the like.
3 Class 10b – a structure being a fence, mast, antenna, retaining or free-standing wall, swimming pool or the like.
Property Asset Management Plan 2022-2032
The Inner West Council Land and Property Strategy August 2019 states that the property portfolio is grouped into three main categories:
Category Type Description
Corporate Service Delivery Premises occupied by Council for the purpose of Council operations.
e.g. Depots and Administration Services.
Property may be Council-owned or leased4 to Council.
Community Services Open Space & Recreation facilities occupied by Council e.g. Libaries, Community Centres.
Property may be Council-owned or leased to Council.
Tenanted Spaces
Premises occupied by external parties that may deliver community services; and/or provide income to Council.
Property may be Council-owned or leased to Council and subleased to external party.
A detailed list of all buildings and structures for which Council has included in this PAMP are recorded in Council’s Asset Register.
2.1.2 Buildings & Structures Exclusions
The PAMP excludes building assets which are owned and maintained by the Department of Planning and Environment, NSW (DPIE) and other private organisations.
Other class 10a and 10b5 structures such as sports field lighting poles, retaining walls etc. are classified under a separate asset portfolio entitled “Other Structures” and included as part of park infrastructure which are managed via Council’s Parks and Sporting Fields Asset Management Plan.
2.2 Current State of the Assets
The distribution of Council building asset portfolio by quantities is illustrated below in Figure 4
Page 11 of 52
OFFICIAL-Sensitive
Table 4 – Property Categories
4 Maintenance and Renewal responsibilities and funding requirements for each leased property are typically defined within each lease. All new leases contain maintenance schedules which identify maintenance activity items, frequency and responsibility for each item. It is envisaged that Council will progressively incorporate maintenance schedules into existing leases as they fall due for renewal.
5 Class 10b – a structure being a fence, mast, antenna, retaining or free-standing wall, swimming pool or the like, not associated to a building site
Property Asset Management Plan 2022-2032
At present, 40% of the asset portfolio is comprised of habitable buildings, which equates to $279.3M of the total $473.53M replacement cost (which represents 59% of the total portfolio replacement cost)
Page 12 of 52
OFFICIAL-Sensitive
Figure 4 – Distribution of Building Assets by Function
20 81 5 13 2 7 3 5 2 29 1 3 59 5 26 1 8 62 20 3 9 0 10 20 30 40 50 60 70 80 90
Property Asset Management Plan 2022-2032
2.2.1 Current Replacement Costs
The total value of buildings and structures for which Council is responsible for is currently estimated at $473.5M. The break-up of the asset subclass by replacement value is illustrated in Figure 5.
Table 5 identifies the annual asset depreciation of Council’s building assets to be in the order of $10.97M per annum. The average annual depreciation (asset
Page 13 of 52
OFFICIAL-Sensitive
Asset Type Quantity (Number) Replacement Cost Accumulated Depreciation Fair Value Annual Depreciation Aquatic Centres 5 $95,529,000 $14,677,000 $80,852,000 $2,088,000 Buildings, Structures & Land Improvements 349 $378,002,000 $106,971,000 $271,031,000 $8,882,000 Grand Total 354 $473,531,000 $121,648,000 $351,883,000 $10,970,000
Figure 5 – Distribution of Building Asset Estimated Replacement Values by Function
Table 5 - Assets Valuations as at 30th June 20216
6 Source: Inner West Council | Annual Report 2020-21 | Notes to the Financial Statements 30 June 2021 19.1% 7.2% 0.4% 4.4% 0.3% 1.9%1.0%0.3%0.3% 5.7% 0.0%0.0% 7.9% 2.4% 0.4% 12.0% 31.4% 3.4% 1.0%0.4%0.6% 0.0% 5.0% 10.0% 15.0% 20.0% 25.0% 30.0% 35.0%
consumption) is considered a measure of the wearing out or other loss of value of the asset that arises from its use, passing of time or obsolescence due to environmental changes.
It should be acknowledged that depreciation is not an ideal measure and is seldom recommended now in modern practice with the focus more on sustainability-based analysis of asset service level (long term financial plans based on strategic lifecycle modelling & planning).
2.2.2 Building Information Management
All information pertaining to asset type and function, location, constructed year and condition of these building and structure assets are recorded and stored in Council’s Asset Register which is a module of the Finance System. At the time of preparing this PAMP, it is estimated that Council’s Asset Register is 99% complete with regards to the buildings list and around 85% up to date. The Improvement Plan identifies actions to further enhance and improve Council’s Asset Register information, by collecting and maintaining additional asset attribute details such as hierarchy, materials and asset quantities.
2.2.3 Current Asset Performance
The following dashboard provides a high-level overview of the current condition (service state) of all building assets owned and maintained by Council. The condition state is a numerical score assigned to each major building component (asset) to represent its current performance (i.e. where is the asset on its lifecycle path), with condition state 1 representing an excellent condition and condition state 5 representing a very poor condition
Refer to Table 6 – Asset Condition Rating Guidelines for condition definitions.
Page 14 of 52
2022-2032 OFFICIAL-Sensitive
Property Asset Management Plan
Property Asset Management Plan 2022-2032
Building asset condition audits and inspections were carried out by Council contractors in 2018 with asset data updated within the Asset Register. Since these inspections further updates have been made to reflect improvements to the asset condition data as a result of capital works undertaken between 2019 and 2021.
Council’s building assets (inspected at the component level) are estimated to be in good condition as shown in Figure 6, with 81.4% in good or better condition. The average network portfolio condition is 1.7 out of 5
Figure 7 below provides a condition snapshot of Council’s building asset components by asset function. It informs us that the Commercial Lease and Caretakers Residence properties are considered to have 21.2% and 13.3% of their components respectively, rated in condition state 5 (very poor). Emergency properties are in fair to poor condition with some 96% of the components rated in these condition states. Operational, Administration and Storage properties have 40% or more of their components assessed to be in condition state 3 (Fair) or worse.
Page 15 of 52
OFFICIAL-Sensitive $473.5M Asset Value 1,583 Asset Component Quantities $20.3M Backlog Value 1.7 out of 5 Average Condition (Service State) All Building Asset Component Condition Distribution Component Condition Distribution by Replacement Value
Figure 6 – State of Assets Snapshot as at FY2022
56.1% 25.3% 14.3% 3.9% 0.4% Condition 1 Condition 2 Condition 3 Condition 4 Condition 5 $265.63 $119.82 $67.75 $18.58 $1.75 $0 $50 $100 $150 $200 $250 $300 1 2 3 4 5 Millions Condition
Property Asset Management Plan 2022-2032
Childcare - OSHC
Childcare - leased out
Childcare - council operated
Childcare - Commercial Lease
Caretaker
Changing patterns of use and demand with differing maintenance practices and techniques have resulted in a complex network of buildings in varying conditions.
The framework documented in Council’s Asset Management Policy, and the Strategies documented in the Asset Management Strategy and supported by this PAMP will place Council in a good position to address the asset issues currently faced.
2.2.4 Condition Assessment
Council will formally document a detailed building condition assessment manual that will be used to assess the building network condition. The Building Service Framework will provide further information on the methodology for rating and assessing the condition/performance of these assets.
Typically, network wide condition assessments are undertaken on a three to five year cycle (coinciding with the financial revaluations) and used to identify where building asset components are within their defined useful lives at any given point in time. The
Page 16 of 52
OFFICIAL-Sensitive
Figure 7 – Component Condition Distribution by Asset Function as at FY2022
0.0% 10.0% 20.0% 30.0% 40.0% 50.0% 60.0% 70.0% 80.0% 90.0% 100.0% Administration Amenities
Residence Childcare
Commercial Lease Community Centre Emergency Greenhouse Land Improvements Libraries Operational Other Public Halls Recreational Residential SES Storage Condition 1 Condition 2 Condition 3 Condition 4 Condition 5
Property Asset Management Plan 2022-2032
latest condition audit covering all buildings that Council is responsible for was completed in 2018
The condition rating system is summarised in Table 6 – Asset Condition Rating . Condition Condition Score Description
Good
1
2
Very Good: free of defects, only planned and/or routine maintenance. Only Normal Maintenance Required
Good: minor defects, increasing maintenance required plus planned maintenance. Minor Maintenance Required.
Fair
3
Fair: defects requiring regular and/or significant maintenance to reinstate service. Significant Maintenance Required to Return to Acceptable Service Level.
Poor
4
5
Poor: significant defects, higher order cost intervention likely. Significant Renewal/Upgrade Required.
Very Poor: physically unsound and/or beyond rehabilitation, immediate action required. Asset / Component Requires Replacement.
Table 6 – Asset Condition Rating Guidelines
2.3 Lifecycle Management
Life Cycle Management is an essential component of any good asset management plan. This section of the PAMP identifies the processes required to effectively manage, maintain, renew and upgrade Council’s building assets.
2.3.1 Operations & Maintenance Plan
Operations activities can be described as activities that are delivered on a day-to-day basis necessary to meet levels of service delivery requirements. Operational activities can include service delivery items such as security key/lock updates. These activities can also include proactive and reactive inspections, undertaken by in-house technical staff and/or specialist contractors. Operational activities do not improve the condition of assets.
Over time, minor faults can occur within the building portfolio. Council addresses the repairs and maintenance of these faults (e g. leaking tap or damaged window or section of carpet) on the basis of defined intervention levels and response times. The intervention level defines the condition, state or risk level associated with an asset / component, i.e. the point in time at which the asset is considered to be below an acceptable level of service. Maintenance is scheduled as soon as the asset reaches this point.
Page 17 of 52
OFFICIAL-Sensitive
Operations and maintenance activities do not improve the condition of the building, but rather enable the building to deliver its service levels as related to its building function.
For the Levels of Service delivered on a day-to-day nature (i.e. responding to customer requests for maintenance faults and responding to localised asset failures), these intervention levels7 are currently documented in Council’s maintenance management system. At present, Council considers that these current operations and maintenance service levels meet the community’s needs and expectations.
The Improvement Plan identifies that Council will undertake a formal review of these operations and maintenance activities which will be formally documented in a Building Service Framework.
2.3.2 Renewal/Replacement Plan
Activities such as renewal, rehabilitation, reconstruction and replacement will return the degraded service of the asset back to its original condition. Renewal activities such as replacement of a building’s roof cladding or replacing the floor coverings, will return the degraded service capability of the asset back to its original designed capability or modern-day equivalent.
Renewal and replacement strategies are based on the most current asset condition inspections available to Council at the time of developing the forward works programs. The rule bases which reflect the policy decisions that Council will employ to determine when they will select building assets for inclusion in their capital works program will be documented in a Building Service Framework.
The built nature of new, upgrade and renewed buildings assets will always be provided in accordance with Council’s design standards, relevant Australian Standards, industry guidelines / best practices and the Building Code of Australia.
2.3.3 Upgrade/Expansion Plan
Upgrade and expansion works are associated with improving service levels beyond the original designed capability or modern-day equivalent. Additionally, expansion works include activities that extends the capacity of an existing asset, to provide higher levels of service and/or meet changes in asset resilience requirements.
Page 18 of 52
OFFICIAL-Sensitive
Property Asset Management Plan 2022-2032
7 Intervention level incorporates the Building Service Area, activity or defect and response time to attendance or repair.
Property Asset Management Plan 2022-2032
Upgrade/expansion is different to renewal/replacement which only improves the degraded service capability within the boundaries of the original designed capability.
Building upgrades are usually undertaken where the building has been identified as deficient with regards to providing its intended function such as being fit for use and fit for purpose. Council assesses the building’s capability of catering for the current and near future user numbers and also assesses the Buildings ability to be adapted or reconfigured to provide for changing user needs and service requirements (such as a building originally used as a senior citizens building to now providing maternal child and health services).
Typically upgrade/expansion works are identified from a combination of methods which include Councillor and/or community requests, project candidates identified via Council’s Community Asset Needs Strategy or identified via other Strategic Plans and/or from building condition audits.
Council utilises the following methodology framework to prioritise and schedule identified project candidates for the 10-Year Works Program.
Table 7 – Building Priority Ranking Criteria
Page 19 of 52
OFFICIAL-Sensitive
Criteria Weighting Works proposed are referenced in or support the Council Plan. 20% Works proposed have been listed, endorsed or identified from Council’s Community Asset Needs Strategy or others such as Strategic Plans and Master Plans 20% Works proposed will enhance the quality of service to community. 20% Works proposed are required due to risk, legislative and/or to mitigate contractual risks. 20% External funding provided or available and total lifecycle costs are considered to not adversely impact future budgets. 20% Total 100%
Property Asset Management Plan 2022-2032
Presently, there are plans to spend approximately $19.23M8 over the following 10 years to upgrade Council’s buildings and these have been documented in Council’s current 10-Year Works Program.
2.3.4 Creation/Acquisition Plan
New works are those works that create a new asset that did not previously exist. Council can acquire existing built assets or new assets from developers or new assets via capital projects to meet community needs Typically, new building asset candidates are identified from a combination of methods which include Councillor and/or community requests, project candidates identified via Council’s Community Asset Needs Strategy (CANS) or identified via other Strategic Plans and/or from building condition audits.
2.3.5 Disposal Plan
Disposal includes any activity associated with disposal of a decommissioned asset including sale, demolition, relocation or transfer of ownership.
Council is currently in the process of developing a Long-Term housing strategy which aims to review if there are opportunities to rationalise some of its current depots and administration centres.
The following properties that have been or will be considered for disposal are:
• Residential building in Hercules Street planned to be demolished and the land returned into green open space.
• Tempe site has recently been acquired by the State Government and Council is looking to reinvest the funds from this compulsory acquisition to purchase commercial buildings or a combination of facility types which will generate revenue.
8 The upgrade funding plan will be reviewed in conjunction with the next PAMP update in 2026. As new information becomes available on growth demand needs and asset lifecycle, these will be reflected in the 10-Year Funding Strategy.
Page 20 of 52
OFFICIAL-Sensitive
Property Asset Management Plan 2022-2032
2.4 Leadership and Accountability
Council’s Asset Management Policy adopted in 2022 defines the roles and responsibilities within Council for asset management.
In addition, an Asset Management Steering Committee (AMSC) has been drawn from across Council administration to coordinate asset management related matters. Meetings are held regularly and chaired by the Engineering Services Manager. The development of an Asset Management Responsibility Assignment Matrix which details the organisational relationships and lines of responsibility regarding asset management over the asset lifecycle, has been included in the Improvement Plan
Page 21 of 52
OFFICIAL-Sensitive
3 Levels of Service
3.1 Social Infrastructure Planning
Council provides over 100 services and our building assets support the provision of services such as libraries, recreational facilities like aquatic centres, community centres and children & family services. A service centric approach starts with determining what services we need and then connecting assets to those services. It ensures that our assets are in the most appropriate locations for future community use, that they are functionally adequate for future demographics and take into account demand and Council’s vision. It also ensures that there is a clear prioritisation of capital and maintenance based on criticality of the service and considers repurposing, redundancy or relocation of services when balancing future budgets.
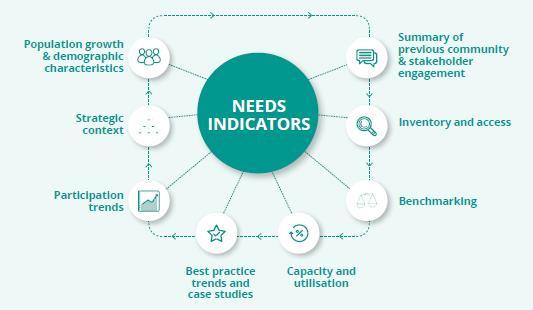
In 2021, Council completed the Inner West Community Asset Needs Strategy (CANS) 2021-2036 The strategy provides an assessment of community asset needs based on a range of indicators (refer to Figure 8) to identify priorities for existing and future community asset needs to 2036.
The CANS is also one of the key documents that will inform the new IWC contributions plan that will enable IWC to levy appropriate developer contributions for community asset investment (land and infrastructure) to meet the needs of the Inner West LGA over a 15-year time frame. This includes the needs of residents, businesses/workers
Page 22 of 52
Asset Management Plan 2022-2032 OFFICIAL-Sensitive
Property
Figure 8 – CANS Needs Indicator Diagram
Property Asset Management Plan 2022-2032
(who may also be residents of the Inner West LGA) while also having some consideration for visitors.
In addition, Council also has a Land and Property Strategy (LPS) developed in 2019 to ensure the community’s assets are being properly managed and protected for the long-term best interests of the community.
The CAN, the LPS and this PAMP are complementary documents that together set out Council’s service targets, and how these targets will be achieved. The role of each of these elements in the long-term asset planning is as follows:
• Asset Provision (CANS) - Determining the size, footprint and numbers of buildings needed to service current and future demand;
• Asset Performance (LPS) – provides a framework to ensure equity, consistency, accountability and transparency in Council’s property asset decision-making; and
• Asset Performance (PAMP) - The required capital and maintenance performance standards for the assets Council provides that will ensure services are delivered at the desired levels.
3.2 Customer Research and Expectations
Council undertakes customer surveys to understand and identify community priorities for the Inner West LGA and identify the community’s overall level of satisfaction. The most recent customer satisfaction survey9, which was conducted in 2021 offers Council a long-term measure of how they are performing.
The results of the survey indicated that generally, the provision of swimming pools and aquatic centres, community centres and facilities, childcare services, libraries and protection of heritage buildings is of importance to the community. The community is generally satisfied with the provision of these services.
Page 23 of 52
OFFICIAL-Sensitive
9 2021 Community Satisfaction Survey – Conducted by Micromex Research July 2021
Figure 9 illustrates the satisfaction with Council’s overall performance between 2017 to 2021.
A score of 1 represents not at all satisfied, while a score of 5 represents very satisfied The survey results identify that since 2017, community satisfaction has been improving and as at 2021, the community is on average satisfied with the current levels of service delivered by Council in these service areas.
Residents want to be better informed and consulted on key local issues with the ability to influence Council’s decision making Good communication and transparency with residents about decisions Council has made in the community’s interest is of importance, however the community is on average not very satisfied. Improvement in this area provides the greatest opportunity to drive up the overall opinion of Council’s performance.
3.3 Strategic and Corporate Goals Alignment
This PAMP is prepared and aligned with Council’s vision, mission, goals and objectives and has been aligned to deliver cost-effective, transparent, realistic and affordable service levels in accordance with community expectations.
Relevant Council goals and objectives and how these are addressed in this PAMP are detailed in Table 8.
Page 24 of 52
Management Plan 2022-2032 OFFICIAL-Sensitive
Property Asset
Figure 9 – Inner West Community Survey Satisfaction Overall Performance
3.82 3.81 4.01 3.59 3.7 3.72 3.43 3.57 3.57 3.97 3.99 4.25 3.23 3.44 3.55 0 0.5 1 1.5 2 2.5 3 3.5 4 4.5 2017 2018 2021 Pools and Aquatic Centres Community Centres & Facilities Childcare services Library Services Protection of Heritage Buildings
Property Asset Management Plan 2022-2032
Strategic Direction (SD) Outcome
SD1.3 – The community is water sensitive, with clean, swimmable waterways
Deliver water-sensitive plans, decisions and infrastructure
How Goal and Objectives are addressed in PAMP
Where possible, Council facilities when renewed will be designed to utilise grey & harvested water to minimise reliance on potable water
Levels of service allow Council to better define its service requirements and ensure they are met by new developments.
SD1.4 - Inner West is a zero emissions community that generates and owns clean energy.
SD4.1 – Everyone feels welcome and connected to the community.
Council facilities utilise clean renewable energy.
Where possible, Council facilities when renewed will be designed to utilise solar power to reduce our carbon footprint
SD4.3 – The community is healthy and people have a sense of wellbeing.
Foster inclusive communities where everyone can participate in community life.
Provision of community facilities that are fit for use and purpose, accessible, safe and well maintained. Supports the provision of facilities that foster and facilitate positive health and wellbeing outcomes.
Provide the facilities, spaces and programs that support wellbeing and active and healthy communities
Provide opportunities for people to participate in recreational activities they enjoy.
Provision of swimming pools and aquatic centres that are fit for use and purpose, accessible, safe and well maintained. Provision of 10-year capital improvement programs to reduce asset renewal gap and to ensure that assets are fir for the purpose they were intended for.
SD4.4 – People have access to the services and facilities they need at all stages of life.
Plan and provide services and infrastructure for a changing and ageing population.
Ensure the community has access to a wide range of learning spaces, resources, and activities
Support children’s education and care services to ensure a
Ensure facilities are designed and built to accommodate growth, diverse needs and future flexibility.
Provision of library facilities that are fit for use and purpose, accessible, safe and well maintained.
Provision of children and learning facilities that are fit for use and purpose, accessible, safe and well maintained.
Page 25 of 52
OFFICIAL-Sensitive
Property Asset Management Plan 2022-2032
Strategic Direction (SD) Outcome
strong foundation for lifelong learning
How Goal and Objectives are addressed in PAMP
Provision of 10-year capital improvement programs to reduce asset renewal gap and to ensure that assets are fir for the purpose they were intended for.
3.4 Key Stakeholders
Assets controlled by Council are utilised by a broad cross-section of the community. It is critical that assets are maintained and renewed based on need and fit for purpose. Asset users are key stakeholders of this PAMP
Table 9 identifies stakeholders where consultation is necessary when Council seeks input in relation to the determination of Levels of Service and intervention levels.
Stakeholder Group Role or Involvement
Internal Stakeholders
Elected Council
Executive Team
Custodian of the asset, with Councillors representing the residents and setting strategic direction as per the Corporate & Operational Plans.
To ensure that the Asset Management policy and strategy are being implemented as adopted, and to ensure that long-term financial needs to sustain the assets for the services they deliver are advised to Council for its strategic & financial planning processes.
Managers of the various Building & Property assets
As the designated Strategic Custodian of property assets, responsible for the overall management of the assets from planning, design, maintenance, capital works and monitoring and updating the plan and ensuring its outcomes are realised to achieve the levels of service being required from utilisation of the assets;
Engineering Department
Maintaining Council’s asset registers and performing strategic predictive modelling analysis works to inform Council’s Long Term Financial Plans and Capital Works Program. Responsible for coordinating the development and implementation of asset management processes and frameworks within the Council.
Finance Department
Ensuring that the asset valuations are accurate. Development of supporting policies such as capitalisation and depreciation. Preparation of asset sustainability and financial reports incorporating asset depreciation in compliance with current Australian accounting standards, AM, GIS support and admin.
Maintenance Department (Internal)
To ensure provision of the required/agreed level of maintenance services for asset components.
Page 26 of 52
OFFICIAL-Sensitive
Table 8 - Council’s Goals and how these are addressed in this Plan
Property Asset Management Plan 2022-2032
Stakeholder Group Role or Involvement
Information Technology Managers
Risk Managers
Internal Auditors
External Stakeholders
Community
Community User Groups
Service Providers
Maintenance Personnel (contractors)
To ensure that the relevant IT systems are functioning and that any data within the systems are secure, and its integrity is not compromised.
To ensure that risk management practices are conducted as per Council policy and assist operations managers with advice on risk issues.
To ensure that appropriate policy practices are carried out and to advise and assist in improvements
General users of the various facilities.
Users of facilities that have been dedicated to the provision of a specific service (e.g. Clubs, Child Care, Senior Citizens).
Those external bodies or agencies that provide services to the community utilising council owned buildings & facilities.
To ensure provision of the required/agreed level of maintenance services for asset components.
Utility Service Providers Agencies that provide utility services such as electricity, gas, water, sewerage and telecommunications necessary to facilitate services from a building.
State & Federal Government Depts
Council’s Insurer
Periodic provision of advice, instruction and support funding to assist with management of the drainage network.
Insurance and risk management issues.
Table 9 – Key Stakeholders
3.5 Legislative Requirements
There are many legislative requirements relating to the management of Council assets. Legislative requirements that impact the delivery of Council building services include:
Legislation
Local Government Act
1993
Requirement
Sets out the role, purpose, responsibilities and powers of local governments. The purposes of this Act are as follows:
(a) to provide the legal framework for an effective, efficient, environmentally responsible and open system of local government in New South Wales,
(b) to regulate the relationships between the people and bodies comprising the system of local government in New South Wales,
(c) to encourage and assist the effective participation of local communities in the affairs of local government,
(d) to give councils:
Page 27 of 52
OFFICIAL-Sensitive
Property Asset Management Plan 2022-2032
Legislation Requirement
• the ability to provide goods, services and facilities, and to carry out activities, appropriate to the current and future needs of local communities and of the wider public
• the responsibility for administering some regulatory systems under this Act
• a role in the management, improvement and development of the resources of their areas,
(e) to require councils, councillors and council employees to have regard to the principles of ecologically sustainable development in carrying out their responsibilities.
The land management provisions of the Act require that Council prepare plans of management for all community land. The plan of management identifies the management objectives for the land category, performance indicators and performance measures to meet the objectives identified.
Local Government Amendment (Planning and Reporting) Act 2009
Local Government Act –Annual Reporting Section 428(2)(d)
Local Government Amendment (Planning and Reporting) Act 2009 includes the preparation of a long term financial plan supported by asset management plans for sustainable service delivery.
A report of the condition of the public works (including public buildings, public roads and water sewerage and drainage works) under the control of Council as at the end of that year; together with
• An estimate (at current values) of the amount of money required to bring the works up to a satisfactory standard; and
• An estimate (at current values) of the annual expense of maintaining the works at that standard; and
• The Council’s programme for maintenance for that year in respect of the works.
Disability Discriminations Act, 1992
Building Act 1993 & Building Regulations 2018
The Disability Act establishes a framework for providing support and services to people with disabilities throughout New South Wales.
The Act sets out the legal framework for the regulation of construction of buildings, building standards and maintenance of specific building safety.
The Regulations are derived from the Act and contain, amongst other things, the requirements relating to building permits, building inspections, records of maintenance inspections and service & repair works for essential safety, occupancy permits, and enforcement of the Regulations and maintenance of buildings.
The Regulations call up the BCA as a technical reference that must be complied with.
Building Code of Australia (BCA)
A uniform set of technical provisions for the design and construction of buildings and other structures. It is fully performance based and allows for state variations to provide additional requirements or cater for specific community expectations. A performance based approach defines the way of achieving a specified outcome without
Page 28 of 52
OFFICIAL-Sensitive
Property Asset Management Plan 2022-2032
Legislation Requirement
prescribing a particular method. This code has direct relevance for building maintenance, renewals and upgrades.
Work Health & Safety Act 2011
Sets out roles and responsibilities to secure the health, safety and welfare of persons at work and covering injury management, emphasising rehabilitation of workers particularly for return to work. Council is to provide a safe working environment and supply equipment to ensure safety.
Environmental Planning and Assessment Act 1979
An Act to institute a system of environmental planning and assessment for the State of New South Wales. Among other requirements the Act outlines the requirement for the preparation of Local Environmental Plans (LEP), Development Control Plans (DCP), Environmental Impact Assessments (EIA) and Environmental Impact Statements.
Environmental Protection Act 1994
Public Works and Procurement Act 1912
Heritage Act 1977
Inner West Development Control Plans
Inner West Local Environmental Plan 2020
Residential Tenancies Act 2010
This act sets out requirements with respect to environmental protection.
Sets out the role of Council in the planning and construction of new assets.
Provides for the protection and conservation of places and objects of cultural heritage significance and the registration of such places and objects.
The primary purpose of a Development Control Plan (DCP) is to guide development according to the aims of the corresponding Local Environmental Plan (LEP).
The LEP is a legal document that provides controls and guidelines for development in an area. It determines what can be built, where it can be built, and what activities can occur on land.
This legislation defines the roles, responsibilities and obligations of landlords and tenants with respect to lease and hire of buildings.
Table 10: Legislation Relevant to Management of Building Assets
Regulations, Standards & Guideline requirements that impact the delivery of Council’s building services are outlined below.
Regulation / Standard / Guide
Integrated Planning and Reporting (IP&R) framework
Requirement
All councils in NSW are required to work within the IP&R framework to guide their planning and reporting activities.
IP&R provides a pathway for elected representatives to:
• work directly with their community to identify long-term priorities for local identity, growth and lifestyle;
Page 29 of 52
OFFICIAL-Sensitive
Regulation / Standard / Guide
Property Asset Management Plan 2022-2032
Requirement
• understand the range of services the community wants, the service standards they expect and the infrastructure that will be required;
• report to the community on their success in achieving these goals; and
• be assured that their council is meeting planning, consulting and reporting requirements under other laws.
Environmental Planning and Assessment
Regulation 2000
Fire safety systems are required in commercial, industrial & public buildings to ensure the safety of occupants in the event of a fire or emergency.
The Act includes provisions relating to fire safety and matters concerning the Building Code of Australia (Part 9)
ISO 55000 Suite, 2014 The International Organization for Standardization's ISO 55000:2014 Asset Management (ISO 55000) provides a global guide to better practice in asset management, including asset information management.
ISO 55000 specifies that entities should align information requirements to asset management needs and risks, along with requirements for collecting, managing, evaluating, and ensuring consistency and availability of information for asset management decision-making.
Australian Accounting Standards Board (AASB)
Provides direction and guidance on the financial and reporting expectations of entities, to ensure a consistent approach to accounting records. The following regulations apply to Council:
AASB 116 Property, Plant & Equipment – prescribes requirements for recognition and depreciation of property, plant and equipment assets.
AASB 136 Impairment of Assets – aims to ensure that assets are carried at amounts that are not more than their recoverable amounts.
AASB 1021 Depreciation of Non-Current Assets – specifies how depreciation is to be calculated.
AAS 1001 Accounting Policies – specifies the policies that an organisation is to have for recognition of assets and depreciation.
AASB 1041 Accounting for the reduction of Non-Current Assets – specifies the frequency and basis of calculating depreciation and revaluation basis used for assets; and
AAS 1015 Accounting for the acquisition of assets – method of allocating the value to new assets on acquisition.
All other relevant Australian Standards
All Local Laws and relevant policies of the Organisation
AS/NZ Standards such as Risk Management Standard.
Construction standards, Maintenance contracts, etc.
Page 30 of 52
OFFICIAL-Sensitive
Regulation / Standard / Guide
International Infrastructure Management Manual, Sixth Edition, IPWEA, V6.0, 2020
Property Asset Management Plan 2022-2032
Requirement
The IIMM has been developed with public and private sector industry input from Australia, New Zealand, the United States Canada, South Africa and the United Kingdom to promote best asset management practice for all infrastructure assets.
The following is a summary of policies relevant to this asset class. Many of these policies are available from Council.
Policy Requirement
Infrastructure, Plant, Property and Equipment
Determination
Protocol 2019
Asset Management Policy 2022
To define Inner West Council’s asset classes and associated methodologies in capturing and recording asset related information, guided by relevant accounting and industry standards as well as legislation.
The Policy acknowledges Council’s commitment to asset management and provides a consistent asset management approach with clear principles and guidelines in order to manage Council’s assets for the current and future community. It establishes a framework to ensure a structured, coordinated, cost effective and financially sustainable approach to asset management across the organisation.
3.6 Level of Service
It is considered that this PAMP has improved the level of sophistication in the documentation of the levels of service that will be delivered by Council’s building assets. The levels of service delivered by Council’s buildings have been documented considering the expectations of Council’s residents/customers. This has required a clear understanding of customer needs, expectations and preferences that will be explored in this Section and continually reviewed and updated as required in future PAMP iterations.
The levels of service defined are intended:
• to inform customers and Council of the proposed type and level of service to be offered;
Page 31 of 52
OFFICIAL-Sensitive
Table 11: Regulations & Standards Relevant to Management of Building Assets
Table 12: Policies Relevant to Management of Building Assets
• to enable customers and Council to assess suitability, affordability and equity of the services offered;
• to measure the effectiveness of the services provided by Council; and
• to identify the costs and benefits of the services offered.
Council has defined two tiers of levels of service, which are based on:
Community Levels of Service – what Council expects to provide in terms of key customer outcomes based on perceptions of expected quality and future financial allocations:
• Appropriateness of service;
• Accessibility to users 24 hours a day, 7 days a week;
• Affordability – acknowledging that Council can only deliver what it can afford; and
• Relevance of the service being provided – in terms of demand characteristics, future demographics, current backlogs and where the pressure points are.
Technical Levels of Service – which relates to the outputs the customer receives:
• What Council will do in real terms, i.e. reliability, functionality and adequacy of the services provided. Typically, this PAMP has documented Council’s standards – i.e. at what point will Council repair, renew or upgrade to meet the customer outcomes listed in the strategic levels; and
• Technical Levels of Service have been defined for each of the following:
o New Asset – If Council provides new Building assets, then what design and maintainability standards shall apply to make them meet Council’s strategic outcomes;
o Upgraded or Reconstructed Asset to original standard - If Council upgrades or reconstructs Buildings, what design and maintainability standards shall apply to make them meet Council’s strategic outcomes; and
o Maintenance – When will Council intervene with a maintenance repair and what will be Council’s responsiveness in terms of customer requests for maintenance faults.
The levels of service that have been adopted are considered reasonable as demonstrated by industry standards and benchmarks.
Page 32 of 52
Management Plan 2022-2032 OFFICIAL-Sensitive
Property Asset
Property Asset Management Plan 2022-2032
3.6.1 Customer Levels of Service
Council’s Customer Levels of Service that have been adopted for this PAMP are detailed as follows:
COMMUNITY LEVELS OF SERVICE
Regular Compliance Audits including:
Safety
Legislative Compliance Ensure all Council buildings comply with all relevant regulatory requirements
Safety Buildings are routinely inspected for hazards and risk
AFSS (Annual Fire Safety Statements)
Backflow testing
TMV’s testing
Emergency Lighting and Exit Signs audits
No. of reportable incidents due to building defects per year <= 2
Data to be collected.
Safety Legislative ComplianceAsbestos
An up-to-date Asbestos Register is available for each building in accordance with the applicable Occupational Health and Safety Regulations.
Data to be collected.
Data to be collected.
Quality
Well maintained and suitable Buildings
Quality Heritage Preservation
<4.000 requests per annum in relation to maintenance requests.
<200 requests per annum in relation to renewal and maintenance requests.
Each Council building listed on the NSW Heritage Register is preserved and maintained per its Conservation Management Plan.
Data to be collected.
Availability and Accessibility
Building assets will be available and accessible
10 Data from July 2020 to June 2021
95% Compliance. In the instance where a building is closed to users for reasons such as maintenance,
Baseline audit yet to be undertaken.
Data to be collected.
Page 33 of 52
OFFICIAL-Sensitive
Measure Level of
Performance Measure 2021 Performance
Key Performance
Service
3,78710
Property Asset Management Plan 2022-2032
during normal operating business hours
upgrading, renewal or a Council related public event or non-Council events, then appropriate notification shall be given to relevant users in accordance with Council’s public information policy.
Customer Satisfaction Building assets meet community needs >=3.5 community survey satisfaction score
Pools and Aquatic Centres – 4.01
Community Centres & Facilities – 3.72
Childcare services – 3.57
Library Services – 4.25
Environment
A commitment to continually improve environmental efficiencies, reduce dependence on foreign oil and fossil fuels that emits greenhouse gases and promote sustainability
Reduction in power consumption by using solar panels and LED lighting.
All high use energy consumption buildings will be fitted with solar panels and LED lighting by 2030, wherever possible.
Baseline audit yet to be undertaken.
Utilisation
Buildings are used to their full potential (high volume service provider)
Annual assessment of usage levels and buildings used within capacity
Baseline audit yet to be undertaken.
Over time these standards and levels of service will be further enhanced and may differ between customer segments and between buildings.
It is therefore important to consider for future PAMP revisions, if different customer groups need to be identified the results of future customer surveys need to be aggregated by customer types.
3.6.2 Technical Levels of Service
Supporting the community service levels are technical measures of performance.
As Council is responsible for a large number and range of property types it has been determined that different standards are necessary for different building functions. For
Page 34 of 52
OFFICIAL-Sensitive Key Performance Measure Level of Service Performance Measure 2021 Performance
Table 13 - Customer Levels of Service
Property Asset Management Plan 2022-2032
example, the service provided at an operational building would be lower than that provided by a library or childcare facility. Each of the properties within Council’s building portfolio has been assigned to one of these five categories as documented in Table 19 - Asset Criticality / Hierarchy for Buildings.
Technical service measures are linked to annual budgets covering operations, maintenance, renewal and upgrade activities as defined in the Lifecycle Management Section.
TECHNICAL LEVELS OF SERVICE
Accessibility
Facilities comply with relevant minimum accessibility standards relative to building function
Compliance of available facilities with current standards relative to building function
Page 35 of 52
OFFICIAL-Sensitive
2021 Performance
Key
Performance Measure Level of Service Performance Measure
Condition
Condition
Average
1.8
0%
state
Service
Condition
Building network
years Average
1.7 out of 5 0.11% in condition state 5 Service
Condition
Building
years Average
2.0 out of 5 0.18% in condition state 5 Service
Condition assessment
Building network
years Average
1.7 0.06% in condition state 5 Service
Condition assessment
Building network
years Average
and
2.4 0.02% in condition state
Baseline audit yet to be undertaken.
Service Level 1 -
assessment of Building network every 3-4 years
network condition <= 2.5 out of 5 and with < 5% of stock in condition state 5.
out of 5
in condition
5
Level 2 -
assessment of
every 3-4
network condition <= 3 out of 5 and with < 5% of stock in condition state 5.
Level 3 -
assessment of
network every 3-4
network condition <= 3 out of 5 and with < 10% of stock in condition state 5.
Level 4 -
of
every 3-4
network condition <= 3.5 out of 5 and with < 5% of stock in condition state 5.
Level 5 -
of
every 3-4
network condition <= 3.5 out of 5
with < 10% of stock in condition state 5.
5
Table 14 - Technical Levels of Service
Property Asset Management Plan 2022-2032
4 Future Demand
This section identifies the effect of expected growth and consequent demand on Council’s building asset infrastructure. Forecasting future demand is essential in determining lifecycle management for assets. The management of building and facilities assets is directly affected both by growth in the number of assets and growth in the resident as well as visiting populations.
4.1 Demand Drivers
Drivers affecting building assets demand include factors such as population change, changes in demographics, technological changes and environmental changes. Building assets within the Council area must serve both the local resident population needs as well as the commuter and visitor needs.
4.2 Demand Forecasts
The present position and projection for demand drivers due to population growth that may impact future service delivery and utilisation of assets are identified and documented in Table 15 - Demand Factors, Projections and Impact on Services
Population Growth The Inner West Council population forecast for 2022 is 207,294, and is forecast to grow to 247,881 by 2041, resulting in a 19.58% population increase.
Source: Population and household forecasts, 2016 to 2041, prepared by Forecast.Id, December 2020.
15 -
Page 36 of 52
OFFICIAL-Sensitive
Demand Factor Present position Projection
Table
203,693 221,200 230,743 239,894 247,881 8.6% 4.3% 4.0% 3.3% 0.00% 2.00% 4.00% 6.00% 8.00% 10.00% 0 50,000 100,000 150,000 200,000 250,000 300,000 2021 2026 2031 2036 2041 Inner West Council Estimated Population Growth Population Percentage increase
Demand Factors, Projections and Impact on Services
Property Asset Management Plan 2022-2032
The largest increase in persons between 2016 and 2032 is forecast to be in ages of parents and homebuilders (35 to 49), which is expected to increase by 7,119 and account for 23.1% of the total persons. This age group is closely followed by increases in age group (70-84) which is expected to increase by 6,226 persons, age group (2534) which is expected to increase by 6,170 persons and age group (18-24) which is expected to increase by 4,993 persons.
The emerging needs of the population growth suggests that demand for facilities will need to cater for demand drivers over the following 10 years as illustrated in Table 16.
Demand Driver Impact on Services
Increase of population and population density at a rate of approximately 1.7% per annum over the following 5 years, reducing to 0.8% per annum thereafter until 2031.
General increase in demand for all building services.
Aging Population Changing service needs and changing building requirements, particularly relating to accessibility.
Growing number of families in the area.
Climate change will see an increased risk of extreme weather events including storm events, heatwave, flooding, sea-level rise and fire events.
Increase need for quality family care, libraries and recreation facilities
There will be an increase in structural damage caused by extreme events and an increase in deterioration rates of building assets.
Introducing climate risk assessments will determine the impact on building performance and useful lives
Sustainability Introducing new sustainability technology when renewing and upgrading buildings will ensure that ratepayers’ dollars go further meaning the cost savings can be put towards improving additional buildings.
Table 16 – Demand Drivers, Projections and Impacts on Services
4.3 Changes in Technology
Council is continuously monitoring new asset treatments that may be available to increase the life of its assets. Table 17 details technology changes that are forecasted to affect the delivery of services covered by this plan.
Page 37 of 52
OFFICIAL-Sensitive
Property Asset Management Plan 2022-2032
Technology Change Effect on Service Delivery
Improvement in techniques and materials
Low energy design
Changes in methodology, longer life materials and better rehabilitation techniques enable building assets to be maintained and managed more cost effectively, with a potentially longer useful life
Increased efficiencies of low energy design therefore certain new building designs for example lights can incorporate energy efficient and sustainable practices
Solar Power
Asset Information System
Installation of buildings with solar power panels will reduce greenhouse gas emissions.
Improved information systems for mapping, recording information and managing assets. Adjustment of the building inspection regime to match the amount of public usage and deterioration on certain components for example kitchen and toilet fitouts and floor coverings.
Material
Moving away from timber especially CCA treated products to materials with a longer asset life such as recycled plastic
Table 17 – Changes in Technology and Forecast on Service Delivery
These technological factors need to be assessed in determining the scoping requirements for maintenance works, renewal, upgrade and new building projects. There will be changes to asset management technology, in particular the monitoring and data collection roles. These upgrades in technology may require consideration of modifications to service levels as and when appropriate.
4.4 New Assets from Growth
At present Council seeks to negotiate with developers to provide more affordable housing with the management of these properties outsourced. Council envisages that over the following 10 years, it will acquire new buildings and/or construct new buildings to meet demand needs, however, these have yet to be quantified and will be reflected in future PAMP revisions as details become available.
As additional information becomes available with regards to new growth and development areas, Council will continue to identify the community infrastructure needs via the CAN, and masterplans and these will be included in future revisions of this PAMP.
It is important to note that when new assets are acquired, or assets are expanded or upgraded, this results in an increase in commitment of annual operational and
Page 38 of 52
OFFICIAL-Sensitive
Property Asset Management Plan 2022-2032
maintenance funding to ensure continued service delivery of the asset over its lifecycle.
4.5 Demand Management Plan
The demand for building assets at Council will increase proportionally with the predicted population growth and predicted demographic changes. This is also in line with the community expectation where the provision of swimming pools and aquatic centres, community centres and facilities, childcare services, libraries and protection of heritage buildings is of importance to the community.
Demand for new services will be managed through a combination of managing existing assets, upgrading existing assets and providing new assets to meet demand and demand management. Demand management practices include non-asset solutions, insuring against risks and managing failures. Opportunities identified to date for demand management are shown in Table 18. Further opportunities will be developed in future revisions of this PAMP
Service Activity Demand Management Plan
Increase in demand for all services
• Encourage sharing of existing buildings to maximise the utilisation allows planning for optimum use of all buildings.
• Review existing facilities to ensure continuing suitability.
• Regularly review the CAN to identify areas and assess needs.
• Document a Social Infrastructure Plan framework that will drive future CAN reviews.
Improved access to services required
Increased need for maintenance and renewal costs
• Upgrade existing building access over time and ensure new or upgraded buildings are Disability Discrimination Act compliant.
• Review and document levels of services after consultation with the Service Managers and the community.
• Incorporate total asset lifecycle costings into asset management.
• Procure large services contracts to get better economies of scale to minimise costs.
Changing service needs and changing building requirements, particularly relating to accessibility.
Community expectations
• Plan new projects to incorporate best practice and review compliance and accessibility needs for existing sites. Prioritise upgrade projects which have the most positive impact.
• Monitor community expectations through annual and targeted community surveys or deliberative engagement
Table 18 - Demand Management Plan Summary
Page 39 of 52
OFFICIAL-Sensitive
5 Risk Management Planning
5.1 Asset Criticality / Hierarchy
To manage Council’s building assets more effectively, they have been categorised based on the level of importance and criticality.
The Building hierarchy adopted by Council takes into account the varying risk and service levels associated with the building asset portfolio and is summarised as follows:
• High level of management and service being a highly important facility to both the Community and Council.
Level 1
• Community has high expectations on proper maintenance and management.
• Building aimed to serve a wider community including patrons outside of the LGA.
• Or building utilisation or occupancy on average higher than 80%
• High to moderate level of management and service being an important facility to both the Community and Council.
Community Centre, Library, Administration Major, Aquatic Centre
Level 2
• Community has high expectations on proper maintenance and management.
• Building typically aimed to serve community within LGA
• Or building utilisation or occupancy on average between 60% to 80%.
• Average level of management and service being a medium importance facility to both the Community and Council.
Childcare, Community Centre, SES, Administration
Level 3
• Community has medium expectations on proper maintenance and management.
• Building aimed to serve community within LGA
• Or building utilisation or occupancy on average between 40% to 59%.
Amenities, Public Halls, Recreational, Commercial Lease, Residential
Level 4
• Reasonable level of management and service being a medium importance facility to both the Community and Council.
• Community has low expectations on proper maintenance and management.
Operational, Storage, Amenities
Page 40 of 52 Property Asset Management Plan 2022-2032 OFFICIAL-Sensitive
Criticality / Hierarchy Description Example Building Type
Property Asset Management Plan 2022-2032
Criticality / Hierarchy Description
• Building uses for Council operational services and/or aimed to service community within surrounding suburbs
• Reasonable level of management and service being a low-level importance facility to both the Community and Council.
Example Building Type
Level 5
• Community has negligible expectations on proper maintenance and management.
• Building used typically for Council operational services
Table 19 - Asset Criticality / Hierarchy for Buildings
5.2 Risk Management Plan
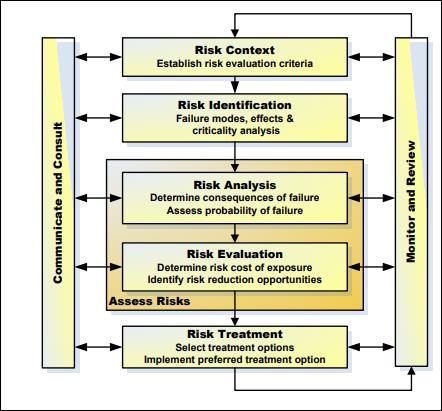
Council has identified the need to develop a corporate Risk Management Policy which will set the overall framework for addressing risk within the context of International Standard ISO31000-2018, Risk management – Principles and Guidelines.
Risk Management is defined in ISO31000:2018 as: ‘coordinated activities to direct and control with regard to risk’.
The development and adoption of this Policy will outline Council’s commitment to manage its resources and responsibilities in a manner which is intended to minimise harm or loss. The elements of this framework are illustrated in Figure 10
Page 41 of 52
OFFICIAL-Sensitive
Operational, Storage, Caretaker Residence
5.3 Risks Assessment
Council has developed an asset criticality matrix, giving higher importance to risk assessment and the appropriate levels of inspection and maintenance for each classification.
Critical assets are those which have a high consequence of failure causing significant loss or reduction of service. Similarly, critical failure modes are those which have the highest consequences. By identifying critical assets and failure modes, investigative activities, condition inspection programs, maintenance and capital expenditure plans can be targeted at the critical areas. Activities may include items such as increased inspection frequency and higher maintenance intervention levels.
5.3.1 Risk Plan
As a result of this PAMP revision, an assessment of risks associated with service delivery from Council’s building assets has identified the critical risks that will result in significant loss, ‘financial shock‘ or a reduction in service.
Page 42 of 52
2022-2032 OFFICIAL-Sensitive
Property Asset Management Plan
Figure 10 – Risk Management Process, Source: ISO31000:2018
Property Asset Management Plan 2022-2032
Critical risks are those assessed with ‘Very High’ (requiring immediate corrective action) and ‘High’ (requiring corrective action) risk ratings identified in the Infrastructure Risk Management Plan. The residual risk and treatment cost after the selected treatment plan is implemented is shown in Table 20
Childcare facilities Closure of facilities and alternate care requirements for infants. Failure to provide Service Delivery
High Ensure facilities are maintained and comply with relevant Legislation and Australian Standards.
Medium Routine maintenance and inspections are carried out. Reactive maintenance requests are reviewed and actioned within appropriate time frames.
Tempe Leachate Treatment Plant Environmental Pollution
High Ensure that the leachate plant is able to operate at full capacity as required. Undertake regular & routine maintenance of the leachate treatment system.
Medium On-going operational and maintenance expenditure of approximately $270K per annum.
All Buildings Fire
High Ensure that all Council buildings comply with relevant Legislation and Australian Standards relating to Fire Safety & Evacuation Procedures.
Medium Undertake annual fire equipment maintenance and building fire certification using annual operating budgets. Seek additional capital funds to support any identified additional requirements. Estimated cost per annum $25k.
All Buildings Electrical Fault/Electrocution
High Any known electrical faults and deficiencies are repaired as a High Priority.
Regular Tagging & Testing of Electrical equipment in hostile environments to comply with requirements of
Medium Annual tagging and testing of equipment carried out by external service providers
Estimated cost per annum $15k.
Page 43 of 52
OFFICIAL-Sensitive
Service or Asset at Risk What can Happen Risk Rating Risk Treatment Plan Residual Risk Treatment / Costs
Property Asset Management Plan 2022-2032
or Asset at Risk What can Happen Risk Rating Risk Treatment Plan Residual Risk Treatment / Costs
Australian Standards Upgrade all switchboards and install Residual Current Devices (RCD's) on all power circuits (to meet WH&S requirement 1 Jan 2013).
All Building Structural Failure High Adopt a systematic inspection regime to regularly assess the structural integrity of critical building elements
All Building Flooding High Identify buildings that are impacted by severe flooding and plan for remediation works where possible and/or prepare evacuation plans.
6 Financial Summary
Medium Undertake building asset inspections every 3 to 5 years Estimated cost per inspection cycle $120k.
Medium Undertake analysis of critical impacts, building RLs and areas. Costs to be determined.
The provision of adequate financial resources ensures that Council’s building assets are appropriately managed and preserved. Financial provisions below requirements impacts directly on community development and if prolonged, results in substantial needs for “catch up” expenditure imposed on the community in the future. Additionally, deferred renewal results in increased and escalating reactive maintenance as aged assets deteriorate at increasing rates.
6.1 Forecasted Funding Requirements
The objective of this Section has been to model the deterioration of Council’s building assets portfolio, by developing a simulation model using the Brightly Software Predictor© modelling software.
This process typically involves setting up life cycle paths for each building asset / component, along with their inspected condition, identifying the appropriate
Page 44 of 52
OFFICIAL-Sensitive
Service
Table 20 – Critical Risks and Treatment Plan
Property Asset Management Plan 2022-2032
treatments and unit rates to deliver these treatments and configuring the treatment rule base (matrices based on selected condition criteria that when matching will drive a treatment based on the condition).
By utilising the above process and setting up the criteria and logic within the predictive modelling software, it is possible to model the future costs of Council’s building asset portfolio renewal requirements and to predict the future condition of these assets under varying funding scenarios.
6.2 Funding Scenarios
The 2022 strategic modelling analysis predicts the deterioration of Council’s building asset portfolio by calculating the results of different funding options, utilising a core dataset that is current as at 2022. The length of time predicted for each funding option is for a period of 10 years until the year 2032. The results of the analysis have been graphed in Figure 11.
The condition graphs in Figure 11, illustrates the predicted results of the building asset portfolio modelling analysis for each of the different funding options. These funding options are described in Table 21 – Predictive Modelling Funding Options
The current average condition11 as at 2022 for the entire building asset portfolio is an average condition of 1.7 out of 5 Refer to Table 6 – Asset Condition Rating Guidelines for condition descriptions.
Financial Option Description
Option 1 This funding option models how the building asset portfolio condition would improve or deteriorate and resulting maintenance funding needs, if Council were to fund the current proposed capital works financial allocation over the following 10 years.
Option 2 This funding option identifies and models the current building asset portfolio at the necessary funding levels each year in order to maintain current levels of service at the end of 10 years.
Table 21 – Predictive Modelling Funding Options
The net strategy comparison outcomes of the financial options that have been modelled are detailed in Table 22 – Predictive Modelling Funding Options - Net Strategy Comparison.
Page 45 of 52
OFFICIAL-Sensitive
11 The sum average of every building component within Council’s building portfolio
Property Asset Management Plan 2022-2032
6.3
Funding the current levels detailed in the current LTFP (Option 1) will result in Council delivering slightly better than current levels of service into the future.
The funding strategy (Option 2) predicts that to maintain existing average condition into the future, that current funding levels could be decreased by $16M over the following 10 years. However, whilst the average condition is predicted to be similar to current levels (1.3 in 2032 compared to 1.7 in 2022), the predictive modelling predicts that the quantum of assets considered to be in backlog (i.e. in condition state 5 being very poor) would increase from the current $20.33M to $23.75M, resulting in a $3.42M increase.
Therefore the preferred funding option for this PAMP is Option 1.
12 The current capital works list of project candidates is currently being reviewed and revised by Council officers. It is envisaged that once new condition data is collected in 2023/2024, that the strategic models will be re-run and calibrated.
Page 46 of 52
OFFICIAL-Sensitive Financial Option Treatment Cost ($,000)12 Backlog Value ($,000) Change in Backlog Value ($,000) Net Strategy Cost ($,000) Final OSI Option 1 $166,981 $8,680 -$11,650 $155,331 1.2 Option 2 $150,895 $23,750 $3,413 $154,308 1.3
Table 22 – Predictive Modelling Funding Options - Net Strategy Comparison
Forecast 10-Year Capital Renewal Funding
Figure 11 – Forecast 10-Year Capital Funding Analysis and Average Condition by Year
1 1.5 2 2.5 3 3.5 4 4.5 5 $0 $5,000 $10,000 $15,000 $20,000 $25,000 1 2 3 4 5 6 7 8 9 10 Service State Cost Thousands Year Option 1 - Current Funding Allocation Option 2 - Maintain LoS
Property Asset Management Plan 2022-2032
23 – Desired 10-Year Funding Strategy (Option 1)
There are a number of studies and investigations being undertaken which may identify additional funding needs to acquire new and upgrade existing building assets to meet required service levels, over the following 10 years.
6.4 Financial Ratios
Asset management ratios provide insight into an organisation’s performance and success in managing its assets. Council’s asset management ratios for its asset portfolio calculated as at 30 June 2021 are shown in Table 24 – Key Asset Management Ratios.
The extent with regards to how the organisation is funding their capital works program when comparing allocated capital works expenditure with the desired expenditure which has been derived from prediction modelling and/or service level agreements.
13 This funding plan will be reviewed in conjunction with the next PAMP update in 2026. As new information becomes available on building project needs from the Service providers, growth demand needs and asset lifecycle, these will be reflected in the 10-Year Funding Strategy.
Page 47 of 52
OFFICIAL-Sensitive 2022-23 ($,000) 2023-24 ($,000) 2024-25 ($,000) 2025-26 ($,000) 2026-27 ($,000) 2027-28 ($,000) 2028-29 ($,000) 2029-30 ($,000) 2030-31 ($,000) 2031-32 ($,000) New/Upgrade13 5,184 4,960 2,943 2,789 2,590 1,959 1,390 1,478 1,338 1,230 Renewal 19,390 19,639 15,097 13,405 10,665 13,463 15,090 9,175 13,682 11,513 Total Capital 24,574 24,599 18,040 16,194 13,255 15,422 16,480 10,653 15,020 12,743 Maintenance & Operational 12,805 12,943 13,142 13,359 13,571 13,786 14,007 14,241 14,482 14,482 Table
Ratio Description Calculation Target 2021 Performance Asset Renewal Funding Ratio
Funded capital expenditure on renewals divided by the planned/desired capital expenditure. >75% 100%
Property Asset Management Plan 2022-2032
The overall health of the organisation’s asset stock in terms of measuring past asset consumption, via the amount of accumulated depreciation. The lower this ratio is, the more the asset stock has been consumed, which also indicates that not enough capital expenditure has been allocated to the asset.
the level of maintenance funding spent per annum, as a % of asset replacement value on the asset portfolio.
Page 48 of 52
OFFICIAL-Sensitive Ratio Description Calculation Target 2021 Performance
Remaining Service Index Ratio
Written down value (fair value of the portfolio) divided by
total
replacement value. >70% 72% (Buildings, Structures & Land Improvements) 85% (Aquatic Centres)
Total maintenance funding per annum / Total Replacement Value, expressed as a percentage. 2-5% 2.9%
the
current
Maintenance Sustainability Ratio Measures
Table 24 – Key Asset Management Ratios
7 Plan Improvement and Monitoring
This section outlines how Council will measure its asset management performance. The identified action items in Table 26 will enable Council to improve its asset management capability, to enhance asset value and deliver more for stakeholders while balancing cost, risk and performance.
7.1 Assumptions
The key assumptions made in this PAMP and risks that these may change are shown below.
Building asset and component conditions reflect the assets current condition as at 2022.
The allocation of renewal funds have been based on the asset replacement costs developed as part of the valuations in June 2021.
Maintenance funding levels will be progressively increased to represent as a minimum, 2% of the asset base replacement value.
The funding needs for new &/or upgrade building assets will be identified via CANS and masterplans and funding sought from grants and/or developer contributions. As identified, these will be incorporated into future PAMP revisions.
Capital renewal treatments are like for like and do not account for additional costs to upgrade and/or utilise new technologies and materials.
Current Levels of Service are considered appropriate and meet community needs.
Existing Essential Safety inspections and maintenance contracts will not change.
Asset register currency pertaining to asset quantities.
Network strategic condition inspections will be funded on a 3-4 year cyclic basis and incorporated into the Operational budget.
Current human resource plan will not change in the near future.
Table 25 – Key Assumptions made in PAMP and Risks of Change
Page 49 of 52
Plan 2022-2032 OFFICIAL-Sensitive
Property Asset Management
Key Assumption Risk of Change to Assumption / Impact to Model
Medium
Medium to Low
Medium
Medium
Medium
to Low
Medium
Medium
Low
Low
Low
Property Asset Management Plan 2022-2032
7.2 Improvement Plan
The Asset Management Improvement Plan which is set out in Table 26 below details the key improvement tasks. Completion of these tasks will improve Council’s asset management capabilities for this asset class.
1. Develop a Building responsibility matrix with a view to identify and streamline roles and responsibilities.
2. Formally document the rule bases which reflect the policy decisions that Council employs to determine when they will select building assets for inclusion on their capital works program.
3. Review current Asset register for completeness and accuracy, especially pertaining to asset hierarchy, dimensions, function, and materials.
4. Review and formally document the current operations and maintenance Levels of Service with regard to all building assets owned or maintained by Council. These activities should take into account the building function, legislative requirements and utilisation needs when documenting activities and response times.
5. Review and formally document Council’s building condition assessment manual methodology framework. Review should incorporate assessment of need to introduce additional building components (such as floor coverings, mechanical, electrical etc) within assessment to assist with long-term strategic planning outcomes.
6. Develop and implement an asset handover process to enable 100% asset data capture of new building assets gifted or constructed by others and those renewed, to be captured in Council’s asset register on an annual basis.
7. Progressively develop operations and maintenance management plans for key building assets (i.e Marrickville Library, Balmain Town Hall) across the portfolio.
Page 50 of 52
OFFICIAL-Sensitive
Task No Improvement Items Responsibility Timeline
Facilities Manager & Strategic Investments and Property Manager June 2023
Facilities Manager & Senior Manager Capital Works & Strategic Investments and Property Manager June 2023
Engineering Services Manager December 2023
Engineering Services Manager & Facilities Manager December 2023
Engineering Services Manager & Facilities Manager December 2023
Engineering Services Manager & Facilities Manager December 2023
Facilities Manager June 2024
Property Asset Management Plan 2022-2032
8. Review and update activities within the Customer Request Management System following development of maintenance service levels and develop reports to measure performance in accordance with the levels of service documented in Section 3.5.1. Incorporate activity to capture resident request for renewal, upgrade or new requests.
9. Develop and document a criticality framework which will be incorporated into the asset register and second-generation prediction models.
10. Formally document a Risk Management Policy which will set the overall framework for addressing infrastructure asset risk within the context of International Standard ISO31000-2018
11. Ensure that new asset needs identified from the CANS, Land and Property Strategy and other studies are reflected in future PAMP and the LTFP.
12. Progressively incorporate Maintenance Schedules into existing leases as they fall due for renewal to identify asset lifecycle responsibilities.
13. Implement and schedule network wide building condition assessments on a 3-5 yearly cycle, commencing in 2023 to coincide with Council’s building revaluation requirements.
14. Explore opportunities for future community surveys to incorporate additional specific questions to the community regarding building assets, to identify and measure the importance and performance in delivering this service to the community.
15. Review financial forecasts annually as better data becomes available, update and submit any supporting budget bids.
Property Manager
Facilities Manager & Financial Partnering and Analytics Manager
Manager
Facilities Manager & Financial Partnering and Analytics Manager
Page 51 of 52
OFFICIAL-Sensitive
No Improvement Items Responsibility Timeline
Task
Facilities Manager June 2024
Engineering Services Manager June 2024
Director Infrastructure June 2024
Engineering Services Manager & Facilities Manager & Strategic Investments and Property Manager & Financial Partnering and Analytics Manager June 2026
Facilities
On-going
Manager & Strategic Investments and
Engineering
On-going
Services Manager &
Facilities
On-going
On-going
Property Asset Management Plan 2022-2032
16. Review resourcing plan to ensure adequate human resources are available to deliver this PAMP.
Table 26 – Improvement Actions
7.3 Monitoring and Review Procedures
Director Infrastructure & Director Corporate & Director Planning
The PAMP has a planning horizon of 10 years, and it is based on details documented within the Asset Management Strategy. The PAMP will be reviewed and updated in the year following Council Local Government elections.
This PAMP will be reviewed and amended to recognise any changes in service levels, needs arising from PSP and master plans and/or resources available to provide those services as a result of the budget decision process.
7.4 Performance Measures
The effectiveness of this PAMP will be measured and monitored on the basis of annual strategic Council indicators as follows:
• The performance of Council against the Levels of Service documented in this PAMP; and
• Performance against the Asset Management Ratios.
On-going
Page 52 of 52
OFFICIAL-Sensitive
Task No Improvement Items Responsibility Timeline
