Inner
i
West Council Transport Asset Management Plan 2022-2032
ii Document Control...................................................................................... iv Document History...................................................................................... iv Definitions ................................................................................................. iv 1 Executive Summary......................................................................5 1.1 The purpose of the Plan ...............................................................5 1.2 Current State of Council’s Assets .................................................5 1.3 Asset Funding Levels ...................................................................9 1.4 Monitoring and Improvement Program .......................................11 2 Asset Class Information .............................................................11 2.1 Background................................................................................11 2.1.1 Transport Assets Included in this AM Plan .................................12 2.1.2 Transport Assets Exclusions ......................................................13 2.2 Current State of the Assets ........................................................13 2.2.1 Current Replacement Costs........................................................14 2.2.2 Transport Information Management...........................................15 2.2.3 Current Asset Performance........................................................15 2.2.4 Condition Assessment ...............................................................18 2.3 Lifecycle Management ...............................................................18 2.3.1 Operations & Maintenance Plan..................................................19 2.3.2 Renewal/Replacement Plan........................................................19 2.3.3 Upgrade/Expansion Plan ............................................................20 2.3.4 Creation/Acquisition Plan...........................................................21 2.3.5 Disposal Plan .............................................................................22 2.4 Leadership and Accountability....................................................22 3 Levels of Service........................................................................22 3.1 Social Infrastructure Planning ....................................................22 3.2 Customer Research and Expectations ........................................23 3.3 Strategic and Corporate Goals Alignment...................................24 3.4 Key Stakeholders .......................................................................26 3.5 Legislative Requirements ...........................................................28 3.6 Level of Service..........................................................................32 3.6.1 Customer Levels of Service........................................................33 3.6.2 Technical Levels of Service ........................................................34 Table of Contents
iii 4 Future Demand...........................................................................36 4.1 Demand Drivers..........................................................................36 4.2 Demand Forecasts .....................................................................36 4.3 Changes in Technology ..............................................................39 4.4 New Assets from Growth............................................................40 4.5 Demand Management Plan.........................................................40 5 Risk Management Planning........................................................42 5.1 Asset Criticality / Hierarchy........................................................42 5.2 Risk Management Plan...............................................................43 5.3 Risks Assessment......................................................................44 5.3.1 Risk Plan....................................................................................44 6 Financial Summary.....................................................................45 6.1 Forecasted Funding Requirements .............................................45 6.2 Funding Scenarios......................................................................46 6.3 Forecast 10-Year Capital Renewal Funding.................................47 6.4 Financial Ratios..........................................................................48 7 Plan Improvement and Monitoring..............................................49 7.1 Assumptions ..............................................................................49 7.2 Improvement Plan......................................................................50 7.3 Monitoring and Review Procedures ............................................52 7.4 Performance Measures ..............................................................52
Document Control
Definitions
Explanation of definitions and acronyms used in this plan
Term/Acronym Definition
AASB Australian Accounting Standards Board
AM Strategy Asset Management Strategy
Backlog
The quantum of assets that are below the levels of service reflected in the modelling rule base and hence due for a capital treatment, however, funding is not enough to treat these assets.
The current hypothetical cost of recouping this backlog (i.e. TAMP funding required to bring every asset in condition state 5, Very Poor, back to a condition state 1, being Very Good) by immediate capital renewal.
Transport Strategy Going Places - An Integrated Transport Strategy for Inner West 2020
Condition or Service State
The service state involves the use of a single integer between 1 and 5 to describe the ability for the asset in question to fulfill its function; where 1 is very good and 5 is very poor.
IIMM International Infrastructure Management Manual
ISO55000 55000 Series, International Suite of Asset Management Standards
LTFP Long-Term Financial Plan
Net Strategy Cost Total cost lifecycle scenario strategy. Calculation; Total Capital Cost over 20 Years + Total Maintenance & Operational Cost over 10 Years – Backlog Movement Over 20 Years.
Non-current assets Physical and intangible infrastructure assets, including information and communication technology (ICT) assets, controlled by the organisation
SAM Strategic Asset Management
TAMP Transport Asset Management Plan
iv
Version Date Status Author Summary of changes 0.2 19/5/2022 Draft T. Blefari Initial draft TAMP 0.3 26/5/2022 Final T. Blefari Updates following internal feedback.
Document History
Transport Asset Management Plan 2022-2032
1 Executive Summary
1.1 The purpose of the Plan
The purpose of this Transport Asset Management Plan (TAMP) is to inform Inner West Council’s (Council) commitment to best practice asset management and provide principles for sound asset investment decision making in its transportation network
The TAMP documents the overall integrated planning framework to guide and improve Council’s long-term strategic management of its roads, paths, kerbs, bridges, traffic management devices and street furniture in order to cater for the community’s required levels of service into the future as detailed in Section 3.6 Level of Service. The TAMP defines the state of Council’s transport assets as at the 2022 Financial Year, the 10-year funding required to achieve Council’s adopted asset performance targets and planned asset management activities over a 10-year planning period.
This TAMP is to be read in conjunction with Council’s Asset Management Strategy.
1.2 Current State of Council’s Assets
The value of transport assets covered by this TAMP is estimated at $1.38B as at 30th June 2022 and summarised in Table 1

Page 5 of 52
OFFICIAL-Sensitive
Asset Type Replacement Cost ($,000) Accumulated Depreciation ($,000) Fair Value ($,000) Annual Depreciation ($,000) Roads $818,062 $104,547 $713,515 $5,543 Carparks $27,294 $2,429 $24,866 $250 Kerb & Gutter $213,557 $80,431 $133,127 $1,413 Footpaths $225,129 $84,232 $140,896 $3,260 Traffic Management Devices $46,584 $9,746 $36,838 $775 Street Furniture $34,271 $5,249 $29,022 $1,102 Bridges $15,995 $5,881 $10,114 $818 Grand Total $1,380,892 $292,515 $1,088,378 $13,161
Table 1 - Asset Valuations as at 30th June 20221
1 Source: Inner West Council | Draft Unaudited Valuations for 30 June 2022. Note that bridge values are as per audited 30 June 2021 statements.
Transport Asset Management Plan 2022-2032
The following dashboard provides a high-level overview of the current condition (service state) of all transport assets owned and maintained by Council. The service state is a numerical score assigned to each major transport component (asset) to represent its current performance (i.e. where is the asset on its lifecycle path). Utilising predictive modelling software and associated pavement management techniques, Council is able to simulate each asset's degradation (the transition from one condition state to another through its lifecycle) to predict when assets will reach intervention and require future treatment intervention.
Refer to Table 5 – Asset Condition Rating Guidelines for condition definitions.
Page 6 of 52
OFFICIAL-Sensitive
$1,381M Asset Value 30,000+ Asset / Component Quantities $29.53M Backlog Value 2.0 out of 5 Average Condition (Service State) Roads Condition Distribution Roads Condition Distribution by Replacement Value 1.70% 31.58% 39.09% 25.38% 2.24% Condition 1 Condition 2 Condition 3 Condition 4 Condition 5 $13.93 $258.35 $319.79 $207.63 $18.35 $0 $50 $100 $150 $200 $250 $300 $350 Condition 1 Condition 2 Condition 3 Condition 4 Condition 5 Millions
Transport Asset Management Plan 2022-2032
Page 7 of 52
OFFICIAL-Sensitive Bridge Condition Distribution Bridge Condition Distribution by Replacement Value Kerbs Condition Distribution Kerbs Condition Distribution by Replacement Value 11.03% 52.94% 22.79% 11.76% 1.47% Condition 1 Condition 2 Condition 3 Condition 4 Condition 5 $2.99 $8.94 $3.30 $0.66 $0.10 $0 $1 $2 $3 $4 $5 $6 $7 $8 $9 $10 Condition 1 Condition 2 Condition 3 Condition 4 Condition 5 Millions 0.60% 12.55% 85.95% 0.84% 0.05% Condition 1 Condition 2 Condition 3 Condition 4 Condition 5 $2.80 $28.35 $181.31 $1.08 $0.02 $0 $20 $40 $60 $80 $100 $120 $140 $160 $180 $200 Condition 1 Condition 2 Condition 3 Condition 4 Condition 5 Millions
Transport Asset Management Plan 2022-2032
Page 8 of 52
OFFICIAL-Sensitive Footpaths Condition Distribution Footpaths Condition Distribution by Replacement Value Car Parks Condition Distribution Car Parks Condition Distribution by Replacement Value 2.20% 14.27% 63.67% 17.90% 1.95% Condition 1 Condition 2 Condition 3 Condition 4 Condition 5 $18.45 $46.54 $138.14 $20.96 $1.04 $0 $20 $40 $60 $80 $100 $120 $140 $160 Condition 1 Condition 2 Condition 3 Condition 4 Condition 5 Millions 11.96% 24.57% 52.30% 9.27% 1.90% Condition 1 Condition 2 Condition 3 Condition 4 Condition 5 $3.26 $6.71 $14.28 $2.53 $0.52 $0 $2 $4 $6 $8 $10 $12 $14 $16 Condition 1 Condition 2 Condition 3 Condition 4 Condition 5 Millions
Transport Asset Management Plan 2022-2032
1.3 Asset Funding Levels
The Financial Summary in this TAMP recognises that Council has considered multiple strategic predictive modelling scenarios in the process of deriving its 10-year longterm financial budget, in line with the guiding principles of best practice asset management
Page 9 of 52
OFFICIAL-Sensitive Traffic Management Devices Condition Distribution Traffic Management Devices Condition Distribution by Replacement Value Street Furniture Condition Distribution Street Furniture Condition Distribution by Replacement Value
Figures 1 – State of Assets Snapshot as at FY2022
11.89% 67.69% 16.29% 2.75% 1.39% Condition 1 Condition 2 Condition 3 Condition 4 Condition 5 $8.86 $30.42 $6.81 $0.45 $0.05 $0 $5 $10 $15 $20 $25 $30 $35 Condition 1 Condition 2 Condition 3 Condition 4 Condition 5 Millions 36.97% 42.91% 10.77% 0.88%0.53% Condition 1 Condition 2 Condition 3 Condition 4 Condition 5 $20.71 $10.98 $2.23 $0.34 $0.01 $0 $5 $10 $15 $20 $25 Condition 1 Condition 2 Condition 3 Condition 4 Condition 5 Millions
Transport Asset Management Plan 2022-2032
Presently, there are plans to spend approximately $70.67M over the following 10 years to upgrade Council’s transport assets and these have been documented in Council’s current 10-Year Long Term Financial Plan.
In addition to the transport funding in relation to upgrade works, the current levels of funding reflected in Council’s Long-Term Financial Plan (LTFP), relative to Council’s existing transport asset portfolio, have been determined as follows:
• Capital Renewal: $137.8M over 10-years; and
• Maintenance & Operations: $213.14M over 10-years or $21.31M on average per annum.
The total capital funding (including renewals and upgrades), allocated in the Long Term Financial Plan is $208.5M over 10 years This is the recommended funding option, which is modelled and deemed to be sufficient to enable the transport portfolio to achieve its current useful lives through capital and maintenance activities, thereby achieving the level of service targets.
Further financial option details are detailed in the Financial Summary Section. It is envisaged the financial projections will be improved as further information becomes available on the condition, future desired levels of service, asset inventory and asset performance.
Page 10 of 52
OFFICIAL-Sensitive
1.00 1.50 2.00 2.50 3.00 3.50 4.00 4.50 5.00 $0 $5,000 $10,000 $15,000 $20,000 $25,000 1 2 3 4 5 6 7 8 9 10 Service State Cost Thousands Year Option 1 - Current Funding Allocation Option 2 - Maintain LoS
Figure 2 – Total Capital Renewal Cost and Service State (Condition) by Year
Transport Asset Management Plan 2022-2032
1.4 Monitoring and Improvement Program
The improvement action items identified can be found in the Plan Improvement and Monitoring Section.
2 Asset Class Information
2.1 Background
Inner West is one of the most liveable places in Greater Sydney. The transport asset portfolio of Inner West Council (Council) provides a vital service to the local community. Most services within Council can be accessed within walking distance.
A high number of Inner West residents walk and use public transport to get to places of work, leisure and other destinations compared to the Greater Sydney average. However the growth of Sydney and Inner West is impacting upon the users' ability to move around. Roads are generally congested during weekday peak periods and weekends, competition for parking is high, there are limited separated cycle paths and there is a lack of bus priority on certain roads.
Issues facing Council include increasing traffic numbers at certain intersections exacerbated to some degree by major motorway projects in the area, crowding on a number of public transport services in peak periods and poor frequency levels for a number of bus services, competition for different forms of parking on local streets, busy roads and poor quality walking paths on some road sections (such as Parramatta Road).
These transport assets represent a significant investment by Council and are of vital importance to providing its residents and businesses with quality services.
Page 11 of 52
OFFICIAL-Sensitive $208.51M Total Capital Cost $29.53M Initial Backlog 2.0 Initial Condition $213.14M Total Maintenance & Operational Cost $7.35M Backlog at Yr 10 2.2 Condition at Yr 10 $421 69M Total Lifecycle Cost -$22.18M Change in Backlog $399.51M Net Strategy Cost
2
10-Year Funding & Strategy Results
Recommended Funding Option
Table
–
-
Transport Asset Management Plan 2022-2032
New and upgrade transport needs are identified through Council’s integrated planning framework and various master plans, strategies and studies (such as the Integrated Transport Strategy, for Inner West 2020).
Council’s transport assets range in age and design and have been constructed over time to serve a range of purposes from vehicular and pedestrian access, bike tracks, bridges, footpaths and various street furniture and traffic management devices that complete the network in totality to provide a transportation experience These transport assets may have been built by Council or gifted by a developer to facilitate the delivery of required services to the community
Changing patterns of use and demand with differing maintenance practices and techniques have resulted in a complex network of transport assets in varying conditions. As the responsible authority for the provision and maintenance of this infrastructure asset base, Council recognises the need to ensure the management of this valuable asset portfolio, to ensure that the current and future benefit to the community is delivered at a cost that the community can afford.
2.1.1 Transport Assets Included in this AM Plan
The TAMP includes all transport assets which serve Council’s transportation needs by providing an effective transport network to support safe and efficient movement, connecting people, industry and places.
In all, this TAMP covers over 30,000 individual asset elements as classified by their asset subclass (transport function) and set out in Table 3 – Transport Quantity by Asset Subclass.
This TAMP covers all transport assets which are owned or controlled by Council.
Roads
40.8km
Local 356.75 km
Laneways 67.68 km
Total 465.27km
Page 12 of 52
OFFICIAL-Sensitive
Subclass (Function) Quantity
Asset
Regional
Carparks 144,285 sqm Kerb and Channel 869.7 km Footpaths 864.8 km LATMs 4,700 count
Transport Asset Management Plan 2022-2032
by Asset Subclass
A detailed list of all transport assets for which Council has included in this TAMP is recorded in Council’s Asset Register.
2.1.2 Transport Assets Exclusions
The TAMP excludes all transportation assets owned and maintained by other authorities such as Roads and Maritime Services.
It should also be noted that vehicular crossings are not maintained by Council. These are maintained by the property owners.
2.2 Current State of the Assets
The distribution of Council’s transport asset portfolio by quantities2 is illustrated in Figure 3
Page 13 of 52
OFFICIAL-Sensitive Asset Subclass (Function) Quantity Street Furniture 5,900 count Bridges
Bridges
8 Road
11 Pedestrian Bridges Table 3 – Transport Quantity
2 A
1,456
2,940 88 8,797 10,119 19 4,703 6,021 0 2000 4000 6000 8000 10000 12000 Road Segments Carpark Segments Footpath Segments Kerb and Gutter Segments Bridges Traffic Management Devices Street Furniture
Figure 3 – Distribution of Transport Assets Types by Count
segment represents a linear asset such as a road or footpath broken into manageable lengths As an example Addison Road in Marrickville is
metres long, however this road is broken down into 4 segments, which reflects how Council will perform its operational and maintenance and capital activities.
Transport Asset Management Plan 2022-2032
2.2.1 Current Replacement Costs
The total value of transport assets and structures for which Council is responsible for is currently estimated at $1.38B. The break-up of the asset types by replacement value is illustrated in Figure 4.
Page 14 of 52
OFFICIAL-Sensitive
Asset Type Replacement Cost ($,000) Accumulated Depreciation ($,000) Fair Value ($,000) Annual Depreciation ($,000) Roads $818,062 $104,547 $713,515 $5,543 Carparks $27,294 $2,429 $24,866 $250 Kerb & Gutter $213,557 $80,431 $133,127 $1,413 Footpaths $225,129 $84,232 $140,896 $3,260 Traffic Management Devices $46,584 $9,746 $36,838 $775 Street Furniture $34,271 $5,249 $29,022 $1,102 Bridges $15,995 $5,881 $10,114 $818 Grand Total $1,380,892 $292,515 $1,088,378 $13,161
Figure 4 – Distribution of Transport Asset Estimated Replacement Values by Function
Table 4 - Assets Valuations as at 30th June 20223
59.2% 2.0% 15.5% 16.3% 3.4% 2.5% 1.2% 0.0% 10.0% 20.0% 30.0% 40.0% 50.0% 60.0% 70.0% Roads Carparks Kerb & Gutter Footpaths Traffic Management Devices Street Furniture Bridges
3 Source: Inner West Council | Draft Unaudited Valuations for 30 June 2022. Note that bridge values are as per audited 30 June 2021 statements.
Transport Asset Management Plan 2022-2032
Table 4 identifies the annual asset depreciation of Council’s transport assets to be in the order of $13.16M per annum. The average annual depreciation (asset consumption) is considered a measure of the wearing out or other loss of value of the asset that arises from its use, passing of time or obsolescence due to environmental changes.
It should be acknowledged that depreciation is not an ideal measure and is seldom recommended now in a modern practice with the focus more on sustainability-based analysis of asset service level (long term financial plans based on strategic lifecycle modelling & planning). This TAMP is based on service level based LTFP.
2.2.2 Transport Information Management
All information pertaining to asset type and function, location, constructed year and condition of these transport assets are recorded and stored in Council’s Asset Register which is a module of the Finance System. At the time of preparing this TAMP, it is estimated that Council’s Asset Register is Generation 4 which means that the asset data is current, it is based on modern practices of IPWEA practice notes for condition assessment and is therefore considered a reliable asset register for asset valuations and AM plans.
2.2.3 Current Asset Performance
The following dashboard provides a high-level overview of the current condition (service state) of all transport assets owned and maintained by Council. The condition state is a numerical score assigned to each major transport component (asset) to represent its current performance (i.e. where is the asset on its lifecycle path), with condition state 1 representing an excellent condition and condition state 5 representing a very poor condition.
Refer to Table 5 – Asset Condition Rating Guidelines for condition definitions.
Page 15 of 52
OFFICIAL-Sensitive
Transport Asset Management Plan 2022-2032
Page 16 of 52
OFFICIAL-Sensitive Roads Bridges Footpaths Kerb and Gutter Carparks Traffic Management Devices 1.70% 31.58% 39.09% 25.38% 2.24% Condition 1 Condition 2 Condition 3 Condition 4 Condition 5 11.03% 52.94% 22.79% 11.76% 1.47% Condition 1 Condition 2 Condition 3 Condition 4 Condition 5 2.20% 14.27% 63.67% 17.90% 1.95% Condition 1 Condition 2 Condition 3 Condition 4 Condition 5 0.60% 12.55% 85.95% 0.84% 0.05% Condition 1 Condition 2 Condition 3 Condition 4 Condition 5 11.96% 24.57% 52.30% 9.27% 1.90% Condition 1 Condition 2 Condition 3 Condition 4 Condition 5 11.89% 67.69% 16.29% 2.75% 1.39% Condition 1 Condition 2 Condition 3 Condition 4 Condition 5
Transport Asset Management Plan 2022-2032
Based on condition audits and inspections carried out by specialised Council contractors in 2021, Council’s bridges, traffic management devices and street furniture assets are estimated to be in good to very good condition as shown in Figure 5, with each of these asset types displaying well over 60% of the asset stock in condition states 1 and 2.
Roads, footpaths, kerbs and gutter and carparks are considered to be in average condition, with each of these asset types displaying between 30% to 85% of the asset stock in condition state 3. It is worth noting that roads, footpaths, bridges and carparks have also a considerable proportion of the asset stock in condition state 4 (poor).
The average network portfolio condition is 2.0 out of 5 with condition 1 representing an asset in brand new condition and condition 5 representing an asset that has failed or exceeded its design life.
Changing patterns of use and demand with differing maintenance practices and techniques have resulted in a complex network of transport with over 30,000 assets in varying conditions.
The framework documented in Council’s Asset Management Policy, and the Strategies documented in the Asset Management Strategy and supported by this TAMP will place Council in a good position to address the asset issues currently faced.
Page 17 of 52
OFFICIAL-Sensitive
Street Furniture
Figure 5 – State of Assets Snapshot as at FY2022
36.97% 42.91% 10.77% 0.88%0.53% Condition 1 Condition 2 Condition 3 Condition 4 Condition 5
Transport Asset Management Plan 2022-2032
2.2.4 Condition Assessment
In conjunction with the network wide condition inspections undertaken by Council’s specialist contractors in late 2021, a condition rating framework was developed from industry best practice and used to perform the visual inspections. Bridge level 2 inspections have been scheduled for completion in 20224
Council will formally document a detailed transport condition assessment manual incorporating the framework used to assess the transport network condition.
Typically, network wide condition assessments are undertaken on a three to five year cycle (coinciding with the financial revaluations) and used to identify where transport assets are within their defined useful lives at any given point in time.
The condition rating system, which has been normalised for the purposes of this TAMP is summarised in Table 5 – Asset Condition Rating based on IPWEA Practice Notes.
1
2
Very Good: free of defects, only planned and/or routine maintenance. Only Normal Maintenance Required
Good: minor defects, increasing maintenance required plus planned maintenance. Minor Maintenance Required.
Fair: defects requiring regular and/or significant maintenance to reinstate service. Significant Maintenance Required to Return to Acceptable Service Level.
Poor: significant defects, higher order cost intervention likely. Significant Renewal/Upgrade Required.
5
Very Poor: physically unsound and/or beyond rehabilitation, immediate action required. Asset / Component Requires Replacement.
Table 5 – Asset Condition Rating Guidelines
2.3 Lifecycle Management
Life Cycle Management is an essential component of any good asset management plan. This section of the TAMP identifies the processes required to effectively manage, maintain, renew and upgrade Council’s transport assets
Page 18 of 52
OFFICIAL-Sensitive
Condition Condition Score Description Good
Fair 3
Poor
4
4 Following completion of the visual detailed inspections, the bridge models can be updated
Transport Asset Management Plan 2022-2032
2.3.1 Operations & Maintenance Plan
Operations activities can be described as activities that are delivered on a day-to-day basis necessary to meet levels of service delivery requirements. Operational activities can include service delivery items such as street sweeping, scupper cleaning and verge mowing. Operational activities also include proactive and reactive inspections, undertaken by in-house technical staff and/or specialist contractors.
Over time, minor faults can occur within the transport portfolio. Council addresses the repairs and maintenance of these faults (i.e. pot-hole patching, crack sealing, trip hazards on paths) on the basis of defined intervention levels and response times. The intervention level defines the condition, state or risk level associated with an asset/component, i.e. the point in time at which the asset is considered to be below an acceptable level of service. Maintenance is scheduled as soon as the asset reaches this point.
Operations and maintenance activities do not improve the condition of assets, but rather enable the transport network to deliver its service levels as related to its transport function.
For the Levels of Service delivered on a day-to-day nature (i.e. responding to customer requests for maintenance faults and responding to localised asset failures), these intervention levels5 are currently documented in Council’s maintenance management system. At present, Council considers that these current operations and maintenance service levels meet the community’s needs and expectations.
The Improvement Plan identifies that Council will undertake a formal review of these operations and maintenance activities which will be formally documented in a Transport Service Framework
2.3.2 Renewal/Replacement Plan
Activities such as renewal, rehabilitation, reconstruction and replacement will return the degraded service of the asset back to its original condition. Renewal activities such as resurfacing of the road wearing surfaces, reconstruction of footpaths or
Page 19 of 52
OFFICIAL-Sensitive
5 Intervention level incorporates the Transport Service Area, activity or defect and response time to attendance or repair.
Transport Asset Management Plan 2022-2032
replacement of roundabouts or bollards, will return the degraded service capability of the asset back to its original designed capability or modern-day equivalent.
Renewal and replacement strategies are based on the most current asset condition rule base available to Council at the time of developing the forward works programs. The rule bases which reflect the policy decisions that Council will employ to determine when they will select transport assets for inclusion in their capital works program will be documented in a future improvement item for Transport Service Framework.
The built nature of new, upgrade and renewed transport assets will always be provided in accordance with Council’s design standards, relevant Australian Standards, industry guidelines and best practices
2.3.3 Upgrade/Expansion Plan
Upgrade and expansion works are associated with improving service levels beyond the original designed capability or modern-day equivalent. Additionally, expansion works include activities that extend the capacity of an existing asset, to provide higher levels of service and/or meet changes in asset resilience requirements. Upgrade/expansion is different to renewal/replacement which only improves the degraded service capability within the boundaries of the original designed capability.
Transport upgrades are usually undertaken where the transport has been identified as deficient with regards to providing its intended function such as being fit for use and fit for purpose. Council assesses the transport capability of catering for the current and near future user numbers and also assesses the ability to be adapted or reconfigured to provide for changing user needs and service requirements (such as a bridge originally designed for 20T load limit now requires a 60T passage or a footpath in a highly trafficked CBD requires shared path status widening to cater for both pedestrians and cyclists).
Typically upgrade/expansion works are identified from a combination of methods which include Councillor and/or community requests, project candidates identified via Strategic Plans, Master Plans or Studies and/or road safety audits.
Council utilises the following methodology framework to prioritise and schedule identified project candidates for the 10-Year Works Program.
Page 20 of 52
OFFICIAL-Sensitive
Transport Asset Management Plan 2022-2032
Works proposed are referenced in or support the Council Plan. 20%
Works proposed have been listed, endorsed or identified from Council’s Strategic Plans, Master Plans Studies and/or Road Safety Audits
Works proposed will enhance the quality of service to the community. 20%
Works proposed are required due to risk, legislative and/or to mitigate contractual risks. 20%
External funding provided or available and total lifecycle costs are considered to not adversely impact future budgets.
Presently, there are plans to spend approximately $70.67M6 over the following 10 years to upgrade Council’s transport assets and these have been documented in Council’s current 10-Year Works Program.
2.3.4 Creation/Acquisition Plan
New works are those works that create a new asset that did not previously exist. Council can acquire existing built assets or new assets from other authorities, developers or new assets via capital projects to meet community needs Typically, new transport asset candidates are identified from a combination of methods which include Councillor and/or community requests, project candidates identified via Strategic Plans, Master Plans or Studies and/or from road safety audits.
It is noted that there is significant infrastructure work currently being undertaken by the NSW Government within Inner West, which will include construction of new assets and modification of existing Council assets. The extent of these new and modified assets has not been quantified at present. Council will have further information once the projects are completed and Council is provided with ‘Works As Executed’ documentation.
6 The upgrade funding plan will be reviewed in conjunction with the next TAMP update in 2026. As new information becomes available on growth demand needs and asset lifecycle, these will be reflected in the 10-Year Funding Strategy.
Page 21 of 52
OFFICIAL-Sensitive
Criteria Weighting
20%
20%
Total 100%
Table 6 – Transport Priority Ranking Criteria
Transport Asset Management Plan 2022-2032
2.3.5 Disposal Plan
Disposal includes any activity associated with disposal of a decommissioned asset including sale, demolition, relocation or transfer of ownership.
Council is not expecting to dispose of any transport assets in the current term of this TAMP. There may however be partial disposals due to the large scale NSW Government projects.
2.4 Leadership and Accountability
Council’s Asset Management Policy adopted in 2022 defines the roles and responsibilities within Council for asset management
In addition, an Asset Management Steering Committee (AMSC) has been drawn from across Council administration to coordinate asset management related matters. Meetings are held regularly and chaired by the Engineering Services Manager. The development of an Asset Management Responsibility Assignment Matrix which details the organisational relationships and lines of responsibility regarding asset management over the asset lifecycle has been included in the Improvement Plan under Section 7
3 Levels of Service
3.1 Social Infrastructure Planning
Council provides over 100 services and our transport assets support the provision of several of these services such as vehicular access (roads), pedestrian thoroughfares (paths), travel across water bodies (bridges and over-pass) and active recreation (cycle paths and shared paths). A service centric approach starts with determining what services we need and then connecting assets to those services. It ensures that our assets are in the most appropriate locations for future community use, that they are functionally adequate for future demographics and take into account demand and Council’s vision. It also ensures that there is a clear prioritisation of capital and maintenance based on the criticality of the service and considers repurposing, redundancy or relocation of services when balancing future budgets.
In 2020, Council completed the Going Places - An Integrated Transport Strategy for Inner West (Transport Strategy). The Transport Strategy aims to address transport
Page 22 of 52
OFFICIAL-Sensitive
Transport Asset Management Plan 2022-2032
challenges currently facing Council and provide strategies and actions that move towards a transport future focusing on active and sustainable modes of transport, and land-use planning approaches to support these modes of transport.
The Transport Strategy, Master Plans and Studies and this TAMP are complementary documents that together set out Council’s service targets, and how these targets will be achieved. The role of each of these elements in the long-term asset planning is as follows:
• Asset Provision (Transport Strategy, Other Strategies, Masterplans and Studies) - Determining the type, location and creation of transport assets needed to service current and future demand; and
• Asset Performance (TAMP) - The required capital and maintenance performance standards for the assets Council provides that will ensure services are delivered at the desired levels
3.2 Customer Research and Expectations
Council undertakes customer surveys to understand and identify community priorities for the Inner West LGA and identify the community’s overall level of satisfaction The most recent customer satisfaction survey7, which was conducted in 2021 offers Council a long-term measure of how they are performing.
The results of the survey indicated that generally, the provision of traffic management and road safety, maintaining footpaths, access to public transport, and maintaining local roads are of importance to the community. The community is generally somewhat satisfied with the provision of these services.
Page 23 of 52
OFFICIAL-Sensitive
7 2021 Community Satisfaction Survey –
by Micromex Research July 2021
Figure 6 illustrates the satisfaction with Council’s overall performance between 2017 to 2021.
Conducted
Transport Asset Management Plan 2022-2032
Maintaining local roads (excluding major routes) Traffic
Maintaining footpaths
A score of 1 represents not at all satisfied, while a score of 5 represents very satisfied
The survey results identify that since 2017, community satisfaction has remained relatively the same which is on average somewhat satisfied with the current levels of service delivered by Council in these service areas. It is evident that the community want Council to continue to improve on its current service delivery and improve traffic management related issues
3.3 Strategic and Corporate Goals Alignment
This TAMP is prepared and aligned with Council’s vision, mission, goals and objectives and has been aligned to deliver cost-effective, transparent, realistic and affordable service levels in accordance with community expectations.
Relevant Council goals and objectives and how these are addressed in this TAMP are detailed in Table 7
Strategic Direction (SD) Outcome
SD1.1 – The people and infrastructure of Inner West contribute positively to the environment and tackling climate change.
Reduce urban heat and manage its impact.
Create spaces for growing food.
Develop planning controls to protect and support a sustainable environment.
How Goals and Objectives are addressed in TAMP
Environmentally sensitive design, renewal and asset acquisition criteria developed in future Service Frameworks. Incorporating climate factors into future strategic asset
Page 24 of 52
OFFICIAL-Sensitive
Figure 6 – Inner West Community Survey Satisfaction Overall Performance
2.74 2.92 2.83 3 2.97 3.07 3.17 3.19 3.16 3.18 3.29 3.27 3.08 3.17 3.18 0 1 2 3 4 5 2017 2018 2021
Management of parking Cycleways
management and road safety
Transport Asset Management Plan 2022-2032
Strategic Direction (SD) Outcome
Provide green infrastructure that supports increased ecosystem services.
How Goals and Objectives are addressed in TAMP
modelling to simulate climate impact analysis for decision making.
SD1.4 - Inner West is a zero emissions community that generates and owns clean energy
SD 1.5 – Inner West is a zero waste community with an active share economy
Support local adoption of clean renewable energy
Develop a transport network that runs on clean renewable energy.
Where possible, Council transport assets will be renewed and maintained with climate resilient treatments using clean energy treatments with the lowest carbon footprint
2.1 – Development is designed for sustainability and makes life better.
Support operations and maintenance to avoid waste, reuse, repair recycle and share transport treatment materials.
Provide local reuse and recycling infrastructure waste and byproducts
Pursue integrated planning and urban design across public and private spaces to suit the community and local environment needs.
Improve the quality and investigate better access and use of existing community assets.
Use of recycling with transport treatments such as concrete and asphalt repair, bridge components and street furniture recycling where possible.
The introduction of predictive modelling techniques will ensure that asset works programs are optimised as opposed to ad-hoc.
SD 2.5 – Public transport is reliable, accessible, connected and enjoyable
Advocate for improved public transport services to, through and around Inner West
Advocate for, and provide, transport infrastructure that aligns with population growth.
Provision of infrastructure that is fit for use and purpose, accessible, safe and well maintained.
Provision of 10-year capital improvement programs to reduce asset renewal gap and to ensure that assets are fit for the purpose they were intended for including demographic and population demands of the future.
SD 2.6 – People are walking, cycling and moving around Inner West with ease.
Deliver integrated networks and infrastructure for transport and active travel.
Pursue innovation in planning and providing new transport options
Establish the link between the TAMP and the Transport Strategy and other transport studies, masterplans and reports.
Page 25 of 52
OFFICIAL-Sensitive
Transport Asset Management Plan 2022-2032
Strategic Direction (SD) Outcome
Ensure transport infrastructure is safe, connected and well maintained
How Goals and Objectives are addressed in TAMP
Provision of shared paths that are fit for use and purpose, accessible, safe and well maintained.
Provision of integration between public transport, pedestrian and shared path transport to minimise the use of heavy vehicles.
Provision of 10-year capital improvement programs to reduce asset renewal gap and to ensure that assets are fit for the purpose they were intended for.
SD 5.1 – People are well informed and actively engaged in local decision making and problem solving
Support local democracy through transparent communication and inclusive participatory community engagement
3.4 Key Stakeholders
Through the scenario based planning in this TAMP, Council intends to engage with the community in deliberative engagement for active decision making.
Assets controlled by Council are utilised by a broad cross-section of the community. It is critical that assets are maintained and renewed based on need and fit for purpose. Asset users are key stakeholders of this TAMP
Table 8 identifies stakeholders where consultation is necessary when Council seeks input in relation to the determination of Levels of Service and intervention levels.
Stakeholder Group Role or Involvement Internal Stakeholders
Elected Council Custodian of the asset, with Councillors representing the residents and setting strategic direction as per the Corporate & Operational Plans.
Executive Team To ensure that the Asset Management policy and strategy are being implemented as adopted, and to ensure that long-term financial needs to sustain the assets for the services they deliver are advised to Council for its strategic & financial planning processes.
Page 26 of 52
OFFICIAL-Sensitive
Table 7 - Council’s Goals and how these are addressed in this Plan
Transport Asset Management Plan 2022-2032
Stakeholder Group Role or Involvement Managers of the various Transport assets
As the designated Strategic Custodian of Transport assets, responsible for the overall management of the assets from planning, design, maintenance, capital works and monitoring and updating the plan and ensuring its outcomes are realised to achieve the levels of service being required from utilisation of the assets;
Engineering Department
Maintaining Council’s asset registers and performing strategic predictive modelling analysis works to inform Council’s Long Term Financial Plans and Capital Works Program. Responsible for coordinating the development and implementation of asset management processes and frameworks within the Council.
Finance Department
Ensuring that the asset valuations are accurate. Development of supporting policies such as capitalisation and depreciation. Preparation of asset sustainability and financial reports incorporating asset depreciation in compliance with current Australian accounting standards, AM, GIS support and admin.
Maintenance Department (Internal)
Information Technology Managers
Risk Managers
To ensure provision of the required/agreed level of maintenance services for asset components
To ensure that the relevant IT systems are functioning and that any data within the systems are secure, and its integrity is not compromised.
To ensure that risk management practices are conducted as per Council policy and assist operations managers with advice on risk issues.
Internal Auditors To ensure that appropriate policy practices are carried out and to advise and assist in improvements
External Stakeholders
Community General users of the various facilities.
Community User Groups Users of transport network that have been dedicated to the provision of a specific service (e.g. Cyclists, Heavy vehicles and local groups).
Maintenance Personnel (contractors)
Utility Service Providers
State & Federal Government Depts
To ensure provision of the required/agreed level of maintenance services for asset components.
Agencies that provide utility services such as electricity, gas, water, sewerage and telecommunications necessary to facilitate services and typically constructed/located within the road reserve
Periodic provision of advice, instruction and support funding to assist with management of the transport network.
Council’s Insurer Insurance and risk management issues.
Table 8 – Key Stakeholders
Page 27 of 52
OFFICIAL-Sensitive
Transport Asset Management Plan 2022-2032
3.5 Legislative Requirements
There are many legislative requirements relating to the management of Council assets. Legislative requirements that impact the delivery of Council transport services include:
Legislation
Local Government Act 1993
Requirement
Sets out the role, purpose, responsibilities and powers of local governments. The purposes of this Act are as follows:
(a) to provide the legal framework for an effective, efficient, environmentally responsible and open system of local government in New South Wales,
(b) to regulate the relationships between the people and bodies comprising the system of local government in New South Wales,
(c) to encourage and assist the effective participation of local communities in the affairs of local government,
(d) to give councils:
• the ability to provide goods, services and facilities, and to carry out activities, appropriate to the current and future needs of local communities and the wider public
• the responsibility for administering some regulatory systems under this Act
• a role in the management, improvement and development of the resources of their areas,
(e) to require councils, councillors and council employees to have regard to the principles of ecologically sustainable development in carrying out their responsibilities.
The land management provisions of the Act require that Council prepare plans of management for all community land. The plan of management identifies the management objectives for the land category, performance indicators and performance measures to meet the objectives identified.
IP&R Local Government Amendment (Planning and Reporting) Act 2009
Local Government Act –Annual Reporting Section 428(2)(d)
Local Government Amendment (Planning and Reporting) Act 2009 includes the preparation of a long term financial plan supported by asset management plans for sustainable service delivery.
A report of the condition of the public works (including public transport, public roads and water sewerage and drainage works) under the control of Council as at the end of that year; together with
• An estimate (at current values) of the amount of money required to bring the works up to a satisfactory standard; and
• An estimate (at current values) of the annual expense of maintaining the works at that standard; and
• The Council’s programme for maintenance for that year in respect of the works.
Page 28 of 52
OFFICIAL-Sensitive
Transport Asset Management Plan 2022-2032
Legislation Requirement
Road Transport (Safety and Traffic Management) Act 1999
Facilitates the adoption of nationally consistent road rules in NSW, the Australian Road Rules. It also makes provision for safety and traffic management on roads and road related areas including alcohol and other drug use, speeding and other dangerous driving, traffic control devices and vehicle safety accidents.
Roads Act 1993
Sets out rights of members of the public to pass along public roads, establishes procedures for opening and closing a public road, and provides for the classification of roads. It also provides for declaration of the RTA and other public authorities as roads authorities for both classified and unclassified roads, and confers certain functions (in particular, the function of carrying out roadwork) on the RTA and other roads authorities. Finally it provides for distribution of functions conferred by this Act between the RTA and other roads authorities, and regulates the carrying out of various activities on public roads.
Local Government (Highways) Act
1982
Disability Discriminations Act, 1992
Work Health & Safety Act 2011
An Act to consolidate with amendments certain enactments concerning the functions of the corporations of municipalities with respect to highways and certain other ways and places open to the public.
The Disability Act establishes a framework for providing support and services to people with disabilities throughout New South Wales.
Sets out roles and responsibilities to secure the health, safety and welfare of persons at work and covering injury management, emphasising rehabilitation of workers particularly for return to work. Council is to provide a safe working environment and supply equipment to ensure safety.
Environmental Planning and Assessment Act 1979
An Act to institute a system of environmental planning and assessment for the State of New South Wales. Among other requirements the Act outlines the requirement for the preparation of Local Environmental Plans (LEP), Development Control Plans (DCP), Environmental Impact Assessments (EIA) and Environmental Impact Statements.
Environmental Protection Act 1994
Public Works and Procurement Act 1912
Inner West Development Control Plans
This act sets out requirements with respect to environmental protection.
Sets out the role of Council in the planning and construction of new assets.
The primary purpose of a Development Control Plan (DCP) is to guide development according to the aims of the corresponding Local Environmental Plan (LEP).
Page 29 of 52
OFFICIAL-Sensitive
Transport Asset Management Plan 2022-2032
Legislation Requirement
Inner West Local Environmental Plan 2020
The LEP is a legal document that provides controls and guidelines for development in an area. It determines what can be built, where it can be built, and what activities can occur on land.
Plant Protection Act 1989 This act sets out requirements with respect to Flora Protection.
Threatened Species Conservation Act, 1995
Fire and Rescue Service Act 1990
An Act to conserve threatened species, populations and ecological communities of animals and plants.
Under the terms of this Act Council is required to ensure the long term survival of the species identified.
This act sets out requirements with respect to Emergency Services for Fire and Rescue
Public Records Act 2002 This act sets out requirements with respect to maintaining Public Records.
Civil Liability Act, 2002
Rural Fires Act, 1997
An Act to make provision in relation to the recovery of damages for death or personal injury caused by the fault of a person
An Act to establish the NSW Rural Fire Service and define its functions; to make provision for the prevention, mitigation and suppression of rural fires.
Under the terms of this Act Council is required to mitigate any fire that emanates from bushland.
Regulations, Standards & Guideline requirements that impact the delivery of Council’s transport services are outlined below.
Regulation / Standard / Guide Requirement
Integrated Planning and Reporting (IP&R) framework
All councils in NSW are required to work within the IP&R framework to guide their planning and reporting activities.
IP&R provides a pathway for elected representatives to:
• work directly with their community to identify long-term priorities for local identity, growth and lifestyle;
• understand the range of services the community wants, the service standards they expect and the infrastructure that will be required;
• report to the community on their success in achieving these goals; and
• be assured that their council is meeting planning, consulting and reporting requirements under other laws.
Environmental Planning and Assessment Regulation 2000
Fire safety systems are required in commercial, industrial & public transport to ensure the safety of occupants in the event of a fire or emergency.
Page 30 of 52
OFFICIAL-Sensitive
Table 9: Legislation Relevant to Management of Transport Assets
Transport Asset Management Plan 2022-2032
Regulation / Standard / Guide Requirement
The Act includes provisions relating to fire safety and matters concerning the Transport Code of Australia (Part 9).
ISO 55000 Suite, 2014 The International Organization for Standardization's ISO 55000:2014 Asset Management (ISO 55000) provides a global guide to better practice in asset management, including asset information management.
ISO 55000 specifies that entities should align information requirements to asset management needs and risks, along with requirements for collecting, managing, evaluating, and ensuring consistency and availability of information for asset management decision-making.
Australian Accounting Standards Board (AASB)
Provides direction and guidance on the financial and reporting expectations of entities, to ensure a consistent approach to accounting records. The following regulations apply to Council:
AASB 116 Transport, Plant & Equipment – prescribes requirements for recognition and depreciation of Transport, plant and equipment assets.
AASB 136 Impairment of Assets – aims to ensure that assets are carried at amounts that are not more than their recoverable amounts.
AASB 1021 Depreciation of Non-Current Assets – specifies how depreciation is to be calculated.
AAS 1001 Accounting Policies – specifies the policies that an organisation is to have for recognition of assets and depreciation.
AASB 1041 Accounting for the reduction of Non-Current Assets –specifies the frequency and basis of calculating depreciation and revaluation basis used for assets; and
AAS 1015 Accounting for the acquisition of assets – method of allocating the value to new assets on acquisition.
All other relevant Australian Standards
All Local Laws and relevant policies of the Organisation
International Infrastructure Management Manual, Sixth Edition, IPWEA, V6.0, 2020
AS/NZ Standards such as AustRoads, Risk Management Standard.
Construction standards, Maintenance contracts, etc.
The IIMM has been developed with public and private sector industry input from Australia, New Zealand, the United States Canada, South Africa and the United Kingdom to promote best asset management practice for all infrastructure assets.
Page 31 of 52
OFFICIAL-Sensitive
Table 10: Regulations & Standards Relevant to Management of Transport Assets
Transport Asset Management Plan 2022-2032
The following is a summary of policies relevant to this asset class. Many of these policies are available from Council.
Policy Requirement
Infrastructure, Plant, Property and Equipment Determination Protocol 2019
Asset Management Policy 2022
To define Inner West Council’s asset classes and associated methodologies in capturing and recording asset related information, guided by relevant accounting and industry standards as well as legislation.
The Policy acknowledges Council’s commitment to asset management and provides a consistent asset management approach with clear principles and guidelines in order to manage Council’s assets for the current and future community. It establishes a framework to ensure a structured, coordinated, cost effective and financially sustainable approach to asset management across the organisation.
3.6 Level of Service
It is considered that this TAMP has improved the level of sophistication in the documentation of the levels of service that will be delivered by Council’s transport assets. The levels of service delivered by Council’s transport assets have been documented considering the expectations of Council’s residents/customers. This has required a clear understanding of customer needs, expectations and preferences that will be explored in this Section and continually reviewed and updated as required in future TAMP iterations.
The levels of service defined are intended:
• to inform customers and Council of the proposed type and level of service to be offered.
• to enable customers and Council to assess suitability, affordability and equity of the services offered.
• to measure the effectiveness of the services provided by Council.
• to identify the costs and benefits of the services offered.
Council has defined two tiers of levels of service, which are based on:
Community Levels of Service – what Council expects to provide in terms of key customer outcomes based on perceptions of expected quality and future financial allocations:
Page 32 of 52
OFFICIAL-Sensitive
Table 11: Policies Relevant to Management of Transport Assets
Transport Asset Management Plan 2022-2032
• Appropriateness of service.
• Accessibility to users 24 hours a day, 7 days a week.
• Affordability – acknowledging that Council can only deliver what it can afford.
• Relevance of the service being provided – in terms of demand characteristics, future demographics, current backlogs and where the pressure points are.
Technical Levels of Service – which relates to the outputs the customer receives:
• What Council will do in real terms, i.e. reliability, functionality and adequacy of the services provided. Typically, this TAMP has documented Council’s standards – i.e. at what point will Council repair, renew or upgrade to meet the customer outcomes listed in the strategic levels.
• Technical Levels of Service have been defined for each of the following:
o New Asset – If Council provides new Transport assets, then what design and maintainability standards shall apply to make them meet Council’s strategic outcomes.
o Upgraded or Reconstructed Asset to original standard - If Council upgrades or reconstructs Transport assets, what design and maintainability standards shall apply to make them meet Council’s strategic outcomes.
o Maintenance – When will Council intervene with a maintenance repair and what will be Council’s responsiveness in terms of customer requests for maintenance faults.
The levels of service that have been adopted are considered reasonable as demonstrated by industry standards and benchmarks.
3.6.1 Customer Levels of Service
Council’s Customer Levels of Service that have been adopted for this TAMP are detailed as follows:
Page 33 of 52
OFFICIAL-Sensitive
Key Performance Measure Level of Service Performance Measure 2021 Performance COMMUNITY LEVELS OF SERVICE Customer Satisfaction Transport assets meet community needs >3.5 community survey satisfaction score 2.83 – Management of Parking 3.07 – Cycleways
Transport Asset Management Plan 2022-2032
Environment A commitment to continually improve environmental efficiencies, reduce dependence on foreign oil and fossil fuels that emits greenhouse gases and promote sustainability
3.6.2 Technical Levels of Service
Use of environmentally resilient materials in asset build, maintenance and renewal to be 50% of total annual spend.
Data to be collected.
Supporting the community service levels are technical measures of performance.
As Council is responsible for a large number and range of transport asset types it has been determined that different standards are necessary for different transport functions. For example, the service provided by a local road would be lower than that provided by a regional road. Each of the transport assets within Council’s transport
Page 34 of 52
OFFICIAL-Sensitive Key Performance Measure Level of Service Performance Measure 2021 Performance 3.16 – Maintaining Local Roads 3.27 – Traffic Management and Road Safety 3.18 – Maintaining Footpaths Quality Well maintained and suitable Transport networks <1,500 requests / complaints per annum for sealed road maintenance 1,367 <1,500 requests / complaints per annum for footpath maintenance 1,410 <500 requests / complaints per annum for kerb & gutter maintenance 245 <500 requests / complaints per annum for road furniture maintenance 145
Table 12 - Customer Levels of Service
Transport Asset Management Plan 2022-2032
portfolio has been assigned to one of these five categories as documented in Table 18 - Asset Criticality / Hierarchy for Transport Assets
Technical service measures are linked to annual budgets covering operations, maintenance, renewal and upgrade activities as defined in the Lifecycle Management Section.
Page 35 of 52
OFFICIAL-Sensitive
Key Performance Measure Level of Service Performance Measure 2021 Performance TECHNICAL LEVELS OF SERVICE Condition Regional Roads - Condition assessment of Sealed Road & Kerb network every 3-4 years Average network condition <= 2.5 out of 5 and with < 5% of stock in condition state 5. 3.2 0.5% Local Roads - Condition assessment of Sealed Road & Kerb network every 3-4 years Average network condition <= 3 out of 5 and with < 10% of stock in condition state 5. 2.95 20% Carparks - Condition assessment of Sealed Road & Kerb network every 3-4 years Average network condition <= 3 out of 5 and with < 5% of stock in condition state 5. 2.4 2.2% Kerb & Gutter - Condition assessment of kerb network every 3-4 years Average network condition <= 3 out of 5 and with < 5% of stock in condition state 5. 2.7 <0.5% Footpaths - Condition assessment of Footpath network every 3-4 years Average network condition <= 3 out of 5 and with < 5% of stock in condition state 5. 2.7 1.1% Bridges - Condition assessment of Bridge network every 3-4 years Average network condition <= 3 out of 5 and with < 5% of stock in condition state 5. 2.4 1.5% Traffic Management Devices - Condition assessment of Traffic Management Device network every 3-4 years Average network condition <= 3 out of 5 and with < 5% of stock in condition state 5. 1.9 <1% Retaining Walls - Street Furniture - Condition assessment of Street Furniture network every 3-4 years Average network condition <= 3 out of 5 and with < 5% of stock in condition state 5. 1.9 0% Street Furniture All OtherCondition assessment of Average network condition <= 3.5 out of 5 and with < 1.5 <0.5%
Transport Asset Management Plan 2022-2032
4 Future Demand
This section identifies the effect of expected growth and consequent demand on Council’s transport asset infrastructure. Forecasting future demand is essential in determining lifecycle management for assets. The management of transport assets is directly affected both by growth in the number of assets and growth in the resident population as well as visiting populations.
4.1 Demand Drivers
Drivers affecting transport assets demand include factors such as population change, changes in demographics, technological changes and environmental changes. Transport assets within the municipality must serve both the local resident population needs as well as business industries, tourism, commuter and visitor needs.
4.2 Demand Forecasts
The present position and projection for demand drivers due to population growth that may impact future service delivery and utilization of assets are identified and documented in Table 14 - Demand Factors, Projections and Impact on Services
Demand Factor
Present position
Projection
Page 36 of 52
OFFICIAL-Sensitive Key Performance Measure Level of Service Performance Measure 2021 Performance Street Furniture network every 3-4 years 10% of stock in condition state 5. Table 13 - Technical Levels of Service
Transport Asset Management Plan 2022-2032
Population Growth The Inner West Council population forecast for 2022 is 207,294 and is forecast to grow to 247,881 by 2041, resulting in a 19.58% population increase.
Source: Population and household forecasts, 2016 to 2041, prepared by Forecast.Id, December 2020.
Table 14 - Demand Factors, Projections and Impact on Services
With regards to transport infrastructure assets, population changes are not the only factors which will affect demand. The living and working habits of residents who reside and/or work in a well urbanised council area, will also greatly influence the demand for services.
The majority of Inner West residents work within close proximity to their place of residence, with 31.3% who live and work in the area, while 68.7% work in the area, but live outside8
Analysis9 of car ownership indicates that 28% of households in Inner West Council area had access to two or more motor vehicles, compared to 46% in Greater Sydney and that 45.7% of households had access to 1 motor vehicle compared to 35.4% in Greater Sydney 16.3% of households did not own a car.
When assessing10 the method of travel to work, the most recent survey indicates that there were 37,798 people who caught public transport to work (train, bus, tram or ferry)
Page 37 of 52
OFFICIAL-Sensitive
https://profile.id.com.au/inner-west/workers 2016
https://profile.id.com.au/inner-west/car-ownership 2016 10 https://profile.id.com.au/inner-west/travel-to-work 2016 203,693 221,200 230,743 239,894 247,881 8.6% 4.3% 4.0% 3.3% 0.00% 1.00% 2.00% 3.00% 4.00% 5.00% 6.00% 7.00% 8.00% 9.00% 10.00% 0 50,000 100,000 150,000 200,000 250,000 300,000 2021 2026 2031 2036 2041 Inner West Council Estimated Population Growth Population Percentage increase
8
9
Transport Asset Management Plan 2022-2032
in the Inner West Council area, compared with 39,405 who drove in private vehicles (car – as driver, car – as passenger, motorbike, or truck).
Analysis of the method of travel to work of the residents in the Inner West Council area, compared to Greater Sydney, shows that 38.0% used public transport, while 38.0% used a private vehicle, compared with 22.7% and 56.6% respectively in Greater Sydney.
The emerging needs of the population growth suggests that demand for transport assets will need to cater for demand drivers over the following 10 years as illustrated in Table 15.
Demand Driver Impact on Services
Increase of population and population density at a rate of approximately 1.7% per annum over the following 5 years, reducing to 0.8% per annum thereafter until 2031
The expected growth in population, business and commerce has a direct impact on the demand for services and ultimately the number and size of assets to support those services.
The road system will remain the key element of the region’s transport system. While growth in car usage will be moderated, roads will continue to be needed for the region’s ongoing development, and freight demands are expected to increase. Additional congestion on the road network is likely, which in turn means that much of the road network will need to cater for increased vehicle loads which in turn affect the road's useful life
Aging Population Changing service needs and changing transport requirements, particularly relating to accessible parking and fit for purpose pathways to cater for motorised scooters.
Growing number of families in the area. Increase the need for shared paths and integrated transport options
Increasing Car Ownership
Increased pressure on road capacity, street parking and the demand for additional traffic devices. Increase in travel outside peaks.
Climate change will see an increased risk of extreme weather events including storm events, heatwave, flooding, sea-level rise and fire events.
There will be an increase in structural damage caused by extreme events and an increase in deterioration rates of transport assets. This will be particularly evident with increased rainfall events where water ingress is evident with the road
Page 38 of 52
OFFICIAL-Sensitive
Transport Asset Management Plan 2022-2032
Demand Driver Impact on Services
pavement and which will lead to advanced deterioration.
Introducing climate risk assessments and shifting to climate resilient treatments will determine the impact on transport performance and useful lives
Sustainability
Introducing new sustainability technology when renewing and upgrading roads, bridges, footpaths and street furniture items will ensure that ratepayers’ dollars go further meaning the cost savings can be put towards improving additional features on integrating the network
Table 15 – Demand Drivers, Projections and Impacts on Services
4.3 Changes in Technology
Council is continuously monitoring new asset treatments that may be available to increase the life of its assets. Table 16 details technology changes that are forecasted to affect the delivery of services covered by this plan.
Technology Change Effect on Service Delivery
Road wearing surface quality
Bitumen manufacturers are constantly developing new products to suit modern day applications and to cope with increased traffic volumes and changing environmental conditions. These improvements may mean roads have a longer useful life and require less maintenance. The use of products such as warm asphalt mixes will also have the benefit of reduced environmental impact.
Recycled materials
By exploring options to use recycled materials, there will be a benefit in terms of reduction in greenhouse gas emissions and reliance on our natural resources.
Trenchless technology
Trenchless methodologies will have a positive impact on Council’s assets, as the integrity of the road or pathway is not compromised when installing/replacing services within the road reserve.
Low energy design
Increased efficiencies of low energy design on traffic calming and street furniture assets therefore certain new transport designs for example lights can incorporate energy efficient and sustainable practices.
Page 39 of 52
OFFICIAL-Sensitive
Transport Asset Management Plan 2022-2032
Technology Change Effect on Service Delivery
Asset Information System
Improved information systems for mapping, recording information and managing assets. Adjustment of the transport inspection regime to match the amount of public usage and deterioration on certain components for example high priority paths and roads.
These technological factors need to be assessed in determining the scoping requirements for maintenance works, renewal, upgrade and new transport projects. There will be changes to asset management technology, in particular the monitoring and data collection roles. These upgrades in technology may require consideration of modifications to service levels as and when appropriate.
4.4 New Assets from Growth
At present, the road network is well established within Council. There are limited opportunities available with regards to the construction of new roads.
Council envisages that over the following 10 years, it will acquire either by direct construction or via donation from State Government or private developers, new assets such as footpaths, traffic management devices and street furniture to meet demand needs, however, these have yet to be quantified and will be reflected in future TAMP revisions as details become available.
As additional information becomes available with regards to new growth and development areas, Council will continue to identify the community’s transport needs via the Transport Strategy, other strategies, studies and masterplans and these will be included in future revisions of this TAMP
It is important to note that when new assets are acquired, or assets are expanded or upgraded, this results in an increase in commitment of annual operational and maintenance funding to ensure continued service delivery of the asset over its lifecycle.
4.5 Demand Management Plan
The demand for transport assets at Council is not expected to increase proportionally with the predicted population growth and predicted demographic changes unlike
Page 40 of 52
OFFICIAL-Sensitive
Table 16 – Changes in Technology and Forecast on Service Delivery
Transport Asset Management Plan 2022-2032
facilities or open space. This is also in line with the future strategies outlined in Council’s vision and corporate plan to shift towards lesser reliance on road transport and highly integrated cycle and pedestrian connectivity.
Demand for new services will be managed through a combination of managing existing assets, upgrading existing assets and providing new assets to meet demand and demand management. Demand management practices include non-asset solutions, insuring against risks and managing failures. Opportunities identified to date for demand management are shown in Table 17. Further opportunities will be developed in future revisions of this TAMP.
Service Activity Demand Management Plan
Increase in demand for all services
• Network analysis and modelling of identified high traffic areas. Perform analysis and modelling to determine impacts on the current network. Results incorporated into Forward Capital Works Five-Year Program prioritisation criteria.
• Promote and develop public and alternative transport options around residential and commercial areas
• Encourage sharing of existing transport methods and the use of public transport to maximise the utilisation allows planning for optimum use of all transport modes.
• Review existing road and footpath networks to ensure continuing suitability.
• Regularly review the Strategies and Plans such as the Transport Strategy to identify areas and assess needs.
• Document a Social Infrastructure Plan framework that will drive future Transport Strategy reviews.
Improved access to services required
• Upgrade existing transport access over time and ensure new or upgraded transport modes are Disability Discrimination Act compliant, particularly pram ramps, access ways, rest areas and steps.
Increased need for maintenance and renewal costs
• Review and document levels of services after consultation with the Service Managers and the community.
• Incorporate total asset lifecycle costings into asset management.
• Procure large services contracts to get better economies of scale to minimise costs.
Changing service needs and changing transport requirements, particularly relating to accessibility.
• Plan new projects to incorporate best practice and review compliance and accessibility needs for existing sites. Prioritise upgrade projects which have the most positive impact.
Page 41 of 52
OFFICIAL-Sensitive
Transport Asset Management Plan 2022-2032
Service Activity
Community expectations
Increased need for maintenance and renewal costs
Providing a safe network
Demand Management Plan
• Monitor community expectations through annual and targeted community surveys or deliberative engagement
• Review and document levels of services after consultation with the Service Managers and the community.
• Incorporate total asset lifecycle costings into asset management.
• Continue traffic management initiatives and processes to address high-risk intersections and other locations in the road and pathways network.
5 Risk Management Planning
5.1 Asset Criticality / Hierarchy
To manage Council’s transport assets more effectively, they have been categorised based on the level of importance and criticality. The hierarchy approach recognises that different transport assets provide different levels of service, and is a useful approach to ensure different needs (e.g. for users of regional roads compared to local roads) are met efficiently.
The Transport hierarchy adopted by Council takes into account the varying risk and service levels associated with the transport asset portfolio and is summarised in Table 18 as follows:
Roads, Kerbs, Carparks, Traffic Management Devices and Street
Furniture
Regional
• For car and truck movements on roads designated as part of the Regional road network. Roads significant to the Region Includes all assets located within the road reserve.
Local
• For movement of cars and trucks in urban areas, from higher hierarchies for access to residences or businesses within the municipality Includes all assets located within the road reserve.
Laneway
Bridges Road
• Provides access and secondary access to local residences and properties. Includes all assets located within the road reserve.
• Bridge used exclusively for vehicles.
Page 42 of 52
OFFICIAL-Sensitive
Table 17 - Demand Management Plan Summary
Type Criticality / Hierarchy Description
Asset
Transport Asset Management Plan 2022-2032
Asset Type Criticality / Hierarchy Description
Pedestrian • Bridge used exclusively for pedestrians or cycling.
Footpaths High Use
• Footpaths serving the retail and commercial areas of urban town centres and footpaths that serve other medium density pedestrian attractors.
Medium Use
• Footpaths and shared paths in urban areas linking to railway stations, bus stops, schools, commercial or community facilities or other pedestrian generators. Includes footpaths serving Council’s corporate buildings.
Low Use
5.2 Risk Management Plan
• Footpaths providing access within residential areas or paths in rural areas and townships.
Council has identified the need to develop a corporate Risk Management Policy which will set the overall framework for addressing risk within the context of International Standard ISO31000-2018, Risk management – Principles and Guidelines
Risk Management is defined in ISO31000:2018 as: ‘coordinated activities to direct and control with regard to risk’.
The development and adoption of this Policy will outline Council’s commitment to manage its resources and responsibilities in a manner which is intended to minimise harm or loss. The elements of this framework are illustrated in Figure 7.
Page 43 of 52
OFFICIAL-Sensitive
Table 18 - Asset Criticality / Hierarchy for Transport Assets
Transport Asset Management Plan 2022-2032
5.3 Risks Assessment
Council has developed a level of asset criticality, giving higher importance to risk assessment and the appropriate levels of inspection and maintenance for each classification.
Critical assets are those which have a high consequence of failure causing significant loss or reduction of service. Similarly, critical failure modes are those which have the highest consequences. By identifying critical assets and failure modes, investigative activities, condition inspection programs, maintenance and capital expenditure plans can be targeted at the critical areas. Activities may include items such as increased inspection frequency and higher maintenance intervention levels
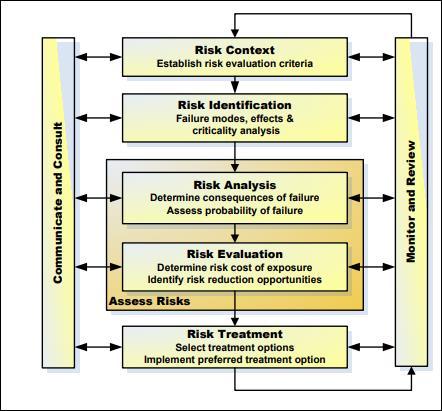
5.3.1 Risk Plan
As a result of this TAMP revision, an assessment of risks associated with service delivery from Council’s transport assets has identified the critical risks that will result in significant loss, ‘financial shock‘ or a reduction in service.
Page 44 of 52
OFFICIAL-Sensitive
Figure 7 – Risk Management Process, Source: ISO31000:2018
Transport Asset Management Plan 2022-2032
Critical risks are those assessed with ‘Very High’ (requiring immediate corrective action) and ‘High’ (requiring corrective action) risk ratings identified in the Infrastructure Risk Management Plan. The residual risk and treatment cost after the selected treatment plan are implemented is shown in Table 19
Service or Asset at Risk What can Happen Risk Rating Risk Treatment Plan Residual Risk Treatment / Costs
Bridges Structural deterioration due to increased mass limits.
Retaining Walls Structural deterioration / collapse.
Footpaths Trip hazards
High Monitor and undertake loading assessments of all road bridge structures.
High Continue with cyclic visual inspections every 4-5 years
Medium Continue with cyclic visual inspections every 4-5 years. Introduce proactive annual inspections on high risk pathways.
6 Financial Summary
Medium Ongoing staff time and new budget.
Medium Ongoing staff time and existing budget.
Low Ongoing staff time and existing budget.
The provision of adequate financial resources ensures that Council’s transport assets are appropriately managed and preserved. Financial provisions below requirements impact directly on community development and if prolonged, results in substantial needs for “catch up” expenditure imposed on the community in the future. Additionally, deferred renewal results in increased and escalating reactive maintenance as aged assets deteriorate at increasing rates.
6.1 Forecasted Funding Requirements
The objective of this Section has been to model the deterioration of Council’s transport assets portfolio, by developing a simulation model using the Brightly Software Predictor© modelling software.
This process typically involves setting up life cycle paths for each transport asset / component, along with their inspected condition, identifying the appropriate treatments and unit rates to deliver these treatments and configuring the treatment
Page 45 of 52
OFFICIAL-Sensitive
Table 19 – Critical Risks and Treatment Plan
Transport Asset Management Plan 2022-2032
rule base (matrices based on selected condition criteria that when matching will drive a treatment based on the condition).
By utilising the above process and setting up the criteria and logic within the predictive modelling software, it is possible to model the future costs of Council’s transport asset portfolio renewal requirements and to predict the future condition of these assets under varying funding scenarios
6.2 Funding Scenarios
The 2022 strategic modelling analysis predicts the deterioration of Council’s transport asset portfolio by calculating the results of different funding options, utilising a core dataset that is current as at 2022. The length of time predicted for each funding option is for a period of 10 years until the year 2032
Financial Option Description
Option 1
This funding option models the impact on condition and associated service levels of transportation assets, if Council were to fund the current proposed capital works financial allocation over the following 10 years. Note that this funding option only assesses renewal funding needs and excludes upgrade works identified via plans/studies.
Option 2
This funding option identifies and models the current transportation asset portfolio at the necessary funding levels each year to maintain current levels of service at the end of 10 years. Note that this funding option only assesses renewal funding needs and excludes upgrade works identified via plans/studies.
The net strategy comparison outcomes of the financial options that have been modelled are detailed in Table 21
11
11
Page 46 of 52
OFFICIAL-Sensitive
Table 20 – Predictive Modelling Funding Options
Financial Option Treatment Cost ($,000)
Backlog Value ($,000) Change in Backlog Value ($,000) Net Strategy Cost ($,000) Final OSI Option 1 $134.9M $7.34M -$22.19M $112.7M 2.2 Option 2 $140.4M $3.6M -$25.93M $114.5M 2.0
Table 21 – Predictive Modelling Renewal Funding Options - Net Strategy Comparison
The current capital works list of project candidates is currently being reviewed and revised by Council officers. It is envisaged that once new condition data is collected in 2023/2024, that the strategic models will be re-run and calibrated.
Transport Asset Management Plan 2022-2032
6.3 Forecast 10-Year Capital Renewal Funding12
Renewal funding at current levels detailed in the current LTFP (Option 1) will result in Council delivering current levels of service into the future when looking at the average network condition. The model also predicts that there will be a significant $22.19M decrease in assets considered to be in backlog (rated as condition state 5).
The funding strategy (Option 2) predicts that by spending an additional $5.5M over the following 10-years in conjunction with redistributing renewal spending from other major transport asset types to assets such as traffic management devices and street furniture, that this funding option will not only maintain existing average condition into the future but will also reduce the current asset backlog by $25.93M. The average condition is predicted to be like current levels (2.0 in 2032 compared to 2.0 in 2022)
The preferred renewal funding option for this TAMP is Option 2, however maintaining current funding levels (Option 1), is considered adequate to maintain current conditions over the following 10-years. Future TAMP revisions should review the distribution of renewal funding across the transport asset types to ensure that adequate funding is allocated to non-major transport asset types such as street furniture and traffic management devices.
Page 47 of 52
OFFICIAL-Sensitive
Figure 8 – Forecast 10-Year Capital Renewal Funding Analysis and Average Condition by Year
1.00 1.50 2.00 2.50 3.00 3.50 4.00 4.50 5.00 $0 $5,000 $10,000 $15,000 $20,000 $25,000 1 2 3 4 5 6 7 8 9 10 Service State Cost Thousands Year
12 This funding plan will be reviewed in conjunction with the next TAMP update in 2026. As new information becomes available on transport project needs from the Service providers, growth demand needs and asset lifecycle, these will be reflected in the 10-Year Funding Strategy.
Option 1 - Current Funding Allocation Option 2 - Maintain LoS
Transport Asset Management Plan 2022-2032
There are a number of studies and investigations being undertaken which may identify additional funding needs to acquire new and upgrade existing transport assets to meet required service levels over the following 10 years. The Plan will be progressively updated when this information comes to hand.
6.4 Financial Ratios
Asset management ratios provide insight into an organisation’s performance and success in managing its assets. Council’s asset management ratios for its asset portfolio calculated as at 30 June 2021 are shown in Table 22 – Key Asset Management Ratios
Funded
capital expenditure
Page 48 of 52
OFFICIAL-Sensitive 2022-23 ($,000) 2023-24 ($,000) 2024-25 ($,000) 2025-26 ($,000) 2026-27 ($,000) 2027-28 ($,000) 2028-29 ($,000) 2029-30 ($,000) 2030-31 ($,000) 2031-32 ($,000) New/Upgrade 9,540 16,750 10,715 7,990 4,280 4,280 4,280 4,280 4,280 4,280 Renewal 20,697 16,669 13,895 12,470 12,100 12,100 12,100 12,600 12,600 12,600 Total Capital 30,237 33,419 24,610 20,460 16,380 16,380 16,380 16,880 16,880 16,880 Maintenance & Operational 19,689 19,957 20,335 20,710 21,103 21,508 21,922 22,348 22,785 22,785
Figure 9 – Forecast 10-Year Capital Funding Analysis and Average Condition by Year
Ratio Description Calculation Target 2021 Performance Asset
Renewal Funding Ratio
The extent with regards to how the organisation is funding their capital works program when comparing allocated capital works expenditure with the desired expenditure which has been derived from prediction modelling and/or service level agreements. >75% 100%
on renewals divided by the planned/desired capital expenditure.
Transport Asset Management Plan 2022-2032
The overall health of the organisation’s asset stock in terms of measuring past asset consumption, via the amount of accumulated depreciation. The lower this ratio is, the more the asset stock has been consumed, which also indicates that not enough capital expenditure has been allocated to the asset.
Measures the level of maintenance funding spent per annum, as a % of asset replacement value on the asset portfolio.
7 Plan Improvement and Monitoring
This section outlines how Council will measure its asset management performance. The identified action items in Table 24 will enable Council to improve its asset management capability, enhance asset value and deliver more for stakeholders while balancing cost, risk and performance.
7.1 Assumptions
The key assumptions made in this TAMP and risks that these may change are shown below.
Key Assumption
Transport asset conditions reflect the assets' current condition as at 2022.
Risk of Change to Assumption / Impact to Model
Very Low (data is 2022 and based on IPWEA Practice Notes)
Page 49 of 52
OFFICIAL-Sensitive Ratio Description Calculation Target 2021 Performance Remaining Service Index Ratio
Written down value (fair value of the portfolio) divided by the total current replacement value. >70% 78.8% Overall 87.2% Roads 91.1% Carparks 62.3% Kerb & Gutter 62.6% Footpath 79% TMD 84.7% Street Furniture 63.2% Bridges Maintenanc e Sustainabili ty Ratio
Total maintenance funding per annum / Total Replacement Value expressed as a percentage. 2-5% 1.5%
Table 22 – Key Asset Management Ratios
Transport Asset Management Plan 2022-2032
Key Assumption
The allocation of renewal funds has been based on the asset replacement costs developed as part of the valuations in June 2022
Maintenance funding levels will be progressively increased to represent as a minimum, 2% of the asset base replacement value.
The funding needs for new and/or upgrades to transport assets will be identified via transport strategies, studies and masterplans and funding sought from grants and/or developer contributions. As identified, these will be incorporated into future TAMP revisions.
Capital renewal treatments are like for like and do not account for additional costs to upgrade assets.
Current Levels of Service are considered appropriate and meet community needs.
Asset register currency pertaining to asset quantities.
Network strategic condition inspections will be funded on a 3-4 year cyclic basis and incorporated into the Operational budget.
Risk of Change to Assumption / Impact to Model
Low as the financials and engineering rates have been reconciled
Low and bridges data is the only dataset that will be updated in the next iteration
Current human resource plan will not change in the near future. Low
Table 23 – Key Assumptions made in TAMP and Risks of Change
7.2 Improvement Plan
The Asset Management Improvement Plan which is set out in Table 24 below details the key improvement tasks. Completion of these tasks will improve Council’s asset management capabilities for this asset class.
1. Develop a Transport responsibility matrix with a view to identify and streamline roles and responsibilities.
2. Formally document the rule bases which reflect the policy decisions that Council employs to determine when they will select transport assets for inclusion in their capital works program.
3. Ensure that information pertaining to Transport hierarchies and criticality are reviewed and updated in Council’s Asset Register.
Capital Works
June 2023
Page 50 of 52
OFFICIAL-Sensitive
Medium
Medium
Medium
to Low
Medium
Low
Improvement
Responsibility Timeline
Task No
Items
Engineering
Manager
Manager
Services
& Senior
Operations June 2023
Engineering
Manager
Manager
Services
& Senior
Engineering
Manager
Services
December 2023
Transport Asset Management Plan 2022-2032
4. Review and formally document the current operations and maintenance Levels of Service with regard to all transport assets owned or maintained by Council. These activities should take into account the transport function, legislative requirements and utilisation needs when documenting activities and response times.
5. Review and update activities within the Customer Request Management System following the development of maintenance service levels and develop reports to measure performance in accordance with the levels of service documented in Section 3.5.1.
6. Review and formally document Council’s transport condition assessment manual methodology framework.
7. Develop and implement an asset handover process to enable 100% asset data capture of new transport assets gifted or constructed by others and those renewed, to be captured in Council’s asset register on an annual basis.
8. Develop and document a criticality framework which will be incorporated into the asset register and second-generation prediction models.
9. Formally document a Risk Management Policy which will set the overall framework for addressing infrastructure asset risk within the context of International Standard ISO31000-2018.
10. Ensure that new asset needs identified from Transport Strategy, Pedestrian Access and Mobility Plan and other studies are reflected in future TAMP and the LTFP.
11. Plan, schedule and seek funding for network wide transport condition assessments on a 3-5 yearly cycle, commencing in 2025 to coincide with Council’s transport revaluation requirements.
12. Explore opportunities for future community surveys to incorporate additional specific questions to the community regarding transport assets, to identify and measure the importance
Services Manager & Financial
Services Manager
Page 51 of 52
OFFICIAL-Sensitive
Responsibility Timeline
Task No Improvement Items
Engineering
Manager
Manager
December 2023
Services
& Senior
Operations
Engineering Services Manager & Senior Manager Operations December 2023
Engineering
Manager December 2023
Services
Engineering Services Manager December 2023
Engineering Services Manager June 2024
Director
June 2024
Infrastructure
Engineering
Partnering
On-going
Services Manager & Financial
and Analytics Manager
On-going
Engineering
Partnering and Analytics Manager
Engineering
On-going
Transport Asset Management Plan 2022-2032
Task No Improvement Items
Timeline and performance in delivering this service to the community.
13. Review financial forecasts annually as better data becomes available, update and submit any supporting budget bids.
Responsibility
Financial Partnering and Analytics Manager, Engineering Services Manager & Senior Manager Operations
On-going
14. Review resourcing plan to ensure adequate human resources are available to deliver this TAMP
Table 24
Improvement Actions
7.3 Monitoring and Review Procedures
Director Infrastructure On-going
The TAMP has a planning horizon of 10 years, and it is based on details documented within the Asset Management Strategy. The TAMP will be reviewed and updated in the year following Council Local Government elections.
This TAMP will be reviewed and amended to recognise any changes in service levels, needs arising from PSP and master plans and/or resources available to provide those services as a result of the budget decision process.
7.4 Performance Measures
The effectiveness of this TAMP will be measured and monitored on the basis of annual strategic Council indicators as follows:
• The performance of Council against the Levels of Service documented in this TAMP; and
• Performance against the Asset Management Ratios.
Page 52 of 52
OFFICIAL-Sensitive
–
