9 minute read
Aftershocks Reveal New Details About Montana Fault Behavior


By Michael Stickney, Montana Bureau of Mines and Geology, Montana Tech, Butte Montana
Introduction
Montana has a history of large and destructive earthquakes. Major earthquakes occurred near Three Forks in 1925 (M 6.6), near Helena in 1935 (M 5.8, 6.3, and 6.0, 4 dead), west of Hebgen Lake in 1947 (M 6.2), and most importantly, at Hebgen Lake in 1959 (M 7.3 with 5 aftershocks M 6.0–6.5, 29 dead). Written accounts of all these earthquakes documented the occurrence of energetic aftershock sequences. However, all these earthquakes occurred before a systematic network of seismograph stations operated in Montana, and only a few of the largest aftershocks are documented in earthquake catalogs. The absence of local seismographic recording makes even the locations, focal depths, and focal mechanisms of these important historic earthquakes a matter of ongoing discussion and debate (Stickney, 2022). During the four decades since the Montana Regional Seismograph network began routinely recording and cataloging seismicity in 1982, only two earthquakes with magnitudes in the 5.6 to 5.8 range have occurred in western Montana. The detailed seismic monitoring coverage now available has provided new insights into the behavior of aftershock sequences and how they relate to moderate-magnitude earthquakes.
Regional Setting
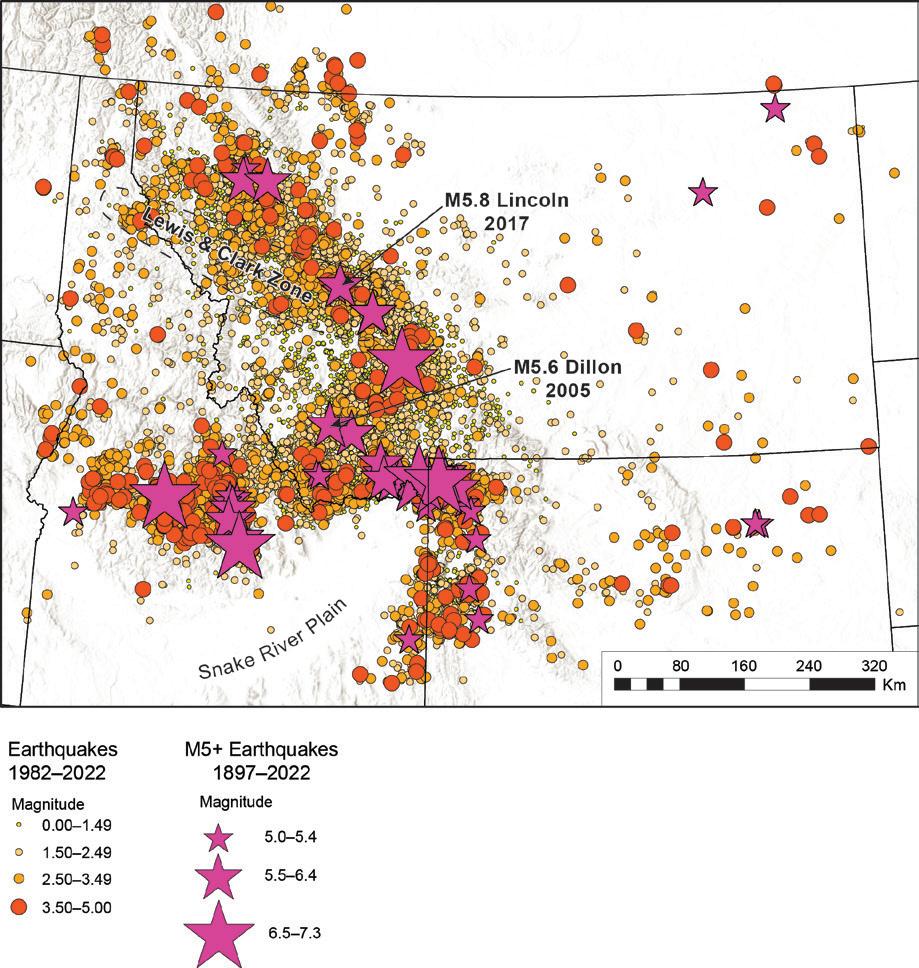
The Intermountain Seismic Belt (ISB) is a 1400-km-long zone of shallow seismicity that arcs from northwestern Montana to southern Nevada (Figure 1), passing through Yellowstone National Park and along the Wasatch Range in central Utah (Smith and Arabasz, 1991). An arm or branch of the ISB—known as the Centennial Tectonic Belt (CTB; Stickney and Bartholomew, 1987)—extends westward from Yellowstone into west-central Idaho, along the northern margin of the Snake River Plain. The ISB is marked by a 100-km-wide zone of diffuse, shallow seismicity with hypocenters typically ranging from 3 to 16 km below the surface. Earthquake swarms and mainshock–aftershock sequences are common within the ISB, but surface-rupturing earthquakes have occurred only three times historically (M 6.6, Hansel Valley, UT in 1934; M 7.3, Hebgen Lake, MT in 1959; and M 6.9, Borah Peak, ID in 1983). There are numerous late Quaternary faults within the ISB and CTB, but except for the very largest earthquakes and a few other notable exceptions, Montana seismicity does not correlate with mapped Quaternary faults (Stickney, 2007). Rather, routine seismicity tends to occur in the footwall blocks, or off either end of mapped Quaternary faults. The three » CONTINUED ON PAGE 18
» CONTINUED FROM PAGE 16 surface-rupturing historic earthquakes, together with more recent instrumentally determined focal mechanisms, indicate that extensional tectonic forces drive ISB seismicity. To the north of Yellowstone and along the western CTB, extension is directed NE–SW, while south of Yellowstone, extension is directed nearly E–W. The extension directions are more complicated near the Yellowstone Caldera and are oriented NNE in the Hebgen Lake region. Most ISB earthquakes involve normal or normal-oblique faulting. However, earthquake focal mechanisms from west-central and northwest Montana indicate that strike-slip faulting is common. In contrast to the high levels of seismicity observed along both margins of the Snake River Plain, the SRP itself is remarkably aseismic (Figure 2)
No earthquakes over magnitude 6.0 have occurred in Montana since the aftershock sequence of the 1959 M 7.3 Hebgen Lake earthquake, over six decades ago. The Montana Bureau of Mines and Geology (MBMG) began routinely monitoring, locating, and reporting earthquakes in 1982. Thus, a major
» CONTINUED ON PAGE 19
Montana earthquake and its aftershock sequence has yet to be recorded by the permanent regional seismograph network. However, two moderate-magnitude earthquakes have occurred within the Montana Regional Seismograph Network. The aftershock sequences of the M 5.6 Dillon earthquake in 2005 and the M 5.8 Lincoln earthquake in 2017 (Figure 2) have provided some unexpected insights into shallow-focus earthquakes along the northern ISB.
2005 Dillon Earthquake
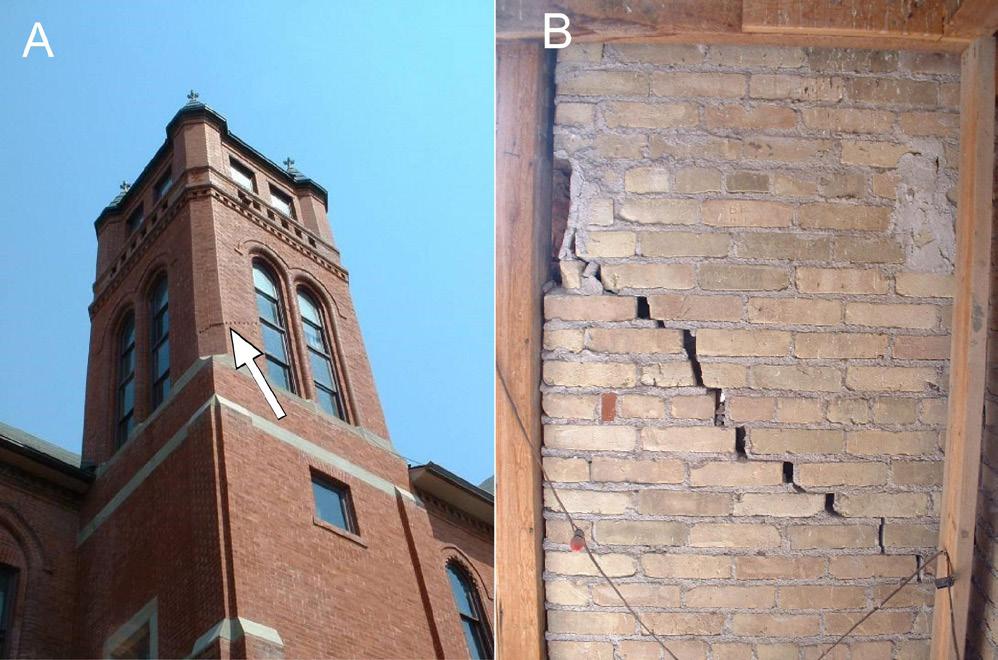
The July 26, 2005 Dillon earthquake occurred 15 km north of Dillon within a region of previously low seismicity. The M 5.6 Dillon earthquake caused damage to some masonry structures (Figure 3) and chimneys in Dillon. Unfortunately, the Dillon earthquake occurred at the western edge of the seismograph network and there were no seismograph stations operating within 45 km of the epicenter. The
MBMG coordinated with the U.S. Geological Survey to install a new seismograph station near the epicenter about 2 weeks after the earthquake, thus filling a monitoring coverage gap in the network. Over the next 5 years, the MBMG located 1,971 aftershocks ranging from less than magnitude 0.2 to 4.2. Fifty-two aftershocks had magnitudes of 3.0 or larger and 61 percent of the aftershocks occurred during the first year after the mainshock. The Dillon aftershocks form an elliptical cluster with a N–S dimension of 8 km and 4 km in the E–W dimension (Figure 4). The smaller patch of epicenters east of the main aftershock cluster followed a magnitude 3.9 earthquake 6 months after the mainshock, likely on a nearby but different fault than the mainshock. This small aftershock sequence within a larger aftershock sequence illustrates some of the complexity inherent in such earthquake sequences. The Dillon mainshock occurred at a depth of 10.9 km below the surface
FIGURE 5: P–T axes from 91 Dillon aftershocks. (A) Contoured T-axis orientations with average extension direction of N55E labeled. The rose diagram illustrates the azimuthal T-axis distribution. (B) Contoured P-axis orientation. Squares labeled 1, 2, and 3 are the orientations of sigma 1, 2, and 3, respectively, calculated from this set of P-axis orientations.
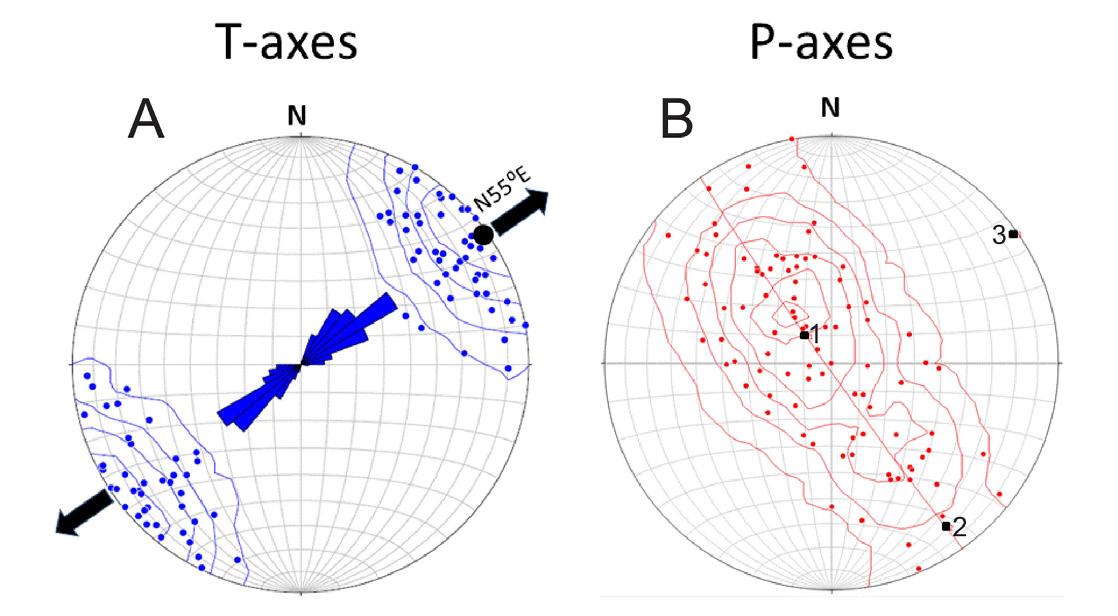
» CONTINUED FROM PAGE 19 along a north-trending, east-dipping oblique-normal fault that apparently lacks any surface expression. Aftershock fault plane solutions indicate primarily oblique-normal faulting with some pure strike-slip mechanisms and even a few oblique-reverse mechanisms. P-axis orientations (sigma 1, the maximum principal stress; Figure 5a) form a linear belt from NW, through vertical, to SE, with a slight concentration plunging about 80° at about N35°W, reflecting the variety of focal mechanisms. The common denominator for virtually all aftershock focal mechanisms is a NE–SW-oriented T-axis (sigma 3, the least principal stress; Figure 5b).
Viewed in cross section, the majority of aftershock hypocenters formed a V-shaped cloud lying above the inferred mainshock fault plane. The orientation and dimensions of the fault plane that ruptured during the mainshock were estimated from the focal mechanism and the distribution of aftershocks that occurred during the first 24 hours. The moment magnitude and fault plane dimensions of 5.5 km by 3.25 km were used to estimate an average slip displacement of 56 cm. All of these parameters served as input for the software package Coulomb 3.3 (Toda and others, 2011), which calculates static stress changes in the surrounding region resulting from the mainshock fault slip. A cross-section perpendicular to the fault plane (Figure 6) shows the change in dilatational stress resulting from the mainshock. Remarkably, the vast majority of the aftershock hypocenters occurred within the quadrant above the fault plane where dilatational stress increased. Within this quadrant, the normal stress on preexisting small faults and fractures was reduced, triggering aftershocks. The corresponding quadrant below the fault plane is largely aseismic, likely because it is predominately below the brittle–ductile boundary at about 16 km depth. This visualization of stress change provides a plausible explanation for the V-shaped cloud of aftershocks lying above the fault plane instead
» CONTINUED ON PAGE 22 of tracing out the fault plane that slipped during the mainshock.
2017 Lincoln Earthquake
The July 6, 2017 Lincoln earthquake occurred 13 km southeast of the small town of Lincoln, MT and was felt throughout western Montana and adjacent parts of surrounding states and provinces. Only minor damage and a brief power outage at Lincoln were reported following the M 5.8 earthquake, likely due to its remote location from larger population centers like Helena. The Lincoln earthquake occurred along the main axis of the ISB in a region of abundant previous seismicity and within the footprint of the Montana Regional Seismic Network. The three closest surrounding seismograph stations were 20 to 40 km from the mainshock epicenter, so the U.S. Geological Survey deployed three temporary stations near the epicenter to improve aftershock hypocenter location accuracy. Several weeks later, the University of Montana Geosciences Department deployed three additional stations to improve focal sphere coverage. The U.S. Geological Survey removed their stations in October, but the University of Montana stations ran through the winter and they deployed seven additional stations the following summer. All the temporary stations supplementing the permanent network provided unprecedented seismographic monitoring coverage for the vigorous aftershock sequence. During the 5 years following the Lincoln earthquake, the MBMG located 4,473 aftershocks (Figure 7) ranging in magnitude from 0.0 to 5.1. Fifty-eight aftershocks had a magnitude of 3.0
» CONTINUED ON PAGE 24 or larger and 76 percent of the aftershocks occurred during the first year after the mainshock.
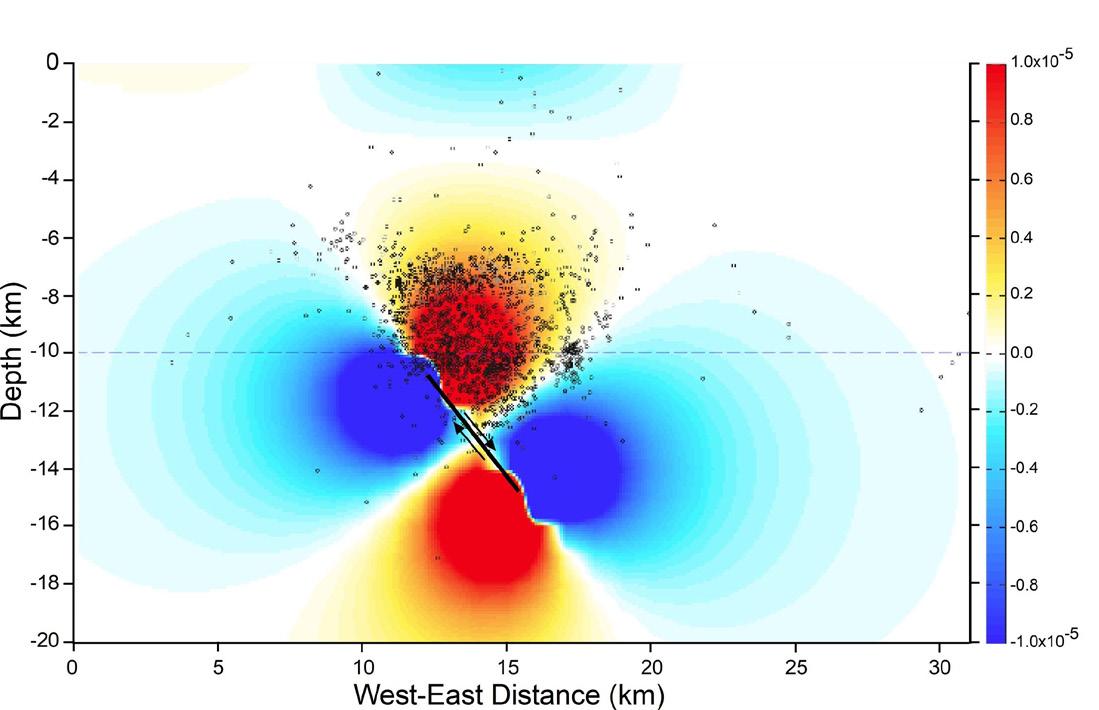
FIGURE 7: Epicenters of the magnitude 5.8, July 6, 2017 Lincoln earthquake (largest star), two magnitude 5 aftershocks (smaller stars), and 4,734 aftershocks that occurred during the next 5 years. The magnitude 5 aftershock lying southwest of the principal aftershock cluster occurred 5 minutes after the mainshock when significant ground motion was still in progress; it is likely mislocated. The smaller epicenter clusters south of Lincoln represent bookshelf faults that Smith and others (2021) identified.
The focal mechanism for the Lincoln earthquake indicated strikeslip faulting, either right-lateral on a WNW-trending fault, or left-lateral on a NNE-trending fault. This region of the ISB is transected by the Lewis and Clark Zone (LCZ), a structurally complex system of long-lived, WNW-trending faults and folds extending 400 km from the Helena region in west-central Montana to northern Idaho. Most of the dozen major LCZ faults do not have documented later Quaternary offset, although a couple well to the east and west of Lincoln do. Therefore, when the Lincoln mainshock occurred within the LCZ and had a WNW-trending nodal plane, it was reasonable to assume that this earthquake resulted from dextral slip on a WNW-trending LCZ fault. However, the aftershocks tell a different story. After just a few days, the aftershock epicenters defined an elliptical cluster about 9 km long and 5 km wide. The long axis trends north. Precise relocations of these aftershocks (Smith and others, 2021) show the aftershock hypocenters in this cluster define a north-trending, steeply east-dipping plane from 10 to 20 km deep (Figure 8). Precise aftershock locations together with the mainshock and many aftershock focal mechanisms indicate that the Lincoln earthquake occurred on a N-trending sinistral fault that lacks surface expression. Another interesting aspect of the Lincoln aftershocks sequence was the occurrence of several isolated clusters of aftershocks that occurred up to 15 km west of the mainshock epicenter.
» CONTINUED ON PAGE 25 first 16 months of the aftershock sequence,
Map view of aftershock epicenter clusters. Red star is mainshock epicenter and the longest blue line represents the strike of the mainshock fault plane determined from the moment tensor solution. Shorter blue lines represent faults inferred from hypocenter trends and fault plane solutions. (B) West to east cross-section (looking north) of aftershock hypocenter clusters. Red star is mainshock hypocenter and the longest blue line represents the dip of the mainshock fault plane determined from the moment tensor solution. Shorter blue lines represent faults inferred from hypocenter trends and fault plane solutions.
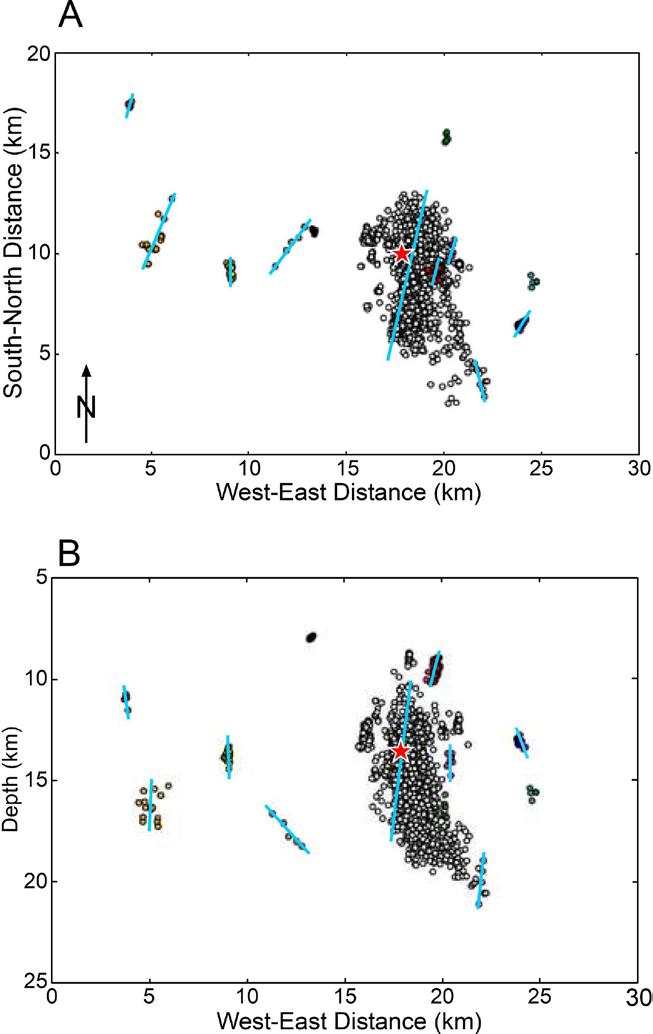
The precise aftershock hypocenter relocations (Smith and others, 2021) showed that these clusters formed short, northerly trending, linear zones (Figure 8). Aftershock focal mechanisms indicated strike-slip faulting similar to the mainshock mechanism. Taken together, these observations illuminated a west-trending zone of individual, north-trending sinistral faults activated by the Lincoln mainshock. The most reasonable explanation for this pattern of isolated aftershock clusters is a zone of bookshelf faulting (Smith and others, 2021). Dextral shear across the LCZ is resolved as sinistral slip on a series of subparallel, north-trending faults. Bookshelf faulting implies that rigid blocks within the LCZ are rotating clockwise under the influence of dextral shear, with their N-trending margins (faults) slipping past each other in a sinistral sense. If this behavior is typical of this portion of the ISB, perhaps it helps explain the lack of recognized late Quaternary offset on the major WNW-trending LCZ faults.
Summary
Aftershock sequences have revealed new information about the behavior and characteristics of moderate-magnitude earthquakes in the northern ISB. It is unlikely that this information would have come to light without data from a modern seismic monitoring network. We look forward to learning new information in the future as opportunities present themselves.
References Cited
Smith, E.M., Martins, H.R., and Stickney, M.C., 2021, Microseismic Evidence for Bookshelf Faulting in Western Montana: Seismological Research Letters, v. 92, p. 802–809, https://doi. org/10.1785/0220200321
Smith, R.B., and Arabasz, W.J., 1991, Seismicity of the Intermountain Seismic Belt, in Slemmons, D.B., Engdahl, E.R., Zoback, M.D., and Blackwell, D.D., eds., Neotectonics of North America: Boulder, Colo., Geological
Society of America, Decade Map, v. 1.
Stickney, M.C., 2007, Historic earthquakes and seismicity in southwestern Montana: Northwest Geology, v. 36, p. 167–186.
Stickney, M.C., 2022, Earthquakes and seismographic monitoring in Montana, in Metesh, J.J., and Gammons, C.H., eds., Geology of Montana—Special Topics: Montana Bureau of Mines and Geology Special Publication 122, v. 2, 50 p., available at https:// mbmg.mtech.edu/pdf/geologyvolume/StickneyEarthquakesFinal.pdf
Stickney, M.C., and Bartholomew, M.J., 1987, Seismicity and late Quaternary faulting of the Northern Basin and Range Province, Montana and Idaho: Bulletin of the Seismological Society of America, v. 77, p. 1602–1625.
Toda, S., Stein, R.S., V. Sevilgen and Lin, J., 2011, Coulomb 3.3 Graphic-Rich Deformation and Stress-Change Software for Earthquake, Tectonic, and Volcano Research and Teaching—User Guide: U.S. Geological Survey Open-File Report 2011-1060, 63 p.
Helios Energy Limited (ASX Code: HE8)
A premier exploration and production company focused on the acquisition, exploration, development, exploitation and trading of conventional and unconventional oil, natural gas, and helium resources on a global perspective
Operating merging unconventional oil and gas play in Texas, and North America, and undertaking world-class helium gas field
Multiple international trade channels in Specialty Gases and LNG
S&P/ASX 300 Index since March, 2019
Headquartered in Houston, TX and having offices in Perth, Australia and Beijing, China http://www.heliosenergyltd.com/
HYBRID
Speaker: Elizabeth Horne
Date: March 1, 2023 | 12:00 pm - 1:00 pm