
12 minute read
Traffic Density, Pollutant Concentrations, and Heart Rates in a College Market District


ID62202: City Infrastructure Lab
22ID60R19
Advertisement
1. Background
The relationship between health, vehicles and air quality is complex and interrelated. Poor air quality is a significant public health concern, as it can cause respiratory and cardiovascular diseases, as well as other health problems. Vehicles are a significant contributor to air pollution, particularly in urban areas, as they emit harmful pollutants such as particulate matter, nitrogen oxides (NOx), and volatile organic compounds (VOCs). These pollutants are harmful to human health and can have serious consequences over time, including increased risk of premature death, hospitalization, and long-term chronic diseases.
In order to mitigate the health impacts of air pollution from vehicles, it is necessary to reduce emissions from the transportation sector. This can be done through the use of cleaner vehicles, such as electric vehicles or vehicles with advanced emission control systems, as well as by promoting alternative modes of transportation, such as cycling and public transit. Additionally, reducing congestion and traffic through urban planning and design, as well as implementing emissions reduction policies and regulations, can help to improve air quality and protect public health.
2. Project Proposition
2.1 Aim
The aim of this study is to investigate the relationship between traffic density, pollutant concentrations, and heart health in the Tech Market Area, I.I.T Kharagpur.
2.2 Objectives
• To assess the traffic density and vehicle flow rates in the study area.
• To measure the concentration of air pollutants at different times and locations.
• To record heart rates of participants in the study area.
• To determine the correlation between traffic density, pollutant concentrations, and heart health.
• To investigate the relationship between exposure to vehicular emissions and health outcomes, such as heart rate and respiratory rate, in the local population.
2.3 Methodology
• Data collection: o Vehicle flow video recording using camera. o Air quality parameters using sensors. o Health parameters using smart watch.
• Parameters measured: o Vehicle typology (motor vehicles, bicycles, pedestrians), speed. o PM 2.5, PM 10, NO. o Heart rate (walking, cycling).
• Data analysis: o Vehicular detection, tracking and counting using YoloV7 deep learning algorithm and MS Excel. o Air quality parameters analysis using Aeroqual app and MS Excel and calculation of Air Quality Index (AQI). o Health parameters analysis using Garmin Connect and MS Excel.
• Relationship derivation: o Between vehicular flow, speed and density, o AQI and vehicular characteristics, o Health parameters and AQI.
2.4 Instruments used:
• Video recording: Sony Handycam HDR-CX405, tripod.
• Air quality measurement sensors: o Aeroqual CO o Aeroqual NOx o Aeroqual PM 2.5, PM 10 o Aeroqual RH and Temperature.
• Health parameters: Garmin VivoActive HR smartwatch.
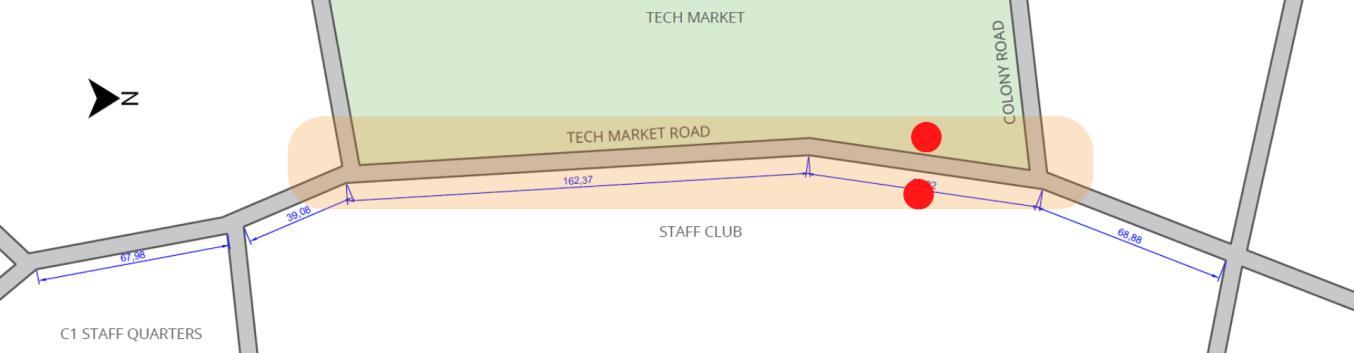
2.5 Site Details
Data for base and peak hours is collected for the following locations:
2.5.1 Location 1: Ardeshir Dalal Avenue
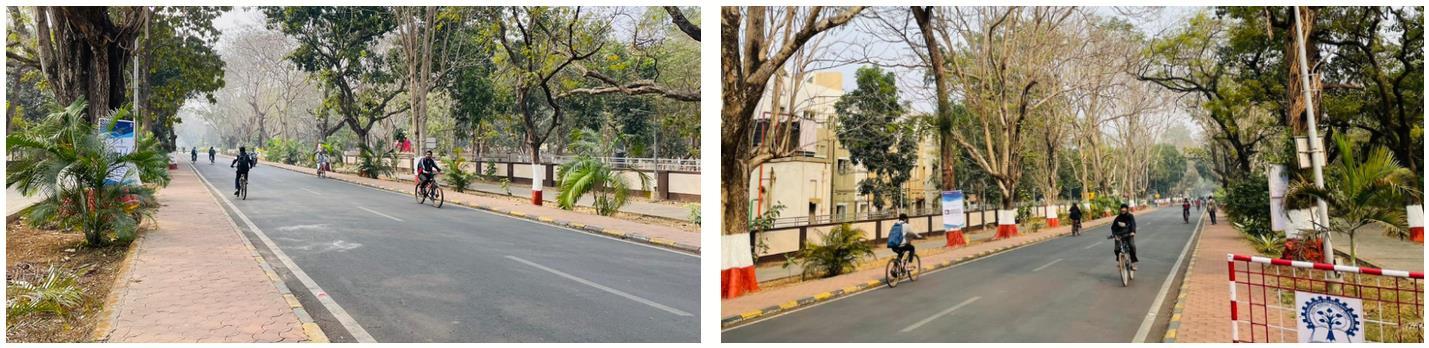


• Stretch between Clock Tower and Gate Number 5.
• Characteristics: o Undivided single-lane road. Bidirectional traffic. o Dedicated bicycle path on both sides. o Pedestrian pavement on both sides.

• Data Collection Timings: o Peak hours: 07:45 hrs to 08:45 hrs, 13:00 hrs to 14:00 hrs. o Non-peak hours: 10:00 hrs to 11:00 hrs.
• Characteristics: o Undivided single-lane road. Bidirectional traffic. o No bicycle lanes. o No pedestrian pavements.
• Data Collection Timings: o Peak hours: 18:00 hrs to 19:00 hrs. o Base hours: 14:00 hrs to 15:00 hrs.
2.6 Scope and Limitations
For the purposes of this study, one location and one hour (peak/base) has been taken into consideration.
Due to sensor limitations, data has been collected only for PM 2.5, PM 10 and NOx.
To simplify the study, heart rate has been considered as the sole indicator of health. Heart rate and speed (walking/bicycling) are very weakly correlated, according to regression analysis.
3. Literature Review
3.1 Camera Setup
The camera must be setup at an angle �� that can capture all vehicles in the road. If the value of �� is big, the field view will be too small and it definitely cannot capture a big vehicle (ex: a bus or a truck) as a whole. If the angle �� is too small, the view may not cover the whole road. Occlusion can be prevented at a 15 degree angle.


3.2 Air Quality Index (AQI) Calculation
Air Quality Index is a tool for effective communication of air quality status to people in terms, which are easy to understand. It transforms complex air quality data of various pollutants into a single number (index value), nomenclature and colour.

There are six AQI categories, namely Good, Satisfactory, Moderately polluted, Poor, Very Poor, and Severe. Each of these categories is decided based on ambient concentration values of air pollutants and their likely health impacts (known as health breakpoints). AQ sub-index and health breakpoints are evolved for eight pollutants (PM10, PM2.5, NO2, SO2, CO, O3, NH3, and Pb) for which shortterm (up to 24-hours) National Ambient Air Quality Standards are prescribed.
Based on the measured ambient concentrations of a pollutant, sub-index is calculated, which is a linear function of concentration (e.g. the sub-index for PM2.5 will be 51 at concentration 31 µg/m3, 100 at concentration 60 µg/m3, and 75 at concentration of 45 µg/m3). The worst sub-index determines the overall AQI. AQI categories and health breakpoints for the eight pollutants are as follows:
AQI calculations focus on major air pollutants, including particulate matter, ground-level ozone, sulphur dioxide (SO2), nitrogen dioxide (NO2), and carbon monoxide (CO). Particulate matter and ozone pollutants pose the highest risks to human health and the environment. For each of these air pollutant categories, different countries have their own established air quality indices in relation to other nationally set air quality standards for public health protection.
• 0-50: This range defines air quality as good as it shows minimal or no impact on health.
• 51-100: This is a satisfactory air quality range and it can show effects such as breathing difficulty in sensitive groups.
• 101-200: The range shows moderate air quality with impacts such as breathing discomfort for children and elderly people, and people already suffering from lung disorders and heart disease.
• 201-300: AQI falling in this range communicates that the air quality is poor and shows health effects on people when exposed for the long term. People already suffering from heart diseases can experience discomfort from short exposure.
• 301-400: This range shows very poor air quality and causes respiratory illness for a longer duration of exposure.
• 401-500: This is the severe range of AQI causing health impacts to normal and diseased people. It also causes severe health impacts on sensitive groups.
3.2.2 How is Air Quality Determined?
On an hourly basis, the concentration of each pollutant in the air is measured and converted into a number running from zero upwards by using a standard index or scale. The calculated number for every pollutant is termed as a sub-index. The highest sub-index for any given hour is recorded as the AQI for that hour. In simple terms, AQI is like a yardstick that ranges from zero to five hundred (0-500).
The index is a relative scale, meaning, the lower the index, the better the quality of air and the lesser the health concern, and vice versa. The concentration of each pollutant varies; therefore, AQI values are grouped into ranges assigned to standardized public health warnings and colour code.
According to the Indian Government (CPCB), Indian AQI range is from 0-500, from 0 being good and 500 being severe. There are eight major pollutants to be taken into account for AQI calculation, viz. particulate matter (PM 10 and PM 2.5), carbon monoxide (CO), ozone (O3), nitrogen dioxide (NO2), sulfur dioxide (SO2), ammonia (NH3), and lead (Pb). To calculate AQI, data for a minimum of three pollutants must be present, of which one should be either PM10 or PM2.5, AQI ranging from 0-500 has different concentrations for each pollutant and has health effects accordingly.
3.2.3 Measurement of Pollutants NO2, PM 2.5 & PM 10 Using Aeroqual
Using Aeroqual 550 pollutants NO2, PM 2.5 & PM 10 was measured for peak and base hours.
To calculate AQI, a minimum of three parameters should be taken out of which one must be either PM10 or PM2.5. For this experiment we have considered NO2, PM2.5 & PM 10
To calculate sub-indices, 16 hours of data is needed. But for this experiment, we are considering only one-hour data for both peak and base hours.
3.2.3.1 Particulate Matter (PM10 & PM2.5)
A mixture of particles with liquid droplets in the air forms particulate matter. PM 10 are particles that have a size of less than or equal to 10 microns whereas PM2.5 are ultra-fine particles having a size of less than or equal to 2.5 microns.
Sources:
Particulate Matter is released from constructions, smoking, cleanings, renovations, demolitions, constructions, natural hazards such as earthquakes, volcanic eruptions, and emissions from industries such as brick kilns, paper & pulp, etc.
Related effects:
These particles, when inhaled, can penetrate deeper into the respiratory system and cause respiratory ailments such as asthma, coughing, sneezing, irritation in the airways, eyes, nose, throat irritation, etc. Studies have also shown links between PM exposure and diabetes.
Safe exposure limits:
The Indian Government and the US-EPA both use PM10 and PM2.5 as one of the criteria for air quality index (AQI) calculation. The safe exposure levels for PM10 (24 hours) are 0-100 ug/m3 and for PM 2.5 (24 hours) is 0-60 ug/m3 as per the Indian CPCB. As per US-EPA, safe levels of PM10 are 0-54 ug/m3 and PM 2.5 is 0-12.0 ug/m3.
3.2.3.2 Nitrogen Dioxide (NO2)
Nitrogen dioxide is a known highly reactive gas present in the atmosphere.
Sources:
It is released into the environment from automobile emissions, generation of electricity, burning of fuel, combustion of fossil fuel, and different industrial processes.
Related effects:
Nitrogen dioxide poisoning is as much as hazardous as carbon monoxide poisoning. It is when inhaled can cause serious damage to the heart, absorbed by the lungs, inflammation, and irritation of airways. Smog formation and foliage damage are some environmental impacts of nitrogen dioxide.
Safe exposure level:
The Indian government and US-EPA use Nitrogen dioxide as a parameter for calculating AQI. As per the Indian Government, safe exposure is 0-80 ug/m3 (24 hours) and as per US-EPA, it is 0-53 ppb (1 hour).
3.2.4 AQI Calculation Formula
The formula to calculate AQI is the same as per the Indian CPCB and US-EPA. The AQI is calculated using the equations separately for parameters. For example, if you wish to calculate AQI on the basis of four parameters, use the equation four times, and the worst sub-index communicates the
AQI. A sub index is a linear function (two different yet related notions) of the concentration of pollutants.
Ip = [IHi – ILo / BPHi – BPLo] (Cp – BPLo) + ILo
Where,
Ip = index of pollutant p
Cp = truncated concentration of pollutant p
BPHi = concentration breakpoint i.e. greater than or equal to Cp
BPLo = concentration breakpoint i.e. less than or equal to Cp
IHi = AQI value corresponding to BPHi
ILo = AQI value corresponding to BPLo
For example: If you wish to calculate AQI on the basis of PM2.5, CO, and ozone, calculate the subindex for each parameter separately.
If the current concentration of PM2.5 is 110 ug/m3, then referring to AQI range as per Indian standards BPHi = 120, BPLo = 91, IHi = 300 and ILo = 201.
Putting the values in equation and solving:
Sub Index = [(300-201)/ (120-91)] (110-91) + 201 = 265.86
Similarly, for other parameters, the sub-index can be calculated and the worst sub-index shows the AQI.
3.3 Deep Learning Algorithms for Vehicle Detection, Tracking and Sorting
3.3.1 Yolo V4- Deepsort Algorithm
Object tracking implemented with YOLOv4, DeepSort, and TensorFlow. YOLOv4 is a state of the art algorithm that uses deep convolutional neural networks to perform object detections. We can take the output of YOLOv4 feed these object detections into Deep SORT (Simple Online and Realtime Tracking with a Deep Association Metric) in order to create a highly accurate object tracker.
3.3.1.1 Deep Convolutional Neural Networks
The strength of DCNNs is in their layering. A DCNN uses a three-dimensional neural network to process the Red, Green, and Blue elements of the image at the same time. This considerably reduces the number of artificial neurons required to process an image, compared to traditional feed forward neural networks.
Deep convolutional neural networks receive images as an input and use them to train a classifier. The network employs a special mathematical operation called a “convolution” instead of matrix multiplication.
The architecture of a convolutional network typically consists of four types of layers: convolution, pooling, activation, and fully connected.

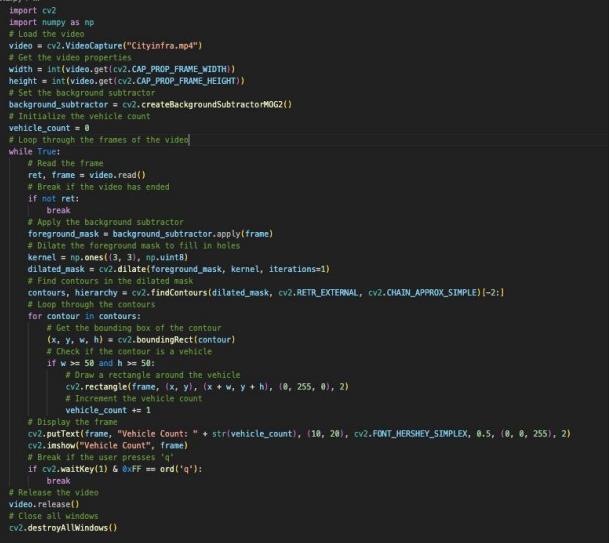
3.3.2 OpenCV Vehicle Detection and Tracking
This project focuses on "Vehicle Detection, Tracking and Counting" on Security Cameras by using Background Subtraction Algorithm that is provided on OpenCV.
This project has more than just counting vehicles, here are the additional capabilities of this project:
• Detection of vehicle's direction of travel
• Prediction the speed of the vehicle
• Vehicle Count
• The program gives a .csv file as an output (traffic_measurement.csv) which includes "Vehicle Type/Size", “Vehicle Color", ”Vehicle Movement Direction", "Vehicle Speed (km/h)" rows, after the end of the process for the source video file.
3.3.3 Vehicle Detection, Tracking and Counting
Background subtraction is a major preprocessing steps in many vision based applications. First you need to extract the person or vehicles alone. Technically, you need to extract the moving foreground from static background.
If you have an image of background alone, like image of the room without visitors, image of the road without vehicles etc., it is an easy job. Just subtract the new image from the background. You get the foreground objects alone.
But in most of the cases, you may not have such an image, so we need to extract the background from whatever images we have. It becomes more complicated when there is shadow of the vehicles. Since shadow is also moving, simple subtraction will mark that also as foreground.
3.3.3.1 Code Snippets
4. Data Collected
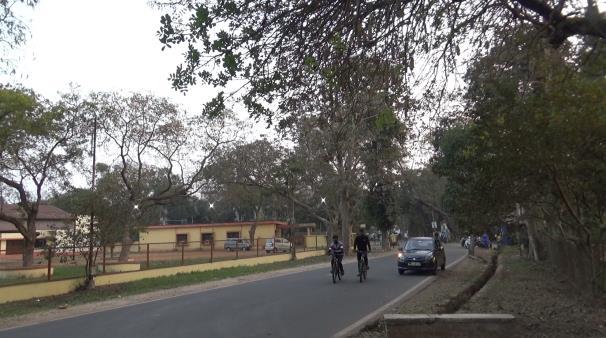
4.1 Video Capture Data:
In this study, video data was captured using a Sony handycam to analyze vehicle traffic in a particular area. The video was recorded in .avi format and was later converted into .mp4 for input into the algorithm. The use of video data in traffic analysis has been proven to be effective in various studies (Gunn et al., 2005; Deodhare et al., 2019). The algorithm used in this study returned accurate vehicle counts and speed of the vehicles captured in the video, with accuracy up to a minute. This is similar to the findings of previous studies that have used video-based data collection methods to analyze traffic flow (Mikami et al., 2015; Cheng and Wang, 2019). The accuracy of the algorithm is critical to the reliability of the results obtained from this study. Accurate data is essential in understanding the relationship between vehicle density, flow, speed, and pollutant concentration

4.2 Pollutant Concentration:
The Aeroqual S-500 portable air quality monitor was tested before data collection to ensure its accuracy and reliability. Initial tests were conducted on the sensor to ensure its proper functioning. The Aeroqual software was then set up on a laptop for data transfer and storage of the pollutant concentration data obtained from the sensor. In order to ensure consistency of data, location IDs were assigned for different testing locations and the time was synchronized using an accurate time source. Pollutant concentrations, including PM 2.5, PM10, and NOx, were measured at an interval of 1 minute using the Aeroqual S-500 sensor. Finally, all the sensor data was compiled into a single dataset for further analysis of the air quality index.
4.3 Smart Watch Data


In this project, heart rate was measured using a Huawei MagicWatch 2, a smartwatch equipped with photoplethysmography (PPG) technology. The watch was worn by the subjects during the data collection period, and heart rate data was recorded continuously. This method has been previously validated as an accurate means of measuring heart rate (Liu et al., 2019).

To capture the data, the watch was synced to an app, Huawei Health, which allowed for the transfer of data to Apple HealthKit for csv export. The heart rate data was exported as a dataset with a timestamp every minute along with the corresponding heart rate measurement.
The use of the Huawei MagicWatch 2 for heart rate measurement has been validated in previous studies, showing it to be a reliable and accurate tool for monitoring heart rate during various activities (Reynolds et al., 2021; Zhang et al., 2021). The use of continuous heart rate monitoring provides a more complete picture of the heart rate response over time, which can be useful in identifying trends and patterns in response to various stimuli.
Overall, the use of the Huawei MagicWatch 2 and corresponding software provided a reliable and efficient means of measuring heart rate in this study. The continuous heart rate data obtained from this method provided a valuable source of information for exploring the relationship between air pollution and heart rate.
5. Data Analysis
5.1 AQI Calculation:
The AQI is calculated using data from sensors. The Indian government and US-EPA use Nitrogen dioxide as a parameter for calculating AQI. As per the Indian Government, safe exposure is 0-80 ug/m3 (24 hours) and as per US-EPA, it is 0-53 ppb (1 hour). The safe exposure levels for PM10 (24 hours) are 0-100 ug/m3 as per the Indian CPCB. The safe exposure levels for PM 2.5 (24 hours) are 0-60 ug/m3 as per the Indian CPCB. The formula to calculate AQI is the same as per the Indian CPCB and US-EPA. The AQI is calculated using the equations separately for parameters. The worst sub-index the AQI for a day.
