10 minute read
FEATURE


Investigating the seafloor below the surface of the eastern Gulf of Mexico.

BY SARAH E. GRASTY


For most people, maps have become a universal part of life—just consider how often you open maps on your phone, tablet or computer. With the addition of satellite imagery, we now have amazing detail of the world around us. Beautiful images, even of the most remote places on earth, can be found with just a few clicks…except when it comes to the blue portions of maps.
As soon as we dive beneath the surface of the ocean, information becomes extremely sparse. Yet, we need maps of seafloor topography, called bathymetry, to better understand and conserve fish populations and their habitats. On land, we know that black bears live in forests, alligators live in swamps and people like to hang out in McDonalds. There are similar patterns for where snapper, grouper and sea turtles live. To accurately evaluate their population and condition, it helps to know the location, size and type of neighborhood(s) they prefer.
Exploring the seafloor not only helps to find fish and their habitat, but also reveals where to mine sand for beach renourishment projects, where oil wells should or should not be, and where marine conservation areas should be located. Aside from the seafloor being incredibly expansive and expensive to reach, the types of technology (e.g., satellites) we use to map land are not useful for the deep sea.
Taking inventory of the seafloor also gives us a better understanding of impacts from environmental disasters, à la Deepwater Horizon. High-quality, current and comprehensive baseline data reveals the state of the environment before a disaster occurs. With this information, we can properly assess impacts to the water quality, fish populations, and so on. Luckily, this is precisely the type of work being pursued throughout the Gulf of Mexico by researchers at the University of South Florida (USF) College of Marine Science along with colleagues at the Florida Fish and Wildlife Research Institute (FWRI) and the National Oceanic and Atmospheric Administration (NOAA). The ongoing effort is the Continental Shelf Characterization, Assessment and Mapping Project (C-SCAMP). Information about the West Florida Shelf (WFS) from 60 to 600 feet deep is being collected by combining bathymetric mapping, visual surveys and water column acoustics. This is unlocking secrets of the seafloor in the eastern Gulf of Mexico, as well as the fish and sea turtle populations found among them.
The first area mapped by C-SCAMP was in December of 2015 at the “Elbow,” a popular offshore fishing spot about 90 miles west of St. Petersburg, Florida, in 150 to 220 feet of water. Subsequent visual surveys revealed the area to be lush with mangrove snapper, creolefish, lionfish and extensive reef fish-abundant hard bottom.
The work then began in 2016 to map the region between the Middle Grounds and Steamboat Lumps—an area aptly dubbed the South-West Florida Middle Grounds (SWFMG). Though the SWFMG does not have the same extent of hard bottom as the Elbow or the Florida Middle Grounds, the team has still found scattered pockets of lowrelief hard bottom where mangrove snapper, red grouper and bigeyes were a common sight. They have even mapped the shipwreck of the M/V Holstein, which lies within the SWFMG region.
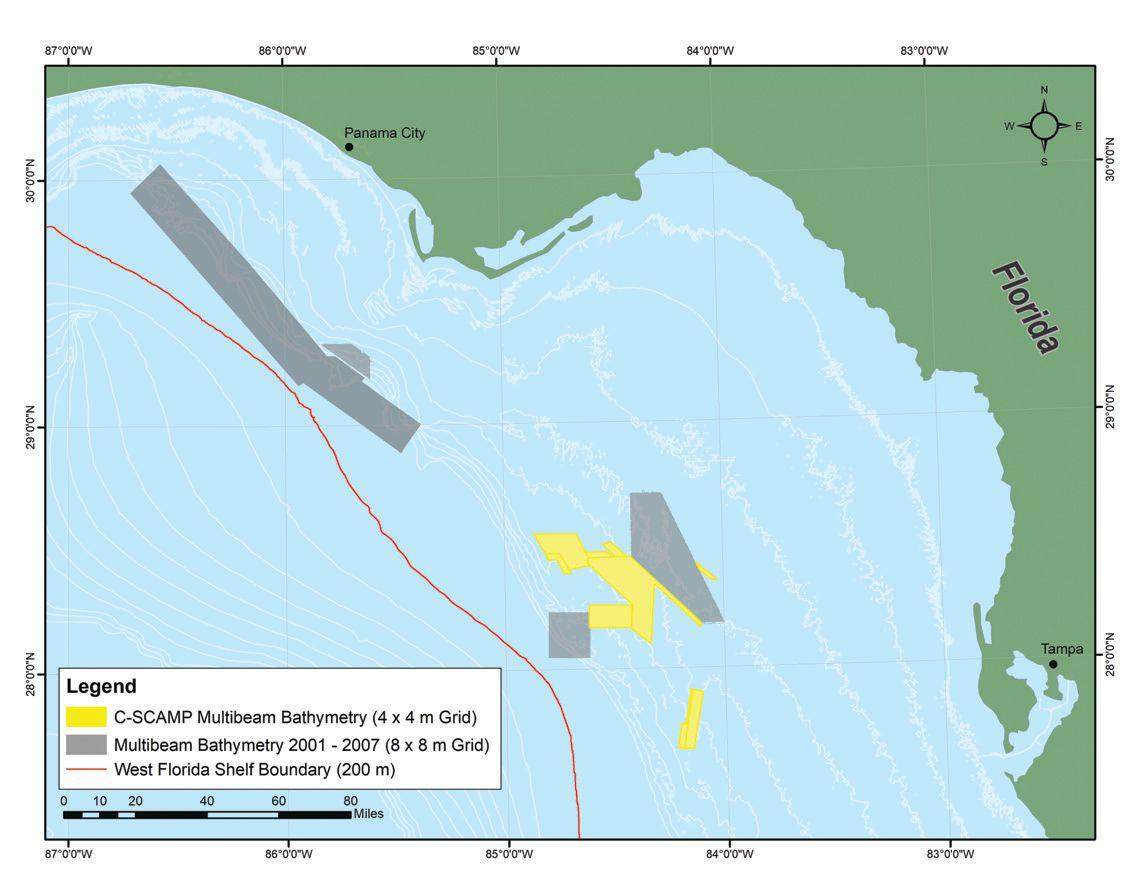
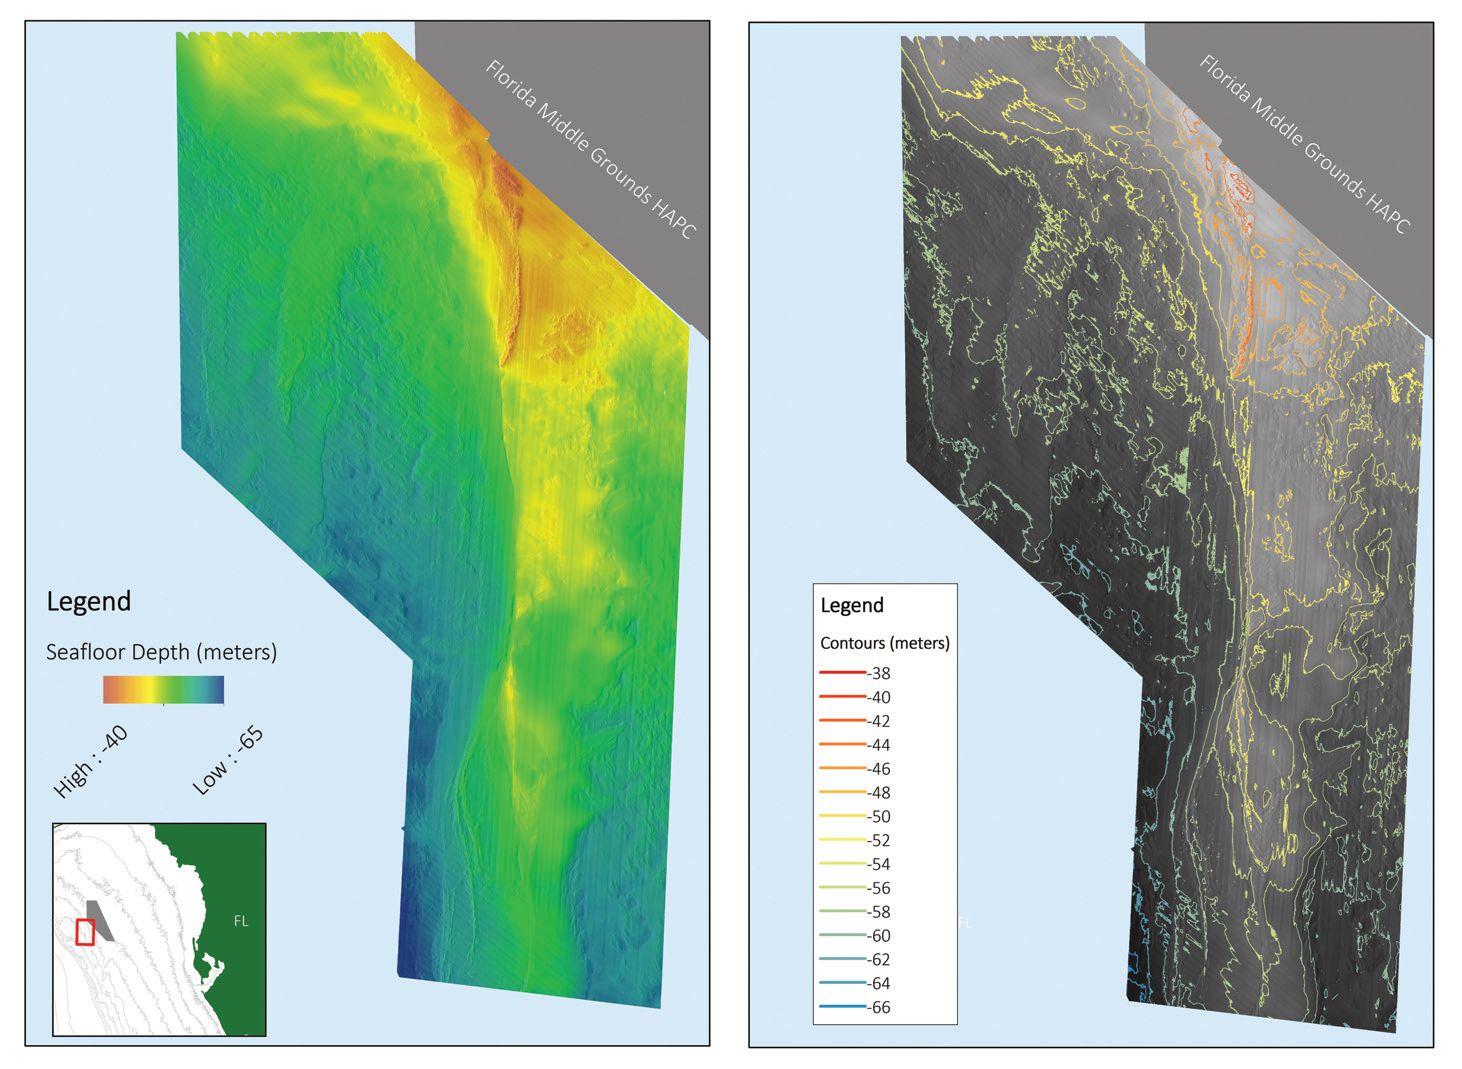
Left: The C-SCAMP group is focusing its efforts in the region between the Florida Middle Grounds and Steamboat Lumps protected areas. The yellow polygons indicate the extent of their work as of early-2018. Right: An example of the multibeam bathymetry that C-SCAMP collected southwest of the Florida Middle Grounds (left) as well as the contour map derived from those data.
Another area where C-SCAMP discovered diverse fish populations was along the Gulfstream Natural Gas Pipeline (GSPL). The GSPL is essentially a 400-mile-long artificial reef that connects Mobile Bay and Tampa Bay. It varies whether the pipe is completely buried, partially exposed, or exists above the sand alongside large piles of dredging rubble on each side, yet one thing is constant: fish are found along nearly its entire length. Thus far, C-SCAMP has mapped and imaged about 70 miles of the structure. Along the way, they’ve seen a wide variety of marine life, from goliath groupers to schools of mangrove and red snapper, as well as loads of lionfish and several loggerhead turtles.
As of October 2018, C-SCAMP’s mapping efforts had resulted in over 700 square miles of newly mapped area. This has allowed them to begin developing large-scale habitat maps, which we hope will help aid in management decisions like stock assessments and protected area delineations.
Keeping the Momentum Going
The main users of all these data were originally expected to be management agencies and research institutions. However, information is frequently uploaded to the C-SCAMP website and can be freely downloaded by the public. In true entrepreneurial spirit, some companies have packaged C-SCAMP’s data and are selling it for a fee. However, over the last couple of years, Tampa Bay area fishermen have reached out to the C-SCAMP group for more information about how to use the free data posted on the project website. With some assistance, these individuals were able to find some productive areas to spend their time offshore fishing. Just last year, a Tampa Bay area fisherman contacted the group for information about the Elbow, and after making it out to the popular offshore fishing spot in late 2017, C-SCAMP was excited to hear that he and his family hauled in several sizable red grouper and red snapper.
Listening to the Seafloor
For the C-SCAMP group, data collection is dependent on two main types of technologies: active acoustics and cameras. The acoustics used include two systems: a multi-beam sonar (Reson SeaBat 7125) for mapping the seafloor, and a water-column sonar (Simrad EK-60 Echosounder) to analyze fish biomass. Both of these systems send out sonic pulses to the seafloor and are not too different from the common depth sounder and fish finders found on most boats. The main difference for the multi-beam sonar is it can map 3–5 times the water depth at extremely high resolution; and for the water column acoustics, information can be turned into counts of fish of known sizes. Towed underwater cameras are then
used to collect video for verifying the acoustic datasets by directly viewing the seafloor features on the maps and the organisms living there.
Seeing the Seafloor
Using the bathymetry (depth of the seafloor) and backscatter (bottom roughness and composition) maps generated from the multi-beam sonar data, planning for the visual surveys can then begin.
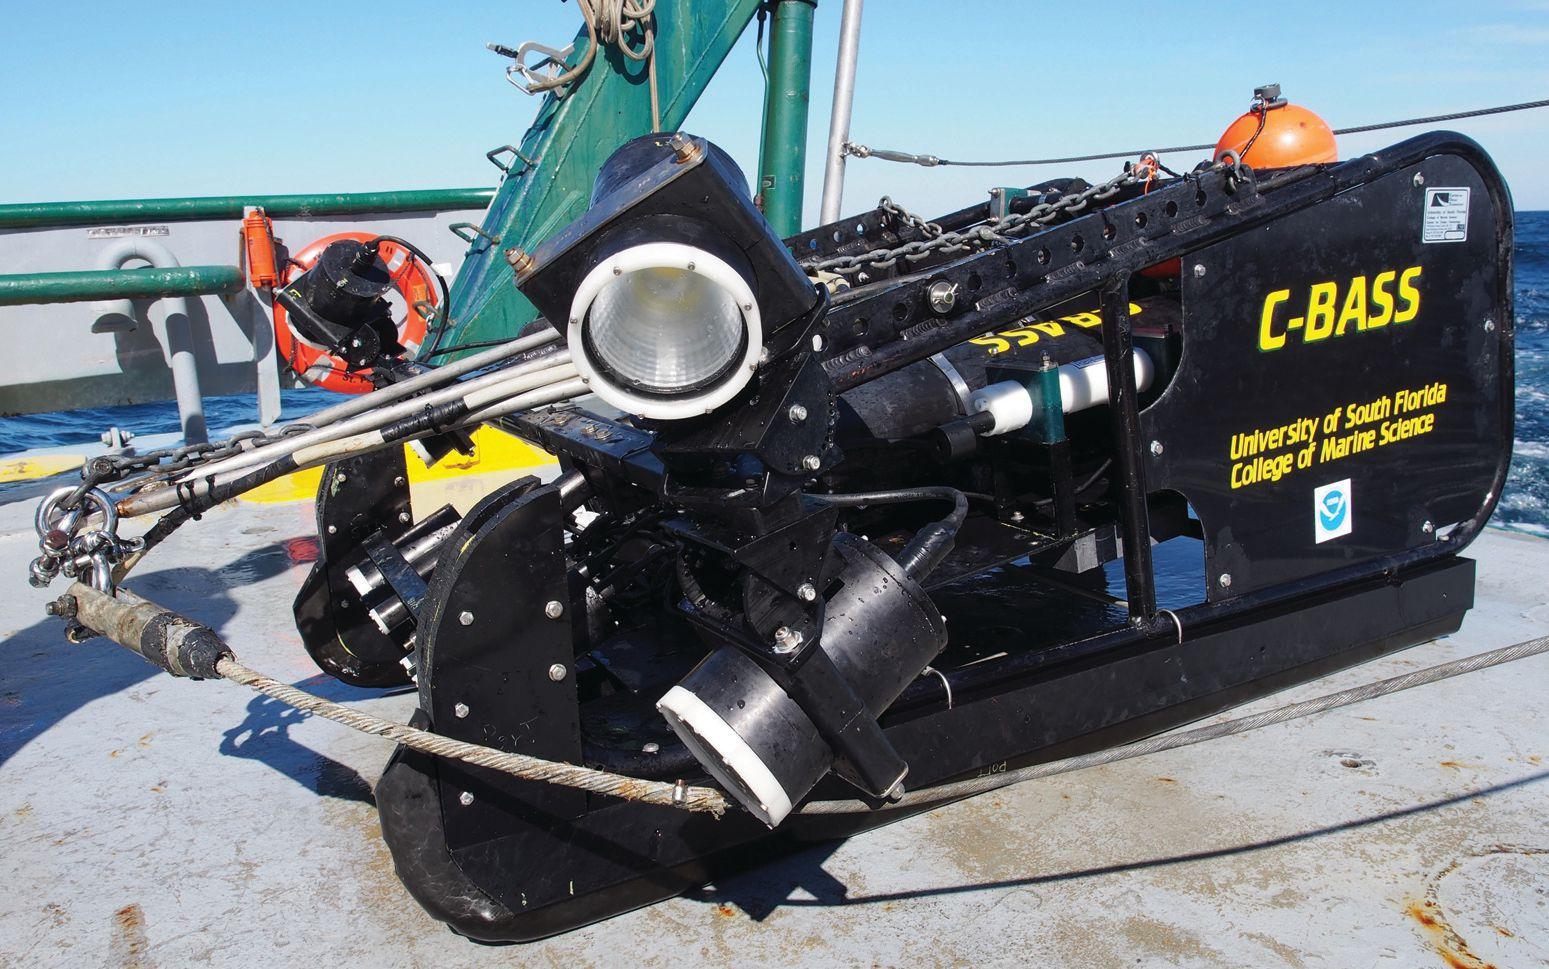
A towed video system developed at USF is used to observe the features depicted in the map(s) and simultaneously take inventory of associated reef fishes and other flora and fauna. This system is called the Camera-Based Assessment Survey System (C-BASS) and it has six video cameras for a near 180-degree field of view, as well as instruments that measure water temperature, salinity, chlorophyll concentration and water clarity. The platform is towed behind a research vessel at 3–5 knots and kept 6–10 feet above the seafloor. The system continuously records and stores video from all cameras and the data streams from the environmental
sensors. Though small reef fishes are occasionally observed, the C-BASS is best suited for observations of the larger-bodied, reef fish species—particularly snapper, grouper, amberjack and porgies.
To make sure the counts of the fishes within the various habitats are accurate, acoustic and visual technologies can be combined and compared. The C-BASS cameras do a good job of seeing targeted species that are fairly close to the seafloor, but certain species of fishes stack up in the water column above the height where the camera is being towed. As a compliment to the camera images, C-SCAMP concurrently runs a Simrad EK-60 Scientific Echosounder—the amped-up fish finder mentioned earlier. This piece of technology is important to understanding where fish exist throughout the entire water column (surface to seafloor) and how many are present.
One major advantage to this visual/acoustic survey approach is it can be used over almost all bottom types. This is particularly advantageous when the area being studied is protected or very rugged, meaning survey gears often used in the past (e.g., trawls and bottom longlines) are not feasible. Because visual gear is inherently non-destructive to the habitat and non-extractive of the marine life being studied, this type of approach also better conserves resources. The use of C-BASS aligns with a global shift that has begun in the last decade with agencies and institutions studying marine resources, such as fish have moved toward relying on visual-based observations as opposed to extraction-based or intrusive methods.
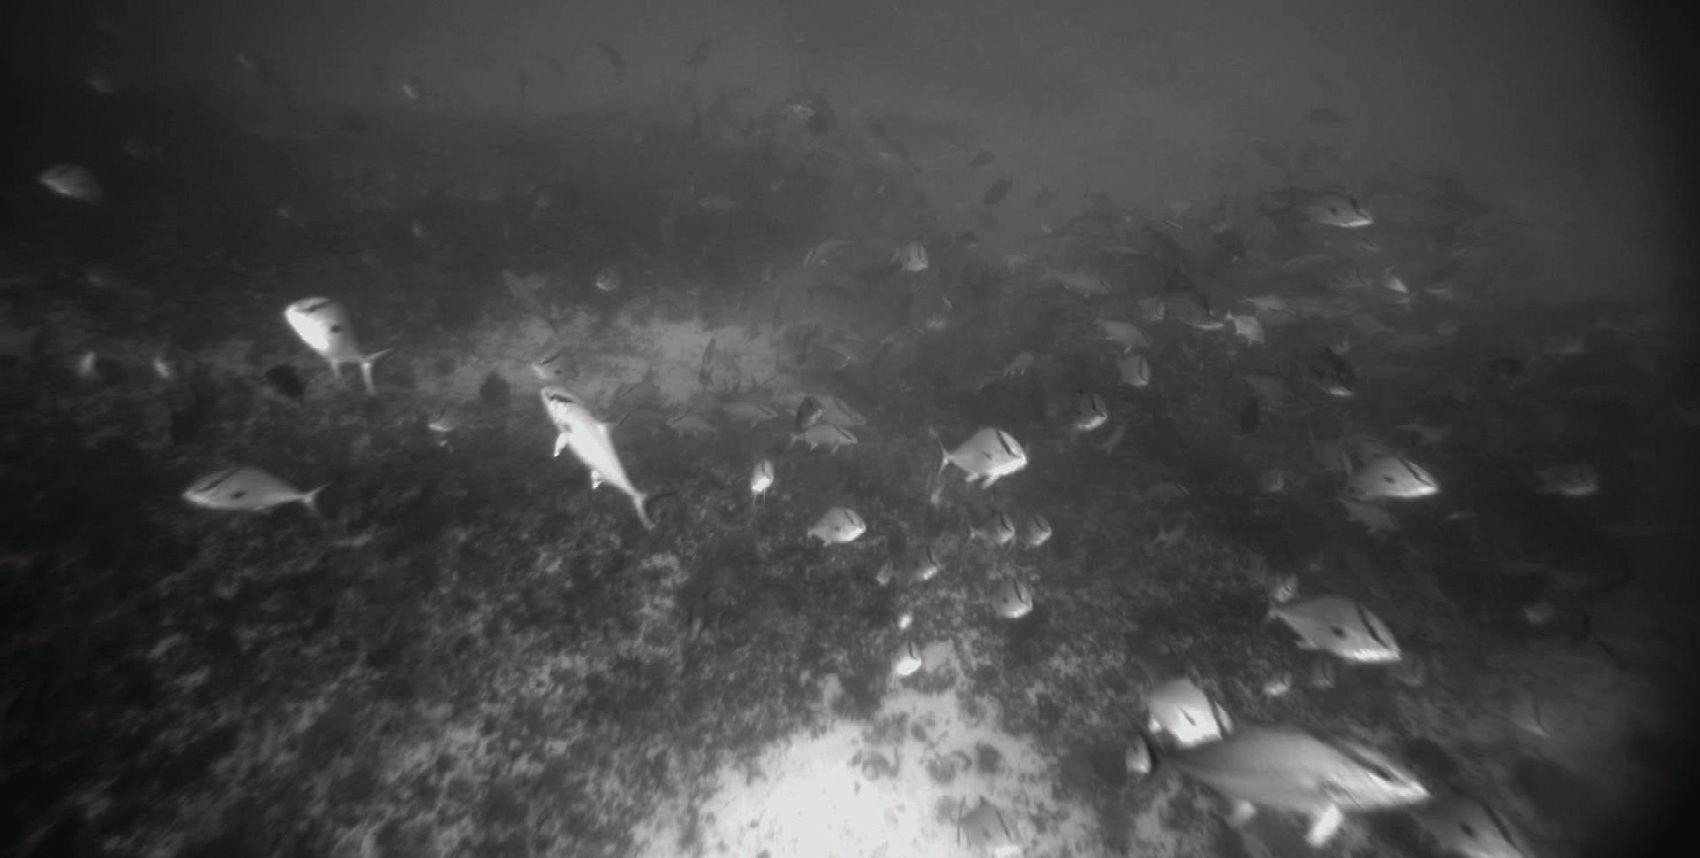
A large school of amberjack imaged by the C-BASS in the Elbow, a popular offshore fishing area west of Tampa Bay.
Narrowing the Scope
Considering the enormity of the West Florida Shelf and the comparatively modest scale of C-SCAMP’s scope, it was necessary to prioritize and focus efforts. When the project began in mid-2015, team members combed through database after database to find any and all existing datasets of highresolution bathymetry maps available for the WFS. Upon doing so, they found that only approximately 5% of the WFS had publicly available bathymetry data.
To further prioritize efforts, the group consulted with experts from the United States Geological Survey (USGS), Florida Fish and Wildlife Research Institute (FWRI), the National Marine Fisheries Service (NOAA-NMFS), Gulf of Mexico Fishery Management Council, Ocean Conservancy, as well as other academic institutions and the commercial and
recreational fishing industries. This helped round the team’s diverse set of knowledge, which includes marine technology, computer science, mechanical and electrical engineering, geology, and biology. By combining their skills with the committee’s expertise, it was time to decide where to begin mapping. By the end of their first meeting, they settled on focusing efforts in the region between the Florida Middle Grounds and the Steamboat Lumps Marine Protected Area.
Aside from collecting heaps of data, C-SCAMP is creating a single, easily digestible map. By combining the depth, shape and composition of the seafloor with the video-based information, they can better understand what characterizes the different
neighborhoods of the West Florida Shelf. Just like a satellite image of the land, they are generating maps that guide us to where different species live.
By the time this part of the project ends in mid-2019, C-SCAMP hopes to double the amount of publically-available bathymetry maps available for the West Florida Shelf and bring the total coverage closer to 10%. This may not seem like much, but just consider it took over 10 years for the first 5% to be completed.
It is the hope that C-SCAMP’s efforts, alongside others in the Gulf of Mexico, are just the beginning of large-scale mapping in our coastal seas. And who knows? Perhaps one day it will be just as quick and easy to pull up maps of the seafloor on your phones, tablets and computers as it is today for their landbased counterparts. For more information, additional maps and video, please visit C-SCAMP’s website at www.marine.usf.edu/scamp. As the project progresses, mapping products will be continually updated with downloadable KML (Google Earth compatible) and GeoTiff (Geographic Information System Program compatible) files that are for open use. Please email cscampdata@usf.edu for further questions and assistance. The project’s data is also archived and served through the National Oceanic and Atmospheric Administration’s National Centers for Environmental Information. This work is made possible through the National Fish and Wildlife Foundation (NFWF; GEBF Grant #45892) and the University of South Florida’s College of Marine Science. The author would also like to acknowledge and thank the lead investigators of this project, Dr. Steven Murawski, Chad Lembke and Dr. Stanley Locker, as well as the rest of the C-SCAMP members for their hard work.
Follow us on Twitter! @CSCAMPscience Find us on YouTube! C-SCAMP Videos

Above: A 3-D rendering of the M/V Holstein which sunk in fall of 1992 during a large storm. Photo by Matthew Hommeyer. Below: The Camera-Based Assessment Survey System (C-BASS) resting on the aft deck of the R/V Weatherbird II during a research cruise. Photo by Chad Lembke