THROUGH EDUCATION AND STEWARDSHIP IN THE LAKE CHAMPLAIN BASIN AND BEYOND
This curriculum was developed by Lake
and the
for use with schools across the
Champlain Sea Grant, UVM Extension,
Lake Champlain Committee
Lake Champlain Basin and beyond.

This curriculum was developed by Lake
and the
for use with schools across the
Where you see this icon you can take your learning to the next phase by visiting go.uvm.edu/stormwater

ACKNOWLEDGEMENTS DEVELOPED BY:
The health of Lake Champlain and other waterbodies in the Lake Champlain basin, which lies within portions of Vermont, New York and Quebec, are negatively impacted by nonpoint sources of pollution, including phosphorus, nitrogen, sediments, chloride, and bacteria. All of this pollution is carried to waterbodies in stormwater runoff. Thus, it is critical that everyone understand what stormwater is, and how to help clean it and reduce its volume before it enters local waterways.
Stormwater is water from rainfall and melting snow or ice that moves over the land, collecting pollutants as it makes its way to lakes, ponds, streams and other surface waters. In urban areas, stormwater reaches surface waters more quickly and in larger volumes during and immediately following rain events than it does in natural areas. This is due to the many impervious surfaces in urbans areas that prevent stormwater from infiltrating into the ground. Conversely, in natural areas, stormwater can more easily soak into the ground. It then makes its way slowly through the ground, recharging surface waters consistently from beneath.
This curriculum is designed for teachers to use to guide students to:
• Understand watersheds and the impact that stormwater can play within them;
• Identify possible sources of stormwater in their communities; and
• Engage in a stewardship project that helps clean and minimize stormwater runoff to surface waters.
• Lead others to engage in stormwater stewardship.
This curriculum can be used on its own or in conjunction with the Lake Champlain Sea Grant and UVM Extension Watershed Alliance Stream Monitoring and Stewardship program.
The curriculum is divided into four sections that align with the learning objectives. In Section 1, students learn about stormwater and its movement through watersheds, and the types of pollutants that stormwater can carry to surface waters. In Section 2, students learn to monitor and measure stormwater, and they are introduced to green stormwater infrastructure as a mechanism to treat and reduce stormwater runoff from a property. Activities are designed to engage students to make recommendations about green stormwater infrastructure practices for their school grounds and local communities. In Section 3, students engage in a stormwater stewardship project. These are separated into three tiers based on complexity and cost of the project. In Section 4, students take action to engage others in stormwater stewardship activities.
Teachers have the option to carry out the curriculum in its entirety or to use guidance provided to engage students in any individual activity or grouping of activities. Each section includes an overview with guiding questions, student learning objectives, Next Generation and Common Core Science Standards, a list of activities and materials, preparation guidelines for educators, activity descriptions, resources for additional information, and background reading and worksheets for students. Key terms are listed in bolded red font and defined in a glossary at the end of the curriculum. Background information and worksheets designed for student use are marked in the upper righthand corner to aid in locating those resource pages within the curriculum.
What is a watershed?
What is stormwater?
What are point source pollution and nonpoint source pollution?
How does stormwater move through a watershed and influence movement of nonpoint sources of pollution?
Students will be able to:
OBJECTIVES
STANDARDS
• Describe a watershed.
• Describe stormwater and how it impacts watersheds.
• Identify examples of nonpoint source pollution, discuss how it occurs, and compare and contrast it with point source pollution.
Next Generation Science Standards:
MS-ESS3-4. Earth and Human Activity: Construct an argument supported by evidence for how increases in human population and per-capita consumption of natural resources impact Earth’s systems.
Common Core State Standards: ELA/Literacy
RST.6-8.1 Cite specific textual evidence to support analysis of science and technical texts.
WHST.6-8.1 Write arguments focused on discipline content.
WHST.6-8.9 Draw evidence from informational texts to support analysis, reflection, and research.
1.1 Pre-Assessment (25 minutes)
1.2 Watershed in a Box (25 minutes)
1.3 Delineating a Watershed (25 minutes)
1.4 Stormwater in Your Community (25 minutes)
1.5 Stormwater Flow Path Map (50 minutes)
1.6 Stormwater Pollution Map (50 minutes)
1.7 Stormwater in the News (25 minutes)
1.8 Debrief and Wrap up (25 minutes)
✓ Copies of appropriate grade-level pre/post-assessment (1.1)
✓ Supplies listed in the Watershed in a Box activity (1.2)
✓ Copies of topographic map (1.3)
✓ Copies of “Streams in the City: It’s a Hard (Surface) Life” article (1.4)
✓ Copies of “Everything is Connected in a Watershed” article (1.4)
✓ Flip charts with areas written on them (1.4)
✓ Copies of school footprint and stormwater flow map activity directions (1.5 and 1.6)
✓ Copies of Stormwater in the News worksheets (1.7)
✓ Clipboards
✓ Pencils
• Watch Smart Waterways video.
• Read pages 1-3 of the Vermont Guide to Stormwater Management for Homeowners and Small Businesses.
• Obtain or print topographic maps for student use. One is provided (Activity 1.3), but you may choose to download a topographic map of a stream or river local to your school for free from an online source.
• Read Streams in the City: It’s a Hard (Surface) life and Everything is Connected in a Watershed (Activity 1.4). These provide useful background information about stormwater and the impact of urbanization and nonpoint sources of pollution on water quality and quantity in streams.
• Obtain or create a footprint of the school building and grounds on a sheet of paper for students to use for their stormwater flow path and pollution analysis maps in Activities 1.5 and 1.6. (Hint: Use Google Maps for an aerial view of the footprint of buildings.)
A pre-assessment quiz is included to help teachers understand what their students know before the unit begins. It is expected that students will not be familiar with terms included in this pre-assessment.
MATCH THE FOLLOWING WORDS TO THEIR DEFINITIONS:
A. Watershed
B. Nonpoint source pollution
C. Impervious
D. Point source pollution
E. Stormwater runoff
F. Green stormwater infrastructure
G. Water quality
H. Pervious
I. Infiltration
J. Erosion
6. The area of land that drains to a waterbody
5. Pollution that comes from diffuse sources across the landscape
1. A surface that does not allow a liquid to pass through
10. Pollution that comes from a specific source
3. Water that falls to Earth as precipitation or that melts from the snow or ice and flows across the land
7. A practice that cleans stormwater on-site by mimicking nature, minimizing stormwater runoff
2. A measure of how clean the water is
4. A surface that allows a liquid to pass through
8. The process of stormwater soaking into the ground
9. The gradual removal of rock or soil due to natural earth processes that wear them away
How would having a lot of pervious surfaces on a school campus help to reduce stormwater runoff to local waterbodies?
Pervious surfaces would allow stormwater to infiltrate into the ground and be treated on-site (i.e., close to where it lands as it falls from the sky; as opposed to being moved to a different location to be treated). This would reduce the amount of water running across the land to reach nearby waterbodies.
Would you expect water quality in a stream next to a school to be negatively or positively impacted if less stormwater runoff flows over the land to reach it? Why?
Water quality in a stream next to a school would be positively impacted if less stormwater was reaching it, as stormwater can carry pollutants such as sediments and nutrients with it, which can contaminate the stream when a lot of them are present.
How is a watershed related to stormwater runoff?
A watershed is the area of land that drains to a lake or river, and stormwater runoff flows within a watershed, reaching that lake or river, or infiltrating into the ground before it reaches that waterbody.
MATCH THE FOLLOWING WORDS TO THEIR DEFINITIONS:
A. Watershed
B. Nonpoint source pollution
C. Impervious
D. Point source pollution
E. Stormwater runoff
F. Green stormwater infrastructure
G. Water quality
H. Pervious
I. Infiltration
J. Erosion
1. A surface that does not allow a liquid to pass through
2. A measure of how clean the water is
3. Water that falls to Earth as precipitation or that melts from the snow or ice and flows across the land
4. A surface that allows a liquid to pass through
5. Pollution that comes from diffuse sources across the landscape
6. The area of land that drains to a waterbody
7. A practice that cleans stormwater on-site by mimicking nature, minimizing stormwater runoff
8. The process of stormwater soaking into the ground
9. The gradual removal of rock or soil due to natural earth processes that wear them away
10. Pollution that comes from a specific source
How would having a lot of pervious surfaces on a school campus help to reduce stormwater runoff to local waterbodies?
Would you expect water quality in a stream next to a school to be negatively or positively impacted if less stormwater runoff flows over the land to reach it?
Why?
How is a watershed related to stormwater runoff?
A pre-assessment quiz is included to help teachers understand what their students know before the unit begins. It is expected that students will not be familiar with terms included in this pre-assessment.
1. What is a watershed and how does it relate to nonpoint source pollution?
A watershed is the area of land that drains to a waterbody. Nonpoint source pollution is pollution that comes from diffuse sources from across the landscape. Nonpoint source pollution moves through a watershed to reach a waterbody.
2. What does impervious mean?
Does not allow liquid to pass through.
3. Identify an area at your school or in your community that contributes to pollutants in stormwater runoff. What is the area? What potential pollutant(s) could be in this area and how would they impact water quality?
The parking lot is paved. As a result, it doesn’t allow water to infiltrate. This causes water to runoff quickly to storm drains or local waterways. The runoff carries pollutants that accumulate on the impervious surface, such as salt, litter, oil and sediment.
4. What do green stormwater infrastructure practices aim to do?
Green infrastructure aims to slow the flow of stormwater and treat stormwater before it enters waterways.
5. How is stormwater runoff -- and as a result, streamflow -- different in urban areas as compared to rural areas? Why?
Stormwater runoff in urban areas flows across many impervious surfaces in urban areas. This makes streamflow rise quickly during and immediately after storms, and then drop and remain at lower base flows following the storm as there is less groundwater inflow to the stream. Streams in rural areas have higher baseflows and are less flashy during and immediately following storms.
1. What is a watershed and how does it relate to nonpoint source pollution?
2. What does impervious mean?
3. Identify an area at your school or in your community that contributes to pollutants in stormwater runoff. What is the area? What potential pollutant(s) could be in this area and how would they impact water quality?
4. What do green stormwater infrastructure practices aim to do?
5. How is stormwater runoff—and as a result, streamflow—different in urban areas as compared to rural areas? Why?
Used and modified with permission from the University of Wisconsin-Madison and Wisconsin Department of Natural Resources’ Exploring Streams – Stream Monitoring Curriculum Guide.
• A baking pan (or any shallow box that is 12 " x 12 " or larger)
• Easel paper or newspaper (enough to provide each group of 2-4 students with several sheets)
• Aluminum foil
• Permanent markers
• Spray bottles (one per student group)
• Powdered drink mixes (two or three colors)


1. Tell the students that they are going to learn about watersheds and their connection to stormwater runoff. To begin, discuss watersheds and how water and pollutants can move within watersheds.
2. Ask students if they know what a watershed is. Share with them that a watershed is the area of land that drains to a single body of water like a stream, river, or lake. Watersheds range in size from very small to very large. For instance, small ponds have watersheds, as does Lake Champlain. Lake Champlain’s watershed is thousands of square miles in size. Ask students, “Who lives in a watershed?”
3. Have students read the following background information about watersheds. Either have them follow the guidance to create their own watershed at home or guide them through the procedure below to create a watershed and assess how land uses within the watershed may affect water quality.
Resources
University of Wisconsin-Madison, Wisconsin Department of Natural Resources. (2013.) Exploring Streams: Stream Monitoring Curriculum Guide. Stroud Water Research Center. (n.d.) Model My Watershed.
No matter where you live, the water quality in rivers, streams, lakes, and ponds is determined by what happens on the land around them. The area of land that drains to a waterbody is called a watershed
One watershed is separated from another watershed by a rise in land elevation. Depending on the landscape, this might be a subtle rise in the land, the crest of a hill, or something as large as a mountain chain. Rain or snow that falls on opposite sides of the high point in the land results in water flowing into different watersheds. Not all watersheds are the same. Some watersheds are hilly, while other watersheds are flat plains.
Precipitation that falls within the watershed can infiltrate into the ground through pervious surfaces or can remain on the surface. The precipitation that does not infiltrate into the ground flows over land, moving downhill from a higher elevation to a lower elevation. This is called stormwater runoff or just runoff. As runoff flows over the land, it can pick up soil, chemicals and other pollutants and carry them to lakes, ponds, rivers, streams and wetlands. In rural or agricultural areas, runoff can pick up materials such as pesticides, sediment and animal wastes. In urban areas, hard surfaces such as driveways, sidewalks, rooftops, and roadways prevent water from soaking into the ground. These are called impervious surfaces. As a result, the runoff, which can be contaminated with such things as road salt, heavy metals, or automobile fluids, flushes quickly into storm drains that often dump directly into streams and rivers.
Pollutants that do not have a single source are called nonpoint source pollution. Nonpoint source pollution originates from many different places across the landscape. In contrast, point source pollution originates from a single source, such as a factory or a pipe. The most common type of pollution in the United States today is nonpoint source pollution.
As water pollution flows downstream (i.e., from an area of higher elevation to lower elevation), what happens on the land in the upper part of a watershed has potential to impact a lower point in the watershed – such as a lake, a river, or a stream. It is important to remember that we all live in a watershed and we all have a role to play to help keep water clean from upstream to downstream.
1. Get a baking pan or a shallow box in which to build the watershed model.
2. Crumple pieces of paper or newspaper and position them in the bottom of the box to represent hills and land forms on the landscape. Be creative! Position the highest points near the box walls. Leave a gully or valley in the middle of the box to represent a stream or river.
3. Cover the land forms with a large piece of aluminum foil, shiny side up. Start in the middle of the box and gently press the foil into all of the hills and valleys, working your way towards the box walls. Push the edges of the foil up along the walls of the box and fold the foil over the edge of the box. Be careful not to tear the foil.
4. With a permanent marker, draw on the foil to mark the streams and rivers that flow from areas of high elevation in your watershed model to areas of lower elevation.
5. Draw houses, roads, farm fields, feed lots, stores, or anything else that you want in your watershed model.
6. Sprinkle a little bit of different colors of powdered drink mix onto the watershed model. The colors represent different kinds of pollution. For example:
• Use red powder to represent yard care chemicals and sprinkle it around the houses.
• Use green powder to represent salt on the roads or automobile waste and sprinkle it along roadways and parking lots.
• Use brown powder to represent exposed soil at a farm field or a construction site.
• Use blue powder to represent human or animal waste and leave little piles of powder near homes and farms.
7. Answer this question: What do you think would happen to the pollution that is on the land if it rained in this watershed?
8. Using the spray bottle to represent a rain storm, spray water on the hillsides. Watch the water flow toward the rivers and streams.
9. Answer the following three questions:
i. What happened?
ii. What types of water pollution exist in your watershed?
iii. How would you redesign what happens on the land in the watershed to prevent water pollution?
10. Dump the water from the model into a bucket or sink.
11. Remove the foil from the model and set it aside.
12. Place a new piece of foil on the watershed, and draw a new community.
13. Redesign the land uses in the community in your watershed to prevent water pollution.
14. Sprinkle powdered drink mix in the appropriate areas in the watershed using the same colors you used before.
15. Make it rain with the spray bottle.
16. Answer the following two questions:
i. Was there an improvement the amount of water pollution you observed?
ii. Why or why not?
• Topographic map(s)
• Pencil(s)
1. Tell students they will be learning to read a topographic map so they can outline the boundary of a watershed. This is called delineating a watershed.
2. Ask students to think about what features on the land might form a watershed boundary (i.e., high points in elevation).
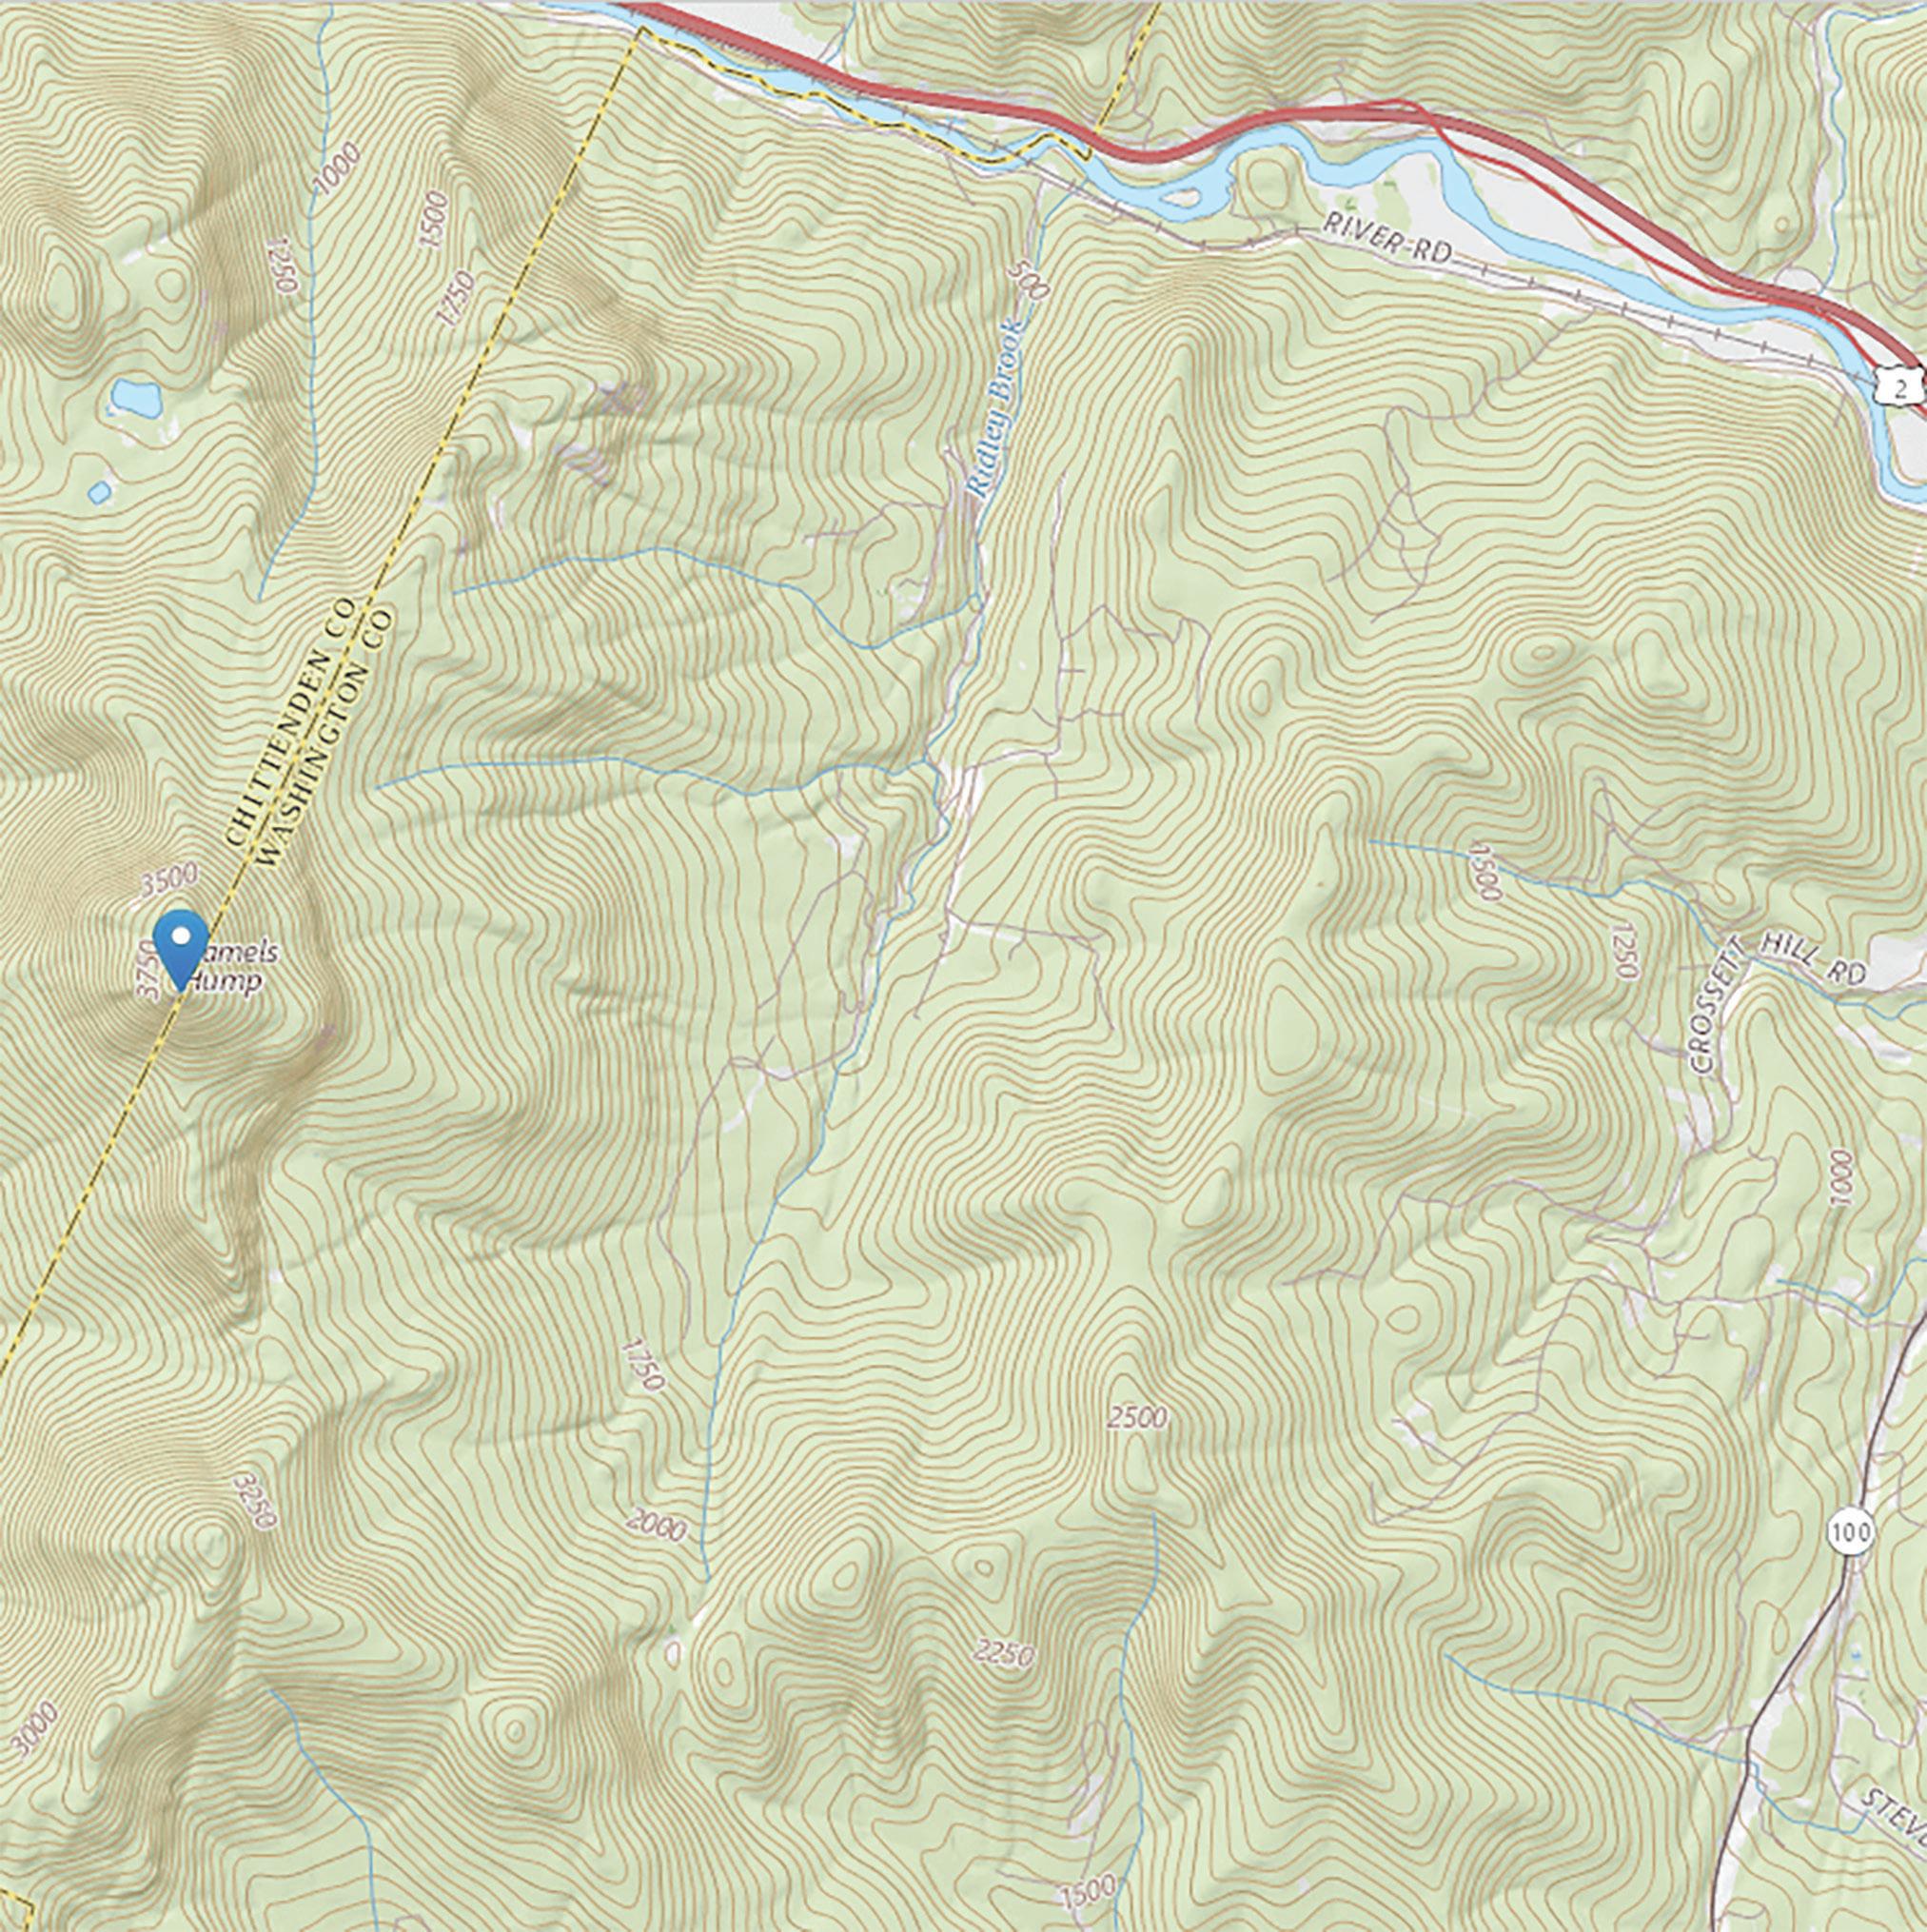
3. Show students a topographic map and have them identify the types of features shown on the map (e.g., contour lines, rivers, streams, lakes, wetlands, roads, buildings, etc.).
4. Provide students a topographic map and have students find a river on a common topographic map. You might have them mark the river by tracing it with blue marker.
5. Have students mark the junction point between that river and a river or lake downstream with a square that has a point in the middle. This is the mouth of the river, also known as the outlet See Map 1.3a
6. Explain that contour lines, marked in brown on the topo map, show lines of equal elevation. When contour lines form a circle or an oval, a peak in elevation is indicated.
7. Have students mark the high points they observe on the topo map with dots or Xes. See Map 1.3b
8. To delineate a watershed boundary, have students begin at the marked outlet point and draw a line to connect the high point dots or Xes from one side of the river to the other. Explain that the lines they draw must cross contour lines at a 90-degree angle (i.e., the watershed boundary line should be drawn perpendicular to the contour lines). The watershed boundary line should ultimately surround the river and not cross any other streams or rivers. See Map 1.3c


1. In preparation for this activity, show students or have them watch the Smart Waterways video.
2. Have students read Streams in the City: It’s a Hard (Surface) Life and Everything is Connected in a Watershed
3. Tell students that they are going to learn about stormwater in their community and solutions to protect our watersheds. First, they are going to learn about stormwater and types of pollution that can move across the landscape in stormwater.
4. Ask students to think back to the last time it rained or when snow or ice melted. The water that fell as precipitation, or that melted from the snow or ice is stormwater. When that water moves across land instead of seeping into the ground it is called runoff
5. Pervious surfaces, especially plants and healthy soils help to reduce runoff by allowing water to infiltrate or seep into the ground. Hard, impervious surfaces like roads and roofs make more runoff because the water cannot seep through them into the ground.
6. Runoff from different land surfaces can pick up pollutants as the runoff moves across land. The runoff transports the pollutants to streams, rivers, and lakes, where the pollutants impact aquatic ecosystems
7. Tell students that they are going to learn about some of the common ways that pollutants can enter our waterways.
8. Tell students that the examples in Streams in the City: It’s a Hard (Surface) Life and Everything is Connected in a Watershed demonstrate how some of our activities at our homes and in our communities can impact our watershed, but these are not the only types of or ways that pollutants enter streams, rivers, and lakes.
9. Tell students they are going to do an activity where they brainstorm the different types of pollutants that possibly may be carried in stormwater runoff.
10. Label a piece of flipchart paper with each of the following: forest, meadow, fertilized crop field, parking lot, dog park, roof, and road. Distribute the flipchart papers around the classroom. There should be one flipchart paper per station in the room. (Alternatively, Jamboard may be used to complete this activity remotely.)
11. If working in the classroom, break students into small groups and send each group to a different station to begin the activity.
12. Round 1: Give students three-to-five minutes at the first station to brainstorm and identify the types of pollutants that potentially could be found in stormwater runoff from these places. Potential pollutant types they identify may include, but are not limited to:
• Litter
• Pesticides
• Sediment
• Heavy Metals
• Bacteria • Nutrients
• Salt
13. After three-to-five minutes, or when students appear to be done brainstorming, have them rotate clockwise around the room to the next flipchart station. (If using Jamboard with your students, have them rotate through each tab within the Jamboard.)
14. Round 2: There are three parts to this round:
a. Upon arrival to the new station, give the groups three minutes to read the types of pollutants already identified for that area.
b. Next, have them add any additional types of pollutants to the list they can identify.
c. Finally, have each student place checkmarks next to the two pollutants they think are most common for that area. (If using Jamboard, have students add an asterisk to the post it.)
15. Round 3 (optional, if time allows): Have students rotate to a third station, review the list of pollutants identified so far, and mark the top two pollutants they expect to exist in that land area.
16. Round 4: Have the groups return to their first station and:
a. Give them a few minutes to review their flipchart and identify which pollutants have the most votes.
b. Have each group share the most common type of pollutants at their area.
c. If time allows, have them discuss why these are the top pollutants and what their sources may be.
Used and modified with permission of US EPA.
Close your eyes and imagine a cool, running stream. What comes to mind? Green forests? Leaping trout? Hot days? You probably don’t envision skyscrapers, city sidewalks, or busy streets.
Streams are an important part of every landscape, no matter whether that landscape is a forest, a city, or a suburb. They are often hidden from view in cities, but rest assured, streams are there, while sometimes directed to flow under sidewalks, they can often be observed meandering past ball fields, and rippling by shopping centers.
Streams, stream banks, and the low lands around them provide important habitat for animals and plants that share the landscape with us. Streams are also part of the network of channels that drain rain and melting snow off our streets, parks, and yards. This rain and melting snow and ice that runs across the land on its way to streams is called stormwater.
Streams in a town or suburb are usually very different from streams in a forest or other natural area. Urban streams tend to carry more water at a faster speed during and soon after a storm, and less water over time than streams in the country. This has to do with what happens to rain after it hits the earth’s surface. In forests, meadows, and other natural areas, about half the water that falls to earth soaks into or infiltrates the soil. Most of the water that remains on the ground, in the grass, on tree leaves, or on other plants gets returned to the atmosphere by evapotranspiration, a combination of evaporation and transpiration (loss of water vapor by plants). Only a small portion of rainfall (about 10 percent) travels across the land as runoff and drains into a surface waterbody.
When rain falls in urban areas on all of the houses, buildings, streets, and parking lots, it doesn’t land on nice soft ground and plants. Instead it hits impervious surfaces like hard pavement and rooftops and has no chance to infiltrate the soil. Instead, stormwater flows across the impervious surfaces, moving downhill into street drains and ditches and then into streams. The panels below illustrate how the fate of rainwater changes as cities grow.


In a natural landscape, about half the precipitation that falls soaks into the soil.

The land is more impervious in cities. Instead of soaking into the soil, most of the precipitation runs off hard surfaces into storm sewers, which usually empty directly into streams, lakes, and ponds.
A hyrdograph is a graph that shows stream flow over time. This hydrograph shows how stream flow changes as a watershed goes from natural land cover (pre-development) to an ubanized land cover (post-development).
Used with permission from UW-Madison and WDNR Water Action Volunteers program
Scientist use percent imperviousness to describe how much of a given area is covered by hard surfaces. Many cities have areas that are 75 to 95 percent impervious. This means that most of the rain that falls will not infiltrate into the soil and instead will flow across streets and parking lots, carrying pollutants from those surfaces such as sediment, metals, oils, and nutrients to local waterbodies. This results in:
• More Flooding During Rainstorms
In natural areas, streams only have to carry a small portion of rain that falls, since much of it will be intercepted by trees or will infiltrate into the ground where it can move more slowly before eventually entering a stream. However, in cities streams must carry most of the rain that falls soon after it falls. Natural channels easily become overwhelmed when a big storm hits. The extra water can overflow and erode the banks and flood the surrounding land and buildings.
• Less Flow During Dry Times
In a natural system, water that infiltrates into the ground will move slowly along underground and eventually empty into stream channels. This may happen hours, days or even months or years after soaking into the soil. This groundwater provides water to the stream channel even during dry times. When impervious surfaces prevent infiltration of rainwater, there is less groundwater to move into the channel over time.
• Wider Channels with More Sediment in Them
Imagine rushing water moving down a channel after a rainstorm. Everything in its path that is not tied down or too heavy to move gets carried away. This includes all the loose sand, sediment, and dirt on the banks of the stream. Over time, pulses of rushing water erode the banks away and the channel gets wider and wider. Wider channels also allow stream water to heat up from the sun, raising temperatures and decreasing oxygen holding capacity of the water, both of which can be harmful to fish.
• More Sand and Sediment on the Channel Bottom
Urban streams generally have more sand and sediment at the bottom of their channels than streams in the country. Part of this material comes from eroding stream banks. A large fraction, however, is carried to the streams by stormwater runoff that washes the pavement and land clean. When stormwater runoff reaches the stream, it drops its load of sediment on the bottom of the channel.
Used and modified with permission of US EPA.
Actions we take on the land have strong potential to impact water quality in a nearby stream, river, lake, pond or wetland. That is because of a type of pollution called nonpoint source pollution, which is pollution that comes from diffuse sources across the landscape. Find out below about some of the primary types of nonpoint source pollutants that can negatively impact water quality.
Many cleaning products contain chemicals that can make fish and other aquatic life sick. This is particularly important to know if you or a family member washes your car at home. Using a hose to wash off suds creates a stream of wastewater that can travel down your driveway, into the street, and down a storm drain. Unfortunately, at the other end of your storm drain there is usually a stream!
Car owners can help protect streams by minimizing stormwater runoff when they wash their car if they:
✓ Use a bucket instead of a hose to save water and limit flow;
✓ Wash the car in sections and rinse it quickly using the high-pressure flow on an adjustable hose nozzle;
✓ Use biodegradable soaps;
✓ Park the car on gravel or lawn when washing it so that wastewater doesn’t flow into the street.

Motors must be maintained if you want them to work properly. Oil, gasoline, brake fluid, degreasers, and antifreeze are a few of the products that are necessary, but which products contain chemicals that can harm aquatic life if they get into a stream, lake, or wetland. One gallon of used oil can ruin a million gallons of fresh water—a year’s supply for 50 people.
If someone accidentally spills these products on the ground when they are working, the spilled product should be cleaned up quickly. If it isn’t, the next rainstorm will pick them up and carry the spilled products to the nearest stream. Some chemicals are chronically toxic and cause harm over time. Other chemicals are acutely toxic and can cause immediate harm or death to insects, fish, and animals within 96 hours or less (e.g., antifreeze, which is toxic to pets, has a sweet taste that cats and dogs love).
Anyone working with motors and chemical products can help prevent hazardous substances from getting into natural waterways if they:
✓ Use the product only when necessary and follow directions on the product so that you use only the amount needed. When it comes to hazardous chemicals, more is not better.
✓ Clean up any spills immediately. (Wear protective clothing and gloves.)
✗ Never flush chemicals down the toilet or pour them onto the ground or into a storm drain.
✓ Dispose of used oil and other hazardous products in a safe manner. Participate in collection programs or take products to collection centers for disposal.

Used and modified with permission of US EPA.
Too much fertilizer applied at the wrong time can be very harmful to grass. It can cause disease, weeds, and poor root growth and make your lawn less able to withstand periods of heavy rain or dry weather.
In addition, the same rains that pickup oil, gas, and other hazardous chemicals and move them across the landscape with stormwater runoff can also pick up excess fertilizer and carry it to a lake or stream. Instead of making grass grow in your front yard, this fertilizer can make algae and weeds grow in the water.
You can have a nice-looking lawn and still keep streams and ponds healthy if you:
✓ Use native grasses that do not have high fertilizer requirements.
✓ Test the soil to find out exactly what nutrients your lawn needs.
✓ Apply fertilizer only when it is needed, during the right season (i.e., in the early fall), and in proper amounts.
✗ Do not leave fertilizer on driveways and sidewalks where it can be picked up and washed away by runoff from the next storm.
✗ Do not fertilize if a storm is predicted.

Pet poop is a potential type of nonpoint source pollution. Pet feces contain a lot of bacteria that can contaminate streams, lakes, and ponds. One study found that a single gram of dog feces contains 23 million fecal coliform bacteria. In a densely populated watershed in Arlington, Virginia, scientists estimated that dogs deposit more than 5,000 pounds of poop each day.
People can help reduce the amount of pet waste entering local streams if they:
✓ Pick up after pets and throw the poop in the trash can.
✓ Ask your town to set up pet waste stations that provide dog walkers with free plastic bags for picking up poop.

1. Tell students you are going to walk around the school campus. Alternatively, students can walk through their neighborhood. The goal is to create a map to identify where stormwater is likely to flow during a rainstorm or when snow melts. (With younger students, you may want to have them take a walk without any map-making supplies first, just to observe the landscape.)
2. Tell students they will draw a map that should include features of the school campus or neighborhood that help them to identify the location. For instance, they might include buildings, roads, walking paths, or other fixed features (e.g., lamp posts).
3. Tell students they will need to practice good observation skills to create stormwater flow maps. Have them think back to the watershed in a box activity. What direction did the stormwater runoff flow (downhill)?
4. Tell students to look for high points and low points in the landscape and mark or draw those on their map.
5. They should also look for, and mark on their maps, sources of stormwater and places where stormwater will flow to. Ask them what features they might observe on the landscape that indicate stormwater would flow towards that point (e.g., a storm drain, a stream). Similarly, ask them what features might be sources of stormwater (e.g., a downspout from a building roof).
6. If conditions are safe and students are mature, you might suggest they take a tennis or other type of ball with them to test what direction is downhill from any point where they stand. By placing the ball on the ground and seeing the direction it rolls, students can visualize the path that stormwater will take to make its way from high points to low points in the landscape. The path the ball takes will represent the path of the arrows the students will draw on their maps.
7. Let students know that they can create a rough draft map on their walk and take a lot of notes, then complete their final stormwater flow path map once back inside.
8. Let students know they will need writing utensils and something to write on. Providing students with a base map of their school campus as a starting point is helpful.
9. Depending on the situation, students may walk around the school campus or their neighborhood on their own or in pairs or small groups to make their maps.
10. Students should take 20-30 minutes to record observations on their maps before returning indoors.
11. If possible, have students revisit the site where they created their maps during a storm to check if their mapped flow paths align with the real flow of stormwater.
Resources
1. Tell students they are going to return outside for a walk around the school campus or through their neighborhood to add detail to their stormwater flow path maps.
2. Discuss with students the definitions of pervious (i.e., allow water to infiltrate) and impervious (i.e., do not allow water to infiltrate) surfaces.
3. Tell students they will need to mark their stormwater flow path maps to indicate what surfaces on the school campus or in their neighborhood are pervious to infiltration and which surfaces are impervious to infiltration. Have them create a legend and, when they go outside, mark these areas in a consistent manner on the map.
4. Tell students that they also will be making observations about possible sources of pollution from the various landscapes on the school grounds or in their neighborhood. Discuss the types of pollutants they identified in Activity 1.3 and have them add these to their map legends. These may include:
• Litter
• Pesticides
• Fertilizer
• Oils and metals from cars
• Salt
• Eroded soil/sediment
5. Let students know that, in addition to their stormwater flow path maps, they will need writing utensils and something to write on.
6. Depending on the situation, students may walk around the school campus or their neighborhood on their own or in pairs or small groups.
7. If carrying out the activity during a class period on school groups, give students 20-30 minutes to record observations on their maps before returning to the class. Alternatively, have students complete their stormwater flow path maps on their own at home.
1. Tell students that stormwater is not only part of your class activities, but that it influences people’s activities and qualities of life across the globe on a daily basis.
2. Ask students to identify ways that stormwater and stormwater runoff may impact local communities. You may choose to have students write their ideas down to begin, and then have them share with the group; or, if your format allows, you might have them work in pairs to identify ways that stormwater may impact communities, and then come together as a class to share what they identified in pairs.
3. Ask students to find a news story from the past few years that relates to stormwater and the types of issues communities are facing related to stormwater. You can set the geographic boundaries across which the students search. Depending on the age of students, you may want to discuss news sources for your area with them to help in their search. You may want to assign different students different news sources and time periods to avoid having all of the students find the same story.
4. Have the students complete the worksheet on the following page using the news story they found.
Name:
1. In what news source did you find a stormwater story?
2. In what community (i.e., city and state or city and country) is the stormwater issue?
3. In two sentences, describe what the stormwater issue is that is described in the story.
4. Does the stormwater issue have to do with any kind of pollution? If so, what type?
5. If there is a solution to the stormwater program identified in the story, describe that in one or two sentences. If there is not a solution to the stormwater problem identified in the story, share your ideas for a possible solution in one or two sentences.
1. Have students share their completed stormwater flow path maps with one another, comparing and contrasting predicted paths for stormwater and pollutants that might be carried in stormwater as it moves across different surfaces. This might be done as a gallery walk.
2. Have students share their “stormwater in the news” stories with one another. You might create a map of locations where stormwater stories were found and/or tally up the issues related to stormwater that were identified in the stories to see what commonalities exist among stories.
3. (Optional) If conditions and time allow, have students make observations to check their maps when stormwater is present and discuss where their stormwater site maps worked well and where they need adjustment.

GUIDING QUESTIONS
STUDENT LEARNING OBJECTIVES
What are some ways to capture, treat, and infiltrate stormwater? How much stormwater runoff do we need to manage?
• Students will learn about green stormwater infrastructure design solutions.
• Students will be able to calculate impervious area and volume estimates for stormwater design.
• Students will identify design criteria and make recommendations.
Next Generation Science Standards:
MS-ESS3-3 Earth and Human Activity. Apply scientific principles to design a method for monitoring and minimizing a human impact on the environment.
MS-ETS1-2 Engineering Design. Evaluate competing design solutions using a systematic process to determine how well they meet the criteria and constraints of the problem.
Common Core State Standards: ELA/Literacy
RST.6-8.3 Follow precisely a multistep procedure when carrying out experiments, taking measurements, or performing technical tasks.
RST.6-8.9 Compare and contrast the information gained from experiments, simulations, video, or multimedia sources with that gained from reading a text on the same topic. (MS-ETS1-2)
RST.9-10.3 Follow precisely a complex multistep procedure when carrying out experiments, taking measurements, or performing technical tasks, attending to special cases or exceptions defined in the text.
WHST.6-8.7 Conduct short research projects to answer a question (including a self-generated question), drawing on several sources and generating additional related, focused questions that allow for multiple avenues of exploration. (MS-ESS3-3)
WHST.6-8.8 Gather relevant information from multiple print and digital sources, using search terms effectively; assess the credibility and accuracy of each source; and quote or paraphrase the data and conclusions of others while avoiding plagiarism and following a standard format for citation. (MS-ESS3-3)
Mathematics
MP.2 Reason abstractly and quantitatively.
7.EE.3 Solve multi-step real-life and mathematical problems posed with positive and negative rational numbers in any form (whole numbers, fractions, and decimals), using tools strategically. Apply properties of operations to calculate with numbers in any form; convert between forms as appropriate; and assess the reasonableness of answers using mental computation and estimation strategies.
2.1 Green Stormwater Infrastructure (30 minutes)
2.2 Slow the Flow Experiment (30 minutes)
2.3 Green Stormwater Infrastructure Tour (30 minutes – 3 hours)
2.4 Recommend a GSI Practice (40 minutes)
2.5 Calculating Stormwater Runoff (60 minutes)
2.6 Monitoring Streams to Assess Road Salt (varies)
2.7 Debrief and Wrap Up (25 minutes)
✓ Copies of What is Green Infrastructure? (2.1)
✓ Copies of Vermont Guide to Stormwater Management for Homeowners and Small Businesses (2.1)
✓ Slow the Flow Materials (One experiment set) (2.2)
a. Foil cupcake/muffin pan (1/2 dozen)
b. 6 disposable plastic cups
c. 3 kitchen sponges
d. A roll of clear tape
e. 20-oz plastic soda bottle
f. Developed Surface cards
g. Green Surface cards
h. Baking sheet or tray with lip
i. A blue permanent-ink marker
j. Water-resistant tape
k. Scissors
l. Pen
m. Hammer and nail
✓ Copies of GSI Tour Maps for selected city (2.3)
✓ Recommend a GSI Practice activity worksheet (2.4)
✓ Estimating Drainage Area and Stormwater Volume activity worksheet (2.5)
✓ Specific Conductance Monitoring Data Sheet (2.6)
✓ Tape measures for students
✓ Projector/Smart Board
✓ Computer with internet access to look up rainfall data
✓ Clipboards
✓ Pens or pencils
• In this section, we introduce the concept of Green Stormwater Infrastructure (GSI). GSI uses nature-based approaches to capture and treat stormwater runoff on site. There are numerous GSI designs.
• Familiarize yourself with Green Stormwater Infrastructure and examples of different practices by reviewing Activity 2.1: Getting to Know Green Stormwater Infrastructure and reading the Vermont Guide to Stormwater Management for Homeowners and Small Businesses and the What is Green Infrastructure? handout in this curriculum. Both define GSI and describe examples of GSI practices.
• Gather materials needed for Activity 2.2: Slow the Flow
• To prepare for Activity 2.3, visit the Lake Champlain Sea Grant website to see the available GSI tours in Burlington, Montpelier, Rutland, and St. Albans. Print copies of the tour from the website or contact Lake Champlain Sea Grant to obtain pre-printed maps of the tour(s). The GSI maps will help students learn about GSI practices. Also, review the online options to “take” the tours; some are available as ESRI StoryMaps with supporting podcasts, which will allow students to take these tours virtually.
• For Activity 2.4, plan for your class to go outside to complete the Recommend a GSI Practice activity. Decide whether you will stick together as a class or break off in pairs or small groups for students.
• For Activity 2.5 Calculating Stormwater Runoff, you will need to:
» Identify the area that you will have students measure.
» Contact school maintenance personnel to find out where roof drainage flows if the students will be delineating a small drainage area for installation of a rain garden so you will know if, or what portion of, the roof should be included in their maps and measurements.
» Decide if you will have students use tape measures or their footsteps to determine the drainage area. If using student footsteps, measure out a distance (e.g., 20 feet) ahead of time so that students can count how many footsteps are equal to 20 linear feet.
» Familiarize yourself with the Vermont ANR Atlas if you will have students calculate a drainage area using that online tool.
» Decide if students will access rain data themselves or as a group, or if you will provide rainfall data to them.
• For Activity 2.6 Monitoring Streams to Assess Road Salt, preparation includes the following:
» Review road salt monitoring methods and determine how often you will have your class participate in monitoring. Depending on your situation, you may opt to collect water samples and bring them back to the classroom for students to measure specific conductance, or you may opt to take your class to monitor a nearby stream. If you have capacity, the general guideline is to monitor specific conductance monthly between April and November, and twice per month between December and March. You might choose to monitor more often if a winter storm is happening or if a thaw occurs.
» Ensure you have the needed equipment for monitoring, or arrange to borrow equipment from Lake Champlain Sea Grant.
» If you own the equipment, be sure to calibrate the meters before students use them.
» Select sites to monitor. If possible, it is best to monitor two sites: one upstream in an area not expected to be impacted by road salt, and one farther downstream in an area that may be impacted by road salt (e.g., if there are urban streets or parking lots salted in winter upstream of the monitoring site).
» Select sites in small streams that are no more than knee-deep in normal water flows.
» Print data sheets for students.
Resources
12,000 Rain Gardens. (2018). Green Solutions to Stormwater Runoff [Video]. Anonymous. n.d. Calibration steps for ECTestr11 and CTSTestr50. US EPA. (2011). Permeable Parking Lot Rain Garden [Video]. US EPA. (2016). Green Streets: The Road to Clean Water [Video]. US EPA. (n.d.). Soak Up the Rain: The Benefits of Green Infrastructure [Video]. US EPA. (n.d.). What is Green Infrastructure? Vermont Agency of Natural Resources. (2018). Vermont Guide to Stormwater Management for Homeowners and Small Businesses.
1. Explain to students that they are going to learn about different designs to improve management of stormwater using nature-based solutions.
2. Ask students if they know what green stormwater infrastructure is. To help them if they do not know, ask students if they have seen or heard of rain gardens or rain barrels. What are they? If the students have seen or heard of rain gardens or rain barrels, ask the student if they can explain how are those things supposed to help with stormwater.
3. Tell students that green stormwater infrastructure (GSI) is a name for the approach to managing stormwater that uses nature-based solutions on site to capture, filter, and absorb stormwater. GSI includes a suite of practices that are designed to mimic nature to both capture stormwater and treat pollution, helping to clean water where the green infrastructure is located and minimize stormwater runoff to local waterbodies. GSI practices include:
a. Rain gardens: landscaped depressions designed to capture, treat, and absorb stormwater.
b. Rain barrels: barrels that are designed to collect runoff from roofs to reduce the volume of stormwater runoff during rain events, and therefore pollutants that enter the watershed. Collected rain water can be used to irrigate (water) gardens and lawns during drier periods.
c. Permeable pavement: pavement that allows stormwater to infiltrate through it. This pavement can replace traditionally impervious surfaces in parking lots, sidewalks, roads, and driveways. It helps to reduce stormwater runoff and minimizes pollution to local waterways.
d. Constructed wetlands: wetlands that are designed to mimic the function of natural wetlands. Wetlands efficiently and effectively remove sediments and pollutants from stormwater and capture stormwater when it rains, reducing runoff.
e. Bioswales: vegetated channels of land that are designed to capture and redirect stormwater while filtering pollution.
f. Green roofs: specially designed roofs outfitted with plants that intercept rainwater before it becomes stormwater runoff. They promote evaporation through plants, known as evapotranspiration to reduce stormwater runoff from the building.
4. Tell students that, in addition to managing runoff, GSI can have other benefits. Ask students if they can think of any examples. These might include recreation, aesthetics, wildlife habitat, climate change adaptation and mitigation (e.g., helping us weather bigger storms and increasing carbon storage, respectively), temperature control, and pollination.
5. Tell students that we need lots of GSI designs and practices because our built environment and how we use it varies a lot. Landscape designers, engineers, stormwater managers, and water resource managers are studying GSI designs and different materials to find the most effective GSI solutions for a variety of landscapes and situations.
6. Have students watch Green Streets: The Road to Clean Water , read the What is Green Infrastructure handout, and complete the Activity 3.1 Worksheet: Getting to Know Green Stormwater Infrastructure. Advanced students may also read the Vermont Guide to Stormwater Management for Homeowners and Small Businesses to help them become more familiar with the types of GSI practices that exist in the region.
7. Have students play the GSI game to become familiar with the types of GSI.
Reprinted with permission from the United States Environmental Protection Agency (EPA).
Section 502 of the Clean Water Act defines green infrastructure as “...the range of measures that use plant or soil systems, permeable pavement or other permeable surfaces or substrates, stormwater harvest and reuse, or landscaping to store, infiltrate, or evapotranspirate stormwater and reduce flows to sewer systems or to surface waters.”
Green infrastructure is a cost-effective, resilient approach to managing wet weather impacts that provides many community benefits. While single-purpose gray stormwater infrastructure—conventional piped drainage and water treatment systems—is designed to move urban stormwater away from the built environment, green infrastructure reduces and treats stormwater at its source while delivering environmental, social, and economic benefits.
Stormwater runoff is a major cause of water pollution in urban areas. When rain falls on our roofs, streets, and parking lots in cities and their suburbs, the water cannot soak into the ground as it should. Stormwater drains through gutters, storm sewers, and other engineered collection systems and is discharged into nearby water bodies. The stormwater runoff carries trash, bacteria, heavy metals, and other pollutants from the urban landscape. Higher flows resulting from heavy rains also can cause erosion and flooding in urban streams, damaging habitat, property, and infrastructure.
When rain falls in natural, undeveloped areas, the water is absorbed and filtered by soil and plants. Stormwater runoff is cleaner and less of a problem. Green infrastructure uses vegetation, soils, and other elements and practices to restore some of the natural processes required to manage water and create healthier urban environments. At the city or county scale, green infrastructure is a patchwork of natural areas that provides habitat, flood protection, cleaner air, and cleaner water. At the neighborhood or site scale, stormwater management systems that mimic nature soak up and store water.
Learn more about green infrastructure elements that can be woven into a community, from small-scale elements integrated into sites to larger scale elements spanning entire watersheds.
Reprinted with permission from the United States Environmental Protection Agency (EPA).
This simple practice reroutes rooftop drainage pipes from draining rainwater into the storm sewer to draining it into rain barrels, cisterns, or permeable areas. You can use it to store stormwater and/or allow stormwater to infiltrate into the soil. Downspout disconnection could be especially beneficial to cities with combined sewer systems.

Rainwater harvesting systems collect and store rainfall for later use. When designed appropriately, they slow and reduce runoff and provide a source of water. This practice could be particularly valuable in arid regions, where it could reduce demands on increasingly limited water supplies.

Reprinted with permission from the
Rain gardens are versatile features that can be installed in almost any unpaved space. Also known as bioretention, or bioinfiltration, cells, they are shallow, vegetated basins that collect and absorb runoff from rooftops, sidewalks, and streets. This practice mimics natural hydrology by infiltrating, and evaporating and transpiring—or “evapotranspiring”—stormwater runoff.

Planter boxes are urban rain gardens with vertical walls and either open or closed bottoms. They collect and absorb runoff from sidewalks, parking lots, and streets and are ideal for space-limited sites in dense urban areas and as a streetscaping element.

Reprinted with permission from the
Bioswales are essentially rain gardens placed in long narrow spaces such as the space between the sidewalk and the curb. Bioswales are vegetated, mulched, or xeriscaped channels that provide treatment and retention as they move stormwater from one place to another. Vegetated swales slow, infiltrate, and filter stormwater flows. As linear features, they are particularly well suited to being placed along streets and parking lots.

Permeable pavements infiltrate, treat, and/or store rainwater where it falls. They can be made of pervious concrete, porous asphalt, or permeable interlocking pavers. This practice could be particularly cost effective where land values are high and flooding or icing is a problem.

Reprinted with permission from the United States Environmental Protection Agency (EPA).
Green streets and alleys are created by integrating green infrastructure elements into their design to store, infiltrate, and evapotranspire stormwater. Permeable pavement, bioswales, planter boxes, and trees are among the elements that can be woven into street or alley design.

Many green infrastructure elements can be seamlessly integrated into parking lot designs. Permeable pavements can be installed in sections of a lot and rain gardens and bioswales can be included in medians and along the parking lot perimeter. Benefits include mitigating the urban heat island and a more walkable built environment.

Reprinted with permission from the United States Environmental Protection Agency (EPA).
Green roofs are covered with growing media and vegetation that enable rainfall infiltration and evapotranspiration of stored water. They are particularly cost-effective in dense urban areas where land values are high and on large industrial or office buildings where stormwater management costs are likely to be high.

Trees reduce and slow stormwater by intercepting precipitation in their leaves and branches. Many cities have set tree canopy goals to restore some of the benefits of trees that were lost when the areas were developed. Homeowners, businesses, and community groups can participate in planting and maintaining trees throughout the urban environment.

Reprinted with permission from the United States Environmental Protection Agency (EPA).
The water quality and flooding impacts of urban stormwater also can be addressed by protecting open spaces and sensitive natural areas within and adjacent to a city while providing recreational opportunities for city residents. Natural areas that should be a focus of this effort include riparian areas, wetlands, and steep hillsides.
Land conservation is another good tool for communities to use for reducing the risks of stormwater runoff and sewer overflows.

Resources US EPA. (n.d.) What is Green Infrastructure?
Name:
What are two benefits of green stormwater infrastructure?
Describe three types of green stormwater infrastructure.
What is one new word you learned while reading about green stormwater infrastructure? What does it mean?
Used and modified with permission from the University of Pennsylvania Extension.
1. Tell students they will engage in an activity that simulates water movement on pervious and impervious surfaces to explore the impact of GSI best management practices on stormwater.
2. Follow guidance from the Slow the Flow activity on the following pages with your students.
Pre-Experiment: Preparing Your Community (pp. 2-15 – 2-16)
Experiment 1 – Stormwater Happens (pp. 2-17 – 2-21)
Experiment 2 – Stormwater Solutions (pp. 2-22 – 2-30)
Resources Pennsylvania State Extension. (n.d.). R ain to Drain, Slow the Flow. Pennsylvania 4H.
Used and modified with permission from the University of Pennsylvania Extension.
Time Needed: 20 minutes
Materials Needed:
A foil cupcake/muffin pan (half -dozen size)
3 standard cellulose kitchen sponges
A roll of clear tape
A 20-
Developed Surface cards (see pp. 2-27 to 2-29)
Green Surface cards (see p. 2-30)
A tray with a lip around the edge (baking sheet or similar)
A blue permanent-ink marker
Water-resistant tape
Scissors
Ballpoint pen
Hammer and a nail
1. Your muffin pan will be the base of a small community model, with using a ballpoint pen or nail of similar width. (Four holes surrounding a center hole works best.)
Leader Notes:
limited, most of this preexperiment can be completed in advance. If youth are not part of the pre-experiment set-up, make sure to review what each of the pieces represents and have the youth answer the part of a group discussion


2. Color the inside surfaces of one of the corner muffin cups using the blue permanent -ink marker. This will represent a body of water in your community It could be a lake, a stream, a river, or a storm drain
3 each of the other five muffin cups These other five muffin cups will sponges will act as the natural surfaces (soils with plant cover) at What types of bodies of water do you have in the community where you live?


Used and modified with permission from the University of Pennsylvania Extension.
4. Prepare the Developed Surface cards and Green Surface cards as instructed on the copy pages at the back of this guide.
5.Remove the cap and carefully poke 6 - 1 6 (down about an inch from the top) using


1 On the tray, place the muffin pan on top of six cups (all but the rain maker) so that the muffin cups each -colored cup under the blue coloring in the muffin pan
2 Place a sponge circle in each of five community parcels (the uncolored muffin cups) Make sure your sponges are moist and not dried out If you aren’t sure, soak them in water and then wring them out to keep them damp but not dripping.
3 blue cup (the opposite corner), and place the roll of tape underneath it This will create a hill in your community, with the waterbody at


Used and modified with permission from the University of Pennsylvania Extension.
Time Needed: 20 minutes
Materials Needed:

Your prepared and set-up community
Laminated Developed Surface cards (5 total)
Water
A liquid measuring cup, at least 8 -oz size
Calculator(s)
Leader Notes:
first, but youth will quickly get the hang of it as they repeat it throughout the experiment

This is a map of your community model in its natural state. No homes or businesses have been built here yet, and the five parcels of land are in the most natural
What was the natural environment like in the community where you live before people moved in with someone who might know the answer.)
Used and modified with permission from the University of Pennsylvania Extension.
1 community, so this will be a controlled variable in our experiment. Controlled variables stay the same throughout an experiment
2.
model (8 - 10 inches above) and pour in the water from your measuring cup. (You can move your rain maker over the model if you want, but the idea is model, but not outside the borders. )
3.
storm in your community by looking in the cups under the model.


1. Carefully slide the blue cup out from under the muffin pan and use the measuring cup to measure how many ounces of water were captured there
This represents the amount of the stormwater that rained directly in the body of water (lake, river, etc ) and also the stormwater that drained from your community into that body of water. When stormwater moves across the land and directly into a nearby body of water, we refer to it as runoff.
Record this runoff volume in the table.
2 The water in the other five cups, along with the water soaked up by the sponges, represents stormwater that infiltrated into the soil to become groundwater.
muffin pan off of the other five cups, and empty each of the five cups into the measuring cup as well.
Used and modified with permission from the University of Pennsylvania Extension.
Using the table, calculate what percentage of the stormwater became runoff, the percentage that infiltrated, and the percentage of stormwater we lost during our experiment.
Runoff into the local body of water (blue cup)
Total Volume Collected (ounces)
Total Volume of the Storm (ounces)
8 Infiltration into groundwater (all other cups and sponges)
8 TOTAL
8
Percentage of Stormwater Collected
What percentage of stormwater did you lose during your experiment? %
(Lost stormwate r should be 25% or less of the total stormwater; if it’s greater than that, you may want to repeat this part of the experiment while being more careful to direct your rain onto the community model. Small amounts of lost water could represent wa ter that evaporated or that was used by plants and animals in the community.)
Used and modified with permission from the University of Pennsylvania Extension.
In which community, natural or developed, did more water infiltrate into the groundwater?
In which community, natural or developed, did more water run off into the local body of water?
a flood during a storm:
If a community depends on groundwater to provide the drinking water for the people who live and work there, how might adding parking lots, buildings, and other similar surfaces impact the drinking
What are some ways to reduce the chances of flooding in your developed community?
Used and modified with permission from the University of Pennsylvania Extension.
Using your model community, you discovered the different ways that stormwater can move when it falls on the land In natural environments, the majority of stormwater soaks into the ground through runoff covered by impervious surfaces. Imper vious surfaces are surfaces that water cannot pass surfaces we saw in the developed community model in this experiment. As the Earth’s natural surfaces are covered with impervious surfaces during development, the amount of

As the amount of impervious surface increases, does runoff increase or decrease?
Used and modified with permission from the University of Pennsylvania Extension.
Time Needed: 30 minutes
Materials Needed:
Green Infrastructure photos (see pp 2-7 to 2-12)
Your prepared and set-up community
Water
A liquid measuring cup, at least 8 -oz size
Felt cut into a 4-inch square
-inch square
Laminated Green Surface cards (2 total)
Laminated Developed Surface cards (5 total)
Leader Notes:
A small set of green introduced in this stage of the experiment. A more complete list can be found in the glossary. Feel free to explore them all during this stage, and even create not addressed here.
Take a look at the photos provided on the Green Infrastructure copy pages in this book. These are photos of stormwater that runs off into local water bodies. They also help increase the amount of stormwater that is referred to as green infrastructure community that you could visit and explore
Below is a list of impervious surfaces found in a developed community Choose a green
Pavement Driveway:
Concrete Sidewalks:
Asphalt Parking Lot:
Concrete Town Square:
Used and modified with permission from the University of Pennsylvania Extension.
Thinking about the examples of green infrastructure you just saw in the photos, let’s redevelop your
Set up your community as follows:
1. Assemble your model community like before, with the tray placed over the six cups and a sponge in each
2. improve the surfaces represented on the development cards from the last steps of this experiment.
a Pervious pavers and stone pathways can replace concrete sidewalks or help to move water into
d Bioswales and curb cuts can be added to parking lots to allow water to drain into natural areas. (Place
e. Rain gardens can be added near homes and businesses to capture water running off of their
f Preserved open space and natural areas can be planned into a community instead of developing all of


where you live?
3. Developed Surface cards from the previous steps of the experiment. Remember to leave the body of water uncovered
Used and modified with permission from the University of Pennsylvania Extension.

homes and businesses built on each of the five parcels of land, but one property
1 Measure 8 oz of water in your measuring cup and then pour it in your rain maker cup while holding it over your community (8 - 10 inches above)
What types of forces are changing the way stormwater moves across the green infrastructure
Used and modified with permission from the University of Pennsylvania Extension.
Using the table, calculate what percentage of the stormwater became runoff, the percentage that infiltrated, and the percentage of stormwater we lost during our experiment.
Runoff into the local body of water (blue cup)
Infiltration into groundwater (all other cups and sponges)
Total Volume Collected (ounces)
Total Volume of the Storm (ounces)
Percentage of Stormwater Collected
8
8 TOTAL
8
What percentage of stormwater did you lose during your experiment? %
(Lost stormwate r should be 25% or less of the total stormwater; if it’s greater than that, you may want to repeat this part of the experiment while being more careful to direct your rain onto the community model. Small amounts of lost water could represent water that evaporated or that was used by plants and animals in the community.)
Used and modified with permission from the University of Pennsylvania Extension.
1. Print these pages singled-sided on card stock (65 lb or higher so that they stay flat and don’t curl).
2 Cut the individual cards out so that you have 5 total 4x4 -inch cards.

Used and modified with permission from the University of Pennsylvania Extension.
1 Print these pages singled-sided on card stock (65 lb or higher so that they stay flat and don’t curl).
2 Cut the individual cards out so that you have 5 total 4x4 -inch cards.


Used and modified with permission from the University of Pennsylvania Extension.
1 Print these pages singled-sided on card stock (65 lb or higher so that they stay flat and don’t curl).
2. Cut the individual cards out so that you have 5 total 4x4 -inch cards.

Used and modified with permission from the University of Pennsylvania Extension.
1 Print these pages singled-sided on card stock (65 lb or higher so that they stay flat and don’t curl).
2. Cut the individual cards out so that you have 2 total 4x4 -inch cards.
3. Use a pen knife or similar to cut out the marked areas from the card centers. 4
5 Use a pen knife to cut out the laminated area in the holes created during step 3. Leave a lip of
REMOVE THIS SECTION
1. Explain to students that you will be going on a GSI tour (either virtually or in-person) to better understand GSI practices, their benefits for stormwater management, and maintenance requirements.
2. As a group, review one of the bike or walking tour maps for either Burlington, Montpelier, Rutland, or St. Albans. Discuss the various practices that are featured, how they work, and, when possible, the maintenance required to keep it functioning properly.
3. Students should complete the Green Stormwater Infrastructure Tour Worksheet as you work through the tour.
4. If possible, have students take one of the tours in-person or virtually to learn more about the GSI practices.
Resources
Lake Champlain Sea Grant. (n.d.). Green Stormwater Infrastructure Tours.


Infrastructure
When it rains in the city, water hits impervious surfaces like roofs, roads, driveways, and sidewalks and runs off carrying with it pollutants that ultimately end up in our waterways. This runoff is called stormwater. Before cities were built, most of the rain that fell filtered into the ground to be used by trees and vegetation or to recharge the groundwater supply. Green Stormwater Infrastructure (GSI) works by mimicking natural conditions, employing vegetation, soils, or porous substrates to soak up stormwater in highly impervious urban settings. Using GSI to manage stormwater not only helps to improve river, lake, and pond water quality, but has the added benefit of beautifying our cities.
Practices you will see on this tour:


. Name(s):
1. City of GSI tour:
2. What is the purpose of GSI?
3. List the different types of GSI practices featured on the tour and briefly describe how each helps manage stormwater.
4. If you visited sites in person, describe what types of maintenance you think might be required to allow the GSI practice to continue to function as it was designed?
5. Name two practices from the list above that could be implemented on your school’s campus (or on the tour you did in your neighborhood) to help manage stormwater runoff. Why do you think they would be useful on your school’s campus or in your neighborhood?
1. After learning about the different types of GSI practices, tell students that they are going to make their own GSI recommendations using their stormwater flow path and pollution maps.
2. Tell students that they will pick one area from their maps to recommend a GSI practice. Students should have access to their stormwater flow path and pollution maps, the What is Green Infrastructure? handout, writing utensils, and something hard to write on.
3. Pass out the “Recommend a GSI Practice” worksheet to students.
4. In small groups, have students spend 25 minutes discussing the location and type of practice they recommend be installed on the school campus and creating a “sales pitch” for school administration that explains why they chose that particular GSI practice and what benefits it would have if it were installed.
5. Have students do a round robin where they share their ideas with classmates. Have students identify the proposed area for installing a GSI practice based on their stormwater flow path and pollution map and provide reasons for choosing that practice and area.

1. Identify at least one area from your stormwater flow path and pollution map that seems like it could use improved stormwater management. Describe that area below.
2. What challenges are you trying to address? Possible goals could be reducing stormwater flows, erosion, or sources of pollution.
3. Where does the stormwater flow from, and where does it drain to? Does your design change the direction of flow or volume of stormwater?
4. What GSI practice do you suggest putting here?
5. Why did you choose this practice? Did you consider:
a. Space requirements?
b. Function?
c. Appearance?
d. Other benefits?
1. Tell students that in this activity they will learn about an important step in designing GSI: how to be sure it is equipped to handle runoff from all of impervious surfaces that drain to it. To do this, they will learn how to measure how much water will flow to the green infrastructure practice in a common-sized rain storm.
2. Tell students that stormwater infrastructure needs to be built to be able to handle the amount (volume) of stormwater it is receiving. Ask students what volume means (the amount of space that a substance occupies; for stormwater in the United States, it is often measured in cubic feet).
3. Tell students that they will be calculating the volume of stormwater of a small watershed on school grounds. This could be a roof, parking lot, sidewalk or vegetated area, or a combination of these areas.
4. Help students understand the area they will be measuring.
a. If they will measure a roof or part of a roof (e.g., for a rain barrel installation), explain that they will estimate the area by measuring the footprint of the school building as a surrogate.
b. If they will measure the size of a small drainage area to a storm drain or other point to which stormwater drains on the school property (e.g., for a rain garden installation), students will need to look for high points on the land surrounding that low point, and draw a boundary line on their map that approximates the area over which water will flow to that drain/area during a rain storm. Help students understand that the drainage area may include part or all of the school building’s roof in addition to area on the ground, depending how the roof drainage is designed. Share information you have learned from school maintenance personnel with them, or have the school maintenance personnel share this information directly with students.
c. Let students know if this is the same drainage area for which you will be implementing a rain garden or rain barrel.
5. Get ready to go outside. Students will need measuring tapes, their site analysis maps, data sheets, writing utensils, and something on which to write.
6. Once outside, define boundaries of a small drainage area for students. For more advanced students, have students define the boundaries themselves by delineating a small watershed based on their assessment of where rain or snowmelt would flow to a certain low point (e.g., to a storm drain) based on the topography and elevation at the site. Have them draw this watershed area onto their stormwater flow path map.
7. Have students estimate the shape of the drainage area, selecting if it is somewhat circular, triangular, or square/rectangular.
8. Once students have completed these steps and decided on the shape of drainage area, have them draw that shape on their site analysis map on top of their drainage area boundary, being careful to draw the circle, triangle or rectangle/square as close as possible in size to the drainage area. They should try to draw the shape so that its boundary falls inside the watershed boundary line about half the time and outside the watershed boundary line about half the time. This will allow them to use the formula for a circle, triangle or rectangle/square to calculate area with their measurements.
9. Have students use the equations below to determine which components of the equations they must measure to determine area of a triangle, rectangle/square, or circle based on the watershed area they have drawn. Students can use a measuring tape or footsteps to measure.
• Square/Rectangle: length x width = Area
• Triangle: ½ (length of base x height) = Area
• Circle: π x radius2 = Area
10. If students are working on their own or in small groups, reconvene them and compare measurements. Draw the approximate drainage area on the board or display one group’s site analysis map with the watershed boundaries shown. Label the map with measured lengths appropriate to the equation to be used to calculate area.
11. Help guide the students to calculate the drainage area together, or for more advanced students, have them calculate it individually, and then have them share their results.
12. Explain to students that, in addition to the drainage area, they will need to determine how much rain will, on average, fall in a given year at your school site.
13. Ask students to suggest ways that average rainfall in a given location could be determined. Students might suggest measuring the rain during each rain storm over the course of a year and determining the average. You could introduce the concept of a rain gauge, which is a device that collects rainfall to determine how much it rains during a storm. Ask students to consider limitations of making these measurements themselves (e.g., it would take a long time to get an answer; one year might different significantly from another year). Introduce the Extreme Precipitation in New York and New England: Interactive Web Tool for Extreme Precipitation Analysis website to students, which provides amounts of precipitation over many years to allow people to design infrastructure appropriately without having to collect years of data themselves.
14. Explain to students that they will look up average rainfall data for your school to calculate the volume of stormwater runoff in an average size rainstorm and use this information to calculate how much runoff is generated from the drainage area they delineated.
15. Go to the Extreme Precipitation in New York and New England: Interactive Web Tool for Extreme Precipitation Analysis website
16. On the Extreme Precipitation website, go to the Data & Products tab, and enter your school’s address in the Locate by Address box. Check that the Extreme Precipitation Tables – HTML option is selected at the top left, and then click the Submit button at the bottom. A table will appear that displays average rainfall amounts for varied storm sizes.
17. Have the students look up the 2-year, 24-hour storm.
18. Have students write this amount on the Worksheet for Activity 2.5, number 2a. You may also opt to have students choose other storm sizes to allow them to calculate storm runoff volumes for varied storm sizes.
19. Explain to the students that another variable needed to determine the volume of runoff expected is the surface type of the drainage area. As discussed in Activities 2.1 -2.3, the amount of runoff depends on the type of surface: pervious surfaces allow water to infiltrate and thus have less runoff than impervious surfaces.
20. Explain that a runoff coefficient is used to estimate the proportion of rain that becomes runoff as it moves across pervious and impervious surfaces.
21. If there are multiple surfaces over which rain will flow as it moves to the drain or lowest point in elevation in drainage areas students have measured, have them do one of the following:
a. Estimate the percent of each surface type and use the appropriate coefficient for each, multiplying the percent of the area by the appropriate coefficient and then adding their results together.
b. Choose the predominant surface type and use only that runoff coefficient in the calculations.
c. Select the surface type that is most impervious and use only that runoff coefficient in the calculations.
You may opt to have different groups of students use each of these options and compare their results.
22. Have students calculate the volume individually using the Activity 2.5 Worksheet: Calculating Stormwater Runoff.
23. Have students share their results. If they used different runoff coefficients, how did their results differ?
24. Storm drains and GSI practices are designed to handle a certain amount of stormwater. The following discussion questions can help frame a class conversation about installation of GSI practices:
a. Why wouldn’t we want to build storm drains and rain gardens for additional stormwater just to be safe? Answers might include: expense, potential waste of resources, could use up too much space, or be too technically complicated.
b. How might climate change impact stormwater? Might there be value in building storm drains and rain gardens to accept more water than expected in a two-year storm? The conversation might include mention of places that have experienced severe flooding in recent catastrophic storms, and the decisions that community planners and elected officials must make to determine what size of storms they will build infrastructure to address.
Resources
City of Tucson. (2014). Stormwater Management Education and Outreach.
National Centers for Environmental Information NOAA. (n.d.). Climate Data Online (CDO)
Natural Resource Conservation Survey. (2013, December 6). Web Soil Survey.
New York State Department of Environmental Conservation. (n.d.). Natural Resources and Environmental Protection Maps.
Northeast Regional Climate Center. (n.d.). Extreme Precipitation in New York & New England: An Interactive Web Tool for Extreme Precipitation Analysis.
US EPA. (2014, May 20). Green Infrastructure Modeling Toolkit.
US EPA, ORD. (n.d.). National Stormwater Calculator.
To calculate the volume of stormwater runoff, you need to know three variables:
• Drainage area (A)
• Amount of rainfall (R)
• Average runoff coefficient for drainage area’s surface (Cw)
The formula you will use is: V= A x R x Cw
V = runoff volume
A = drainage area
R = rainfall
Cw = average runoff coefficient
1. CALCULATE DRAINAGE AREA
a. Fill in measurements for the chosen drainage area shape in the table below, then use these in step b.
b. Calculate drainage area using the equation for the appropriate drainage area shape below.
Adapted from Tucson, Arizona’s “Stormwater in the Desert—A Middle School Activity Book.”
c. (Optional) Compare the calculated area to the area determined using the Vermont ANR Atlas
1. Go to the Vermont ANR Atlas.
2. Type in the address of your school or site where you are assessing the drainage area.
3. Zoom to that site using the + button.
4. Click on Tools at the top right and then Measurement at the top center. Choose polygon.
5. Create the area that you delineate by clicking to outline that area.
6. When you double click after completing the shape, the area will appear. The default is in acres, but you can change this to square feet in the menu at the top center.
a. Look up the amount of rainfall in your town for a 2-year, 24-hour storm on the Extreme Precipitation in New York and New England: Interactive Web Tool for Extreme Precipitation Analysis website . 2-year, 24-hour storm size: inches
b. Convert rainfall measurement from inches to feet.
3. DETERMINE RUNOFF COEFFICIENT(S)
a. Fill in the table below with the appropriate runoff coefficient(s) for your drainage area. Follow your teacher’s directions about whether you will use one coefficient or more. Use 1.0 as the percent for the chosen surface type if you will use one runoff coefficient.
a. Use the equation Volume (V) = Area (A) x Rainfall (R) x Runoff Coefficient (Cw) to estimate volume of runoff from your site.
b. Convert volume to gallons, where 1 cubic foot equals 7.48 gallons.
5. HOW DOES THE NUMBER OF GALLONS YOU CALCULATED COMPARE TO THE AMOUNT OF WATER IN THE ITEMS LISTED IN THE TABLE BELOW?
1. Tell your students they will help assess if small streams in your watershed are impaired by chloride. Explain that chloride is a key element used in winter road maintenance across the northern U.S. and Canada. When chloride enters waterways in runoff from roads, it can be toxic to aquatic life. Chloride concentrations are increasing in many northern lakes, including Lake Champlain and Mirror Lake in Lake Placid, NY. Chloride has also contaminated groundwaters in upstate New York, southern New Hampshire, and northern Massachusetts.
2. Explain to students that they will use a handheld meter to measure specific conductance (or conductivity), which is the ability of water to conduct electricity, as a surrogate for chloride.
3. Tell students that specific conductance is measured in µS/cm (microSiemens per centimeter) or, when higher salt concentrations are present, mS/cm (milliSiemens per centimeter). Tell them that the units on the handheld meters change automatically. As such, when monitoring, students should be sure to read the units displayed on the meter.
4. Explore with students what conditions might cause specific conductance to be higher (e.g., during winter storms when roads are being salted and runoff enters nearby streams).
5. Explain that students must follow several safety measures to ensure everyone is safe while monitoring. These safety measures are:
• Always tell someone where you are going and when you are expected back.
• Be cautious of passing vehicles if you have roads to cross or need to sample near a road.
• Always use an extension pole to collect your water samples during winter.
• Only monitor small streams that have water less than knee-deep.
• If there is extreme cold or dangerous flood conditions, do not monitor.
• If the stream is frozen, do not monitor.
6. Explain to students that the goal of monitoring is to observe specific conductance levels in a stream over time, especially when winter storms and road salting have occurred, and, for comparison, during periods when no external chloride sources are expected to impact the stream. Share with them the monitoring schedule you have chosen.
1. Ensure your monitoring site is safe to access. If snow, ice, traffic, or other conditions threaten your safety in any manner, DO NOT MONITOR. Your safety is of utmost importance.
2. Record collector name(s), date, and start time on data sheet.
3. Record if the sampling event is “primary” (scheduled), “triggered” (when you add a monitoring date based on weather), or “other” (e.g., you missed a primary monitoring day, but want to make an observation) on data sheet.
4. Record air temperature (ºC), streamside observations, current weather, and weather over the past two days on your data sheet.
5. Record whether the stream is ice covered or not. Choose “Yes” if the stream is open in areas, but you are unable to sample due to safety concerns. If you indicate that the site is ice covered, this is all you need to do at the site on this date. Your safety is most important.
6. If the stream is not ice covered, indicate “No” and put on disposable, powderless nitrile gloves.
7. Attach the sample collection bottle to the pole sampler using the large rubber band.
8. Fill and rinse the sample bottle with the stream water to be sampled (rinse water). Avoid getting bottom sediment/sand in the rinse water.
9. Shake or swirl and then drain the rinse water from the sample bottle.
10. Repeat this rinsing process three times.
11. To collect the sample to be measured, lower the field-rinsed sample bottle slowly down through the water column, being careful to avoid making contact with the streambed. Raise the sampler slowly up through the water column.
12. This method is used to minimize collection of water at the surface of the stream and to avoid stirring up sediments at the bottom of the stream, both of which could affect specific conductance measurements.
13. Inspect the sample after it is collected, looking for the presence of anomalously large amounts of particulates that might have been captured because of excessive streambed disturbance during sample collection. If you note any large particles, discard the sample, making sure there are no residual particulates left in the container, and resample.
14. Turn on the meter and dip its electrode into the sample collection bottle, making sure the sensor is fully immersed, and stir the meter slowly.
15. Once the reading stabilizes, read and record specific conductance and water temperature on the data sheet. The HOLD button can be pressed to freeze the display to ensure you have read displayed units and results correctly.
16. Record end time on your data sheet.
Monitoring Team Members:
Stream Name:
Location (e.g., on downstream side of Main Street):
Monitoring Date (include year)
Start Time (include AM/PM)
Primary (scheduled monitoring), Triggered or Other? (P/T/O)
Air Temperature (°C)
Streamside observations
Current weather (sunny, partly sunny, rain, snow, other)
Weather past two days
Ice Covered (Yes/No). If Yes STOP now. If No, continue.
Specific Conductance (Circle displayed units!)
End Time (include AM/PM)
µS/cm or mS/cm
1. Use the State of Vermont’s regression equation to convert specific conductance into chloride. You may need to do this for younger students. You can have older students do it on their own. The equation is: Chloride (mg/L) = -69.72 + 0.292 * specific conductance (µS)
2. Have students plot data results over time to track specific conductance levels and estimated chloride levels. Have them compare results to weather patterns and to EPA standards. The EPA acute chloride standard is 230 mg/L and chronic standard is 860 mg/L.
1. Ask students to identify what areas of the school grounds that were addressed by their GSI recommendations addressed.
2. What types of GSI practices did students recommend?
3. Were there any common patterns?
4. How might the stormwater volume that they calculated influence the design of their recommended GSI practice?
5. Discuss what would have to happen to install the recommended practices (e.g., site design by a professional, fundraising, purchase of plants and other materials, installation of the practice).
6. What observations have students made about timing of the peaks in specific conductance / estimated chloride levels at your chosen stream site(s)?
7. Have students discuss and make a list of what might be done to minimize stormwater runoff, to minimize road salt inputs to local streams, or to treat stormwater before it reaches local surface waters.
GUIDING QUESTIONS
STUDENT LEARNING OBJECTIVES
• What is environmental stewardship?
• How do we become stormwater stewards to help protect our watersheds?
• Students will participate in a hands-on activity that mitigates stormwater impacts •Students will demonstrate agency in designing and addressing man-made problems.
Next Generation Science Standards:
MS-LS2-5. Interdependent Relationships in Ecosystems. Evaluate competing design solutions for maintaining biodiversity and ecosystem services. [Clarification Statement: Examples of ecosystem services include water purification, nutrient recycling, and prevention of soil erosion.]
Common Core State Standards: ELA/Literacy
RST.6-8.8 Distinguish among facts, reasoned judgment based on research findings, and speculation in a text. (MS-LS2-5)
RI.8.8 Trace and evaluate the argument and specific claims in a text, assessing whether the reasoning is sound and the evidence is relevant and sufficient to support the claims. (MS-LS2-5)
Mathematics
MP.4 Model with mathematics. (MS-LS2-5)
6.RP.A.3 Use ratio and rate reasoning to solve real-world and mathematical problems. (MS-LS2-5)
(times not provided due to high potential for variability based on group and location size)
3.1 Clean Up Storm Drains
3.2 Stencil Storm Drains
3.3 Aerate the Lawn
3.4 Sweep the Pavement
3.5 Vegetate Bare Areas / Create a Stream Buffer / Plant Trees
3.6 Conduct a Site Cleanup
3.7 Redirect a Downspout to a Vegetated Area
3.8 Install a Rain Barrel
3.9 Maintain a Rain Barrel
3.10 Maintain a Rain Garden
3.11 Install a Dog Waste Station
3.12 Install a Rain Garden
3.13 Debrief and Wrap Up
MATERIALS ✓ Materials lists for selected stewardship project
✓ Appropriate field report / observation worksheets for selected stewardship project
✓ Clipboards
✓ Pens or pencils
Activities in this section engage students in hands-on stewardship projects focused on reducing impacts of stormwater runoff. Stormwater stewardship project ideas are divided into three tiers, based on cost and difficulty of the projects (see table below). Some of the more advanced projects will require close communications with school administrators and grounds managers and may require external funding and expertise (e.g., of an engineer) to implement. The table below summarizes potential projects and the preparation steps required to complete them.
Clean Up
Storm Drains
•Work with local Public Works Department to identify storm drains.
• Find out if your town or local watershed group provides supplies (see online curriculum resources).
Stencil Storm Drains Any (working in teams of 3-4)
Aerate the Lawn
Sweep the Pavement
Vegetate Bare Areas
Plant a Stream Buffer
Plant Trees
Conduct a Site Cleanup
• Purchase or borrow supplies. Any (working in teams of 3-4)
• Work with school administration and grounds crew for permission and site selection.
• Borrow or purchase a classroom set of Yard Butler Lawn Coring Aerators (e.g., one per group of 4-5 students).
• Work with school administration and grounds crew for permission, site selection, and to make a waste disposal plan.
• Borrow or purchase a classroom set of outdoor brooms.
• Work with school administration and grounds crew for permission and site selection.
• Determine what will be planted.
• If digging, call Dig Safe at 811.
• Obtain trees and other planting supplies (e.g., shovels, gloves).
• Identify a location for your clean up.
• Contact property owner(s) to obtain permission.
• Arrange for trash pick-up/hauling.
Direct a Downspout to a Vegetated Area
Any (working in teams of 3-5)
Any (working in teams of 3-4)
Any
Any
Any
• Gather safety and cleaning supplies (e.g., first aid kit, water, gloves, trash bags). Any
• Work with school administration and grounds crew for permission and site selection.
• Obtain needed supplies to redirect the downspout.
Small groups only
MODERATE
Maintain a Rain Barrel
Maintain a Rain Garden
Preparation
• Identify areas where rain barrel water could be used.
• Obtain supplies to move water (e.g., hose, watering can).
• Make a schedule for regular checks of the rain barrel.
• Don’t forget to disconnect the rain barrel in winter.
• Identify which rain garden(s) you will maintain and required maintenance.
• Obtain landowner permission to engage in maintenance.
• Obtain supplies needed for maintenance (e.g., gloves, plants).
Install a Rain Barrel
Install a Dog Waste Station
Install a Rain Garden
• Work with school administration and grounds crew for permission and site selection.
• Obtain needed supplies.
• Identify a location(s) for recommended practices.
• Prepare an educational campaign message and materials.
• Present this message to selected target audience (e.g., school administration and grounds crew, town officials).
• Obtain sign, post, bags, and trash bin.
• Identify partners and funding for design and implementation of rain gardens.
• Speak with maintenance staff about plans and assistance during summer months and any required changes to landscaping, snow removal, and salting practices.
Recommended
Small groups (though regular maintenance required, so can stagger participation)
Dependent upon rain garden size
Small groups only
Small groups only
Any (though must be wellfacilitated); may require outside assistance (e.g., backhoe)
1. If you choose to maintain an existing project as your stewardship activity, consider taking your class out to the project site when it is raining so that students can see it in action. Observations of the stormwater projects could take place at any time and be repeated over different seasons and during dry and wet weather.
2. Parents or guardians may need to give written permission for students to participate in the stewardship activity. A permission slip should include an emergency phone contact and permission to seek medical assistance. Contact your school’s leadership team and insurance agent for information on liability insurance.
3. If you are cleaning up or stenciling storm drains, check the online resources for this curriculum to see if your community has freely-available supplies.
1. Storm drains should be cleaned routinely, including between rain storms and in anticipation of large storm events, to make sure they function properly, provide adequate drainage, and are free of litter and debris.
2. In addition to the benefit of cleaning up stormwater pollution, repeated visits to the storm drain over the year could allow students to observe differences in the accumulation of debris after various storm events and over the seasons, furthering learning and inquiry.
3. If you plan to maintain numerous drains or working on public streets, be sure to communicate in advance with the Department of Public Works in your city, village or town.
4. Using a neighborhood map, carefully consider the area your group will clean up. Divide the area into routes and assign a team to each route.
❑ Dust pans and brushes
❑ Trash bags
❑ Work gloves
❑ Traffic cones

1. Tell students that they will be visiting storm drain(s) to ensure they provide adequate drainage during storms. To help minimize flooding at the drain, students will remove trash and debris that collect after rain events, which can cause pollution in local waterbodies. Cleaning up storm drains also helps keep public areas safe, clean, and inviting.
2. Discuss some weather events that occurred recently. How do you think these precipitation or melting events may have contributed to buildup of debris?
3. Before going outside, discuss the safety guidelines for this activity (Adapted from Burlington Adopt-a-drain Terms of Service and Volunteer Guidelines).
• Make sure to cross streets at cross walks and stay out of the road.
• Wear gloves while removing debris and use tools to remove debris, NOT your hands.
• Never pick up sharp objects with hands.
• Do not enter or reach into storm drain or remove grate cover.
• Look out for each other to make sure your classmates are being safe.
• Never attempt to clear debris if moving water is greater than knee deep.
• Wash hands and clothing after contact with runoff, which can contain pollution and bacteria.
• Dispose of collected materials in garbage or compost, if it is organic waste and free of trash.
4. Ready class to go outside. Have students wear safety vests and bring gloves, shovels, brooms, dust pans, buckets, and trash bags. Have students bring writing utensils and something on which to write. Bring a bottle of hand sanitizer to share for the class.
5. Pass out Storm Drain Field Report sheets.
6. Bring class to storm drain area. Before beginning, make sure that the area is safe. If the drain is in a parking lot, make sure that proper safety precautions have been taken (diverting traffic and setting up cones, etc.).
7. Begin clean-up activity!
8. Have your class complete the clean-up log before returning to classroom.
9. Wash hands with soap and warm water for at least 20 seconds after returning to school.
Resources
City of Burlington, Vermont. (n.d.). Adopt-A-Drain. Lake George Association. (n.d.). Lake George Adopt-A-Storm Drain.
Adapted from Lake George Association’s “Adopt-a-storm-drain field report.
Name(s):
Location of storm drain:
Date of most recent rain event: / /
How many bags of litter/debris did you and your classmates remove from the storm drain?
What kinds of litter/debris did you remove?
❑ Trash
❑ Grass clippings
❑ Cigarette butts
❑ Storm drain was clean
Date: / /
Date of most recent clean out: / /
❑ Leaves
❑ Silt, mud
❑ Grease/oil
❑ Other (Please describe: )
Area Uphill of Drain
❑ Dog waste within 25 feet present?
❑ Dumpsters present?
❑ Parking lot present?
❑ Fertilized field present?
Is there any signage for this storm drain to indicate that it flows to nearby rivers and lakes?
What other observations do you have?
Is there a bigger issue that needs to be addressed by stormwater maintenance crews?
Used with permission of the University of Wisconsin-Madison and Wisconsin Department of Natural Resources Water Action Volunteers program.
1. Get permission to stencil storm drains with the message “Dump No Waste” (or something similar) from the Department of Public Works in your city, village or town. Be sure to ask for a letter of authorization to provide proof of permission in case you are questioned by a road crew or police officer.
To stencil on private property, whether a home, business or apartment complex, you must get permission from the landowner.
2. Weather conditions are important for the success of this project. You should choose a day when the pavement is dry and warm. Windy days are not good because the spray paint can drift onto nearby automobiles and debris can be blown onto the painted surface.
3. Using a neighborhood map, carefully consider the area your group will stencil. Divide the area into routes and assign a team to each route.
4. A day or two before you plan to paint, if available in your area or if you have the capacity to make them, distribute door hanger cards or fliers explaining the stenciling program. If you can’t distribute the information ahead of time, have one or two team members distribute the cards and fliers while others paint.
If your group is participating in a large storm drain stenciling project, you may want to make your own door hangers, fliers or posters, using the opportunity to conduct a community education campaign.
❑ Storm drain stencils
❑ Door hanger cards/fliers (pre-produced if available in your community or made by the students)
❑ A map of the stenciling area
❑ Parent/guardian permission slips
❑ A letter of authorization from the Department of Public Works or private landowner for stenciling
❑ Cans of spray paint – preferably inverted-tip white traffic zone latex paint.
(One can of latex paint is enough to paint approximately 10 drains.)
❑ A wire brush to clean the gutter before painting
❑ Whisk broom and dust pan
❑ Work gloves for each student
❑ Brightly colored safety vests for each student; alternatively, students should wear brightly colored clothing
❑ At least two garbage bags per group: at least one for wet stencils and one for garbage, such as tape used on the stencils and debris cleaned out of the gutter
❑ Paper towels or rags
❑ Traffic cones for use on busy streets
❑ Duct tape and scissors
❑ Cardboard box slightly larger than the size of the stencil
Used with permission of the University of Wisconsin-Madison and Wisconsin Department of Natural Resources Water Action Volunteers program.
1. Ask students why people should be concerned about what enters a storm drain? Explain this is because anything that enters a storm drain is generally not “treated” before it reaches a stream or river. This means that oil, antifreeze, paint, grass clippings, household waste, pet wastes, or any other waste on streets and sidewalks goes directly into a nearby stream, river, or lake. (Note that in Burlington, VT, stormwater does go to the wastewater treatment plant, but it regularly overwhelms that plant and is sent to Lake Champlain with partial, not full, treatment.)
2. Have students think about whether they have ever washed a car in a driveway. Where do they think the water went? The soapy, dirty water runs down the street into the storm sewer. This sewer carries the wash water to a waterbody. Let them know that they will be doing a stewardship project to help increase awareness of the storm drain connection to local waterbodies. The stewardship project involves stenciling the street next to storm drains and distributing informational door-hanger cards.
3. On the day of stenciling, have students put on safety vests and gather necessary materials, review the directions below with students in the classroom, and provide them to a chaperone or lead student for each group. Then have the students head to the storm drains to which they were assigned.
4. Once at the storm drain, scrub the street area surrounding the storm drain with the wire brush and use the whisk broom to sweep dirt into the dust pan. Use the garbage bags to take debris away. Do not sweep dirt and debris into the drain.
5. Position the stencil in the gutter next to the storm drain inlet where the message will be most visible. Tape or hold the stencil in place. It is a good idea to place a cardboard box with its bottom removed over the stencil to create a “wall” to contain drifting paint.
6. Spray paint the stencil message, making sure paint doesn’t get into the storm drain. Two light coats of paint will work better than one heavy coat. Allow the first coat of paint to dry before applying the second coat, according to the directions on the paint can. The stenciled messages last for approximately two years on a paved surface.
7. When you are done with the project, have one team member check that all storm drains in your area have been stenciled. It’s easy to miss one.
8. Place the used stencils in a plastic bag for transportation. When storing used stencils, allow the paint to dry before stacking the stencils. A stencil’s lifespan is determined by use. Discard the stencil when the message is blurred by excess paint build-up (typically about ten separate events, depending on the material used to make the stencil).
9. Be sure to take photos of your students in action! You can use “before” and “after” photographs to show people what your group has accomplished.
Resources
Ellis, C.D., Kweon, B.-S., Myers, D.N., Morrow, J., Robinson, L., Bartas, S., Muhammad, D., Stone, C., White, M. (n.d.). Stormwater Management Lesson Plans for Grades 3-12. Environmental Protection Agency & University of Maryland Department of Plant Science and Landscape Architecture. https://cbtrust.org/wp-content/uploads/EPA-SW-Lesson-Plan-Book.pdf University of Wisconsin Extension and Wisconsin Department of Natural Resources. (2013). Storm Drain Stenciling. https://wateractionvolunteers.org/files/2020/01/WisStreamCurriculum-StormDrainStenciling.pdf
1. Aeration of a lawn, particularly when plugs are removed, can enhance the ability of the lawn to accept stormwater, and increase its health by stimulating root growth, facilitating soil microbe development, and reducing soil compaction.
2. Aeration can be done anytime during the growing season.
3. Aeration can be done with a machine, but using a handheld aerator may allow students to become more engaged in the stewardship project. The Yard Butler Coring Aerator is recommended, but many handheld options exist.
4. Students can take turns using the aerator. When not using that tool, they can pick up and crush the plugs of earth that are made during the aeration process, and sprinkle the soil from the crushed plugs on the grass as an added source of nutrients.
5. Before engaging in this activity, communicate with your school (or community) grounds crew to select an appropriate area for the stewardship project and to ensure herbicides have not recently been spread.
6. The lawn area being aerated must be moist before this project can take place. If possible, either water the area the day before or morning of the stewardship project date or plan to aerate following a 1-inch (or greater) rainstorm.
❑ Yard Butler Lawn Coring Aerators or similar handheld aerator (one for every 4-5 students)
❑ Work gloves
❑ Rakes (optional)
❑ Grass seeds and seeder (optional)
1. Ask students to think back to their stormwater flow path maps. Were there areas that they had labeled as pervious (or permeable) that might become compacted due to high level of use (e.g., a grassy playground area or a sports field)?
2. Ask students to suggest possible maintenance actions that could be done to allow more water to infiltrate into the ground or to add air to the ground.
3. Tell students they will be engaging in a stormwater stewardship activity that will help add air to the ground, which will, in turn, allow added water to infiltrate into the ground. This process is called aeration.
4. Show students the tool they will be using (Yard Butler), explain how it works, and name the teams.
5. To use the Yard Butler, simply push it into the ground by stepping on it. Two soil plugs should come up on the outside edges of the device. (If the soil is too wet the plugs will not come out. If the soil is too dry, it will be extremely difficult to get the aerator to go into the ground.) Then move about 6 inches from that location and repeat the process. Show students examples of the soil plugs that are produced when using the aerator and direct students not using the tool to pick up the plugs, break them apart, and spread the soil material back onto the lawn. This will help add nutrients and microbes back to the soil. If there are additional students, they can rake the area ahead of the aerator to prepare it for being aerated.
6. Gather needed materials and head outside to the selected area.
7. Give students 30 minutes to aerate the grass at the chosen location.

8. If allowed by the grounds crew, give students grass seeds to spread over the area where they just aerated to further promote grass growth.
9. Be sure to take photos of your students in action! You can use “before” and “after” photographs to show people what your group has accomplished.
Communicate with the school administration and grounds crew to make a plan for the areas you expect to be sweeping and what you will do with collected sediments.
❑ Outdoor push brooms (enough for one for every 4-5 students)
❑ Dust pans and brushes
❑ Trash bags and bins
❑ Work gloves
1. Ask students to look at their stormwater flow path maps and find locations where a top pollutant was identified to be sediment/dirt. Discuss what sorts of areas those were and what might be done to minimize sediment inputs to local waterways. Identify areas where sweeping up sediment from pavement areas would help.
2. Explain to students that sediment is a pollutant itself, and it can carry nutrients to local waterbodies, contributing to problems such as cyanobacteria blooms. Sediment can also accumulate on river bottoms, filling in fish spawning areas, or impact water clarity, negatively impacting sight-feeding fish, plant growth, and other aquatic life.
3. Tell students that they will participate in a stormwater stewardship project to sweep up sediment from critical areas of the school campus to prevent it from entering local waterbodies.
4. Explain how the groups are divided into teams, what equipment teams will have to do this work, and where collected sediments should be placed.
5. Gather needed supplies and head outside.
6. Give students 30 minutes to sweep up sediment and properly dispose of it at the chosen location(s).

7. Be sure to take photos of your students in action! You can use “before” and “after” photographs to show people what your group has accomplished.
1. Identify an area where there is lack of vegetation on your school campus or in another location in the community (e.g., in a community park). Work with the relevant grounds crew to determine if there is interest in having the area planted in some manner (e.g., with grass, native shrubs, or trees).
2. If so, identify funds to purchase the selected vegetation and a source for the selected vegetation, and determine the best time to plant. (This is often fall and spring and can depend on plants and available supplies.)
3. Make arrangements to have the necessary materials for planting on hand on the stewardship project date you choose.
❑ Seeds of native plants or trees (as appropriate for the chosen location)
❑ Shovels or seeders (as appropriate)
❑ Work gloves
1. Tell students that they will be engaging in a stormwater stewardship project to plant vegetation.
2. Remind students that erosion from streambanks and areas without vegetation are contributors to pollution in Lake Champlain and its tributaries. Adding vegetation to bare areas, allowing a buffer of natural vegetation to grow between a stream or river and the riparian area alongside it, and planting trees can help to minimize erosion and decrease input of sediments to local waterways.
3. Ask students to think back to their stormwater flow path maps, and if there were any areas that might benefit from having additional vegetation. If appropriate, you may plan to work in those areas. If not, explain to students where and what you will be planting. Explain use of any specialized equipment that might be needed, and your plan for how the students will work in teams.
4. Work with a partner organization or school grounds crew to select plants. Have students prepare a planting map to plot out what types of plants will be planted where in the chosen location.
5. Gather needed supplies and head to the selected location.
6. Give students time to plant vegetation and clean up any used supplies.
7. Be sure to take photos of your students in action! You can use “before” and “after” photographs to show people what your group has accomplished.
Based on Exploring Streams – Stream Monitoring Curriculum Guide and used with permission of the University of Wisconsin-Madison and the Wisconsin Department of Natural Resources.
1. Identify an area along a stream or river where there is public access or where you have landowner permission to engage in a streamside, riverside, beach or park clean up.
2. Visit the site in advance to ensure there are not poisonous plants or hazardous areas or materials on site that may put students at risk during the cleanup.
3. Gather needed supplies.
4. Pick a cleanup date.
5. If you have a large group, organize students into several teams with team or area leaders (one for every 6-8 students). Each team leader should know their assigned area to clean and where the waste pickup sites are located.
6. Arrange for pickup of filled trash bags.
7. Because students will be working near water and may be carrying items, safety is an important consideration. Advise your students to wear heavy gloves, thick pants and sturdy shoes. Only adults should pick up hazardous items such as broken glass and syringes. First aid kits should be available at the cleanup site, and someone there should know how to administer first aid. If needed, contact the highway department to provide warning cones, signs, or flags for sites where volunteers will be leaving garbage for pickup.
8. Consider recording the amount of garbage collected. You can use this information to educate people in your community and to report on your success.
9. Be sure to take photos of your students in action! You can use “before” and “after” photographs to show people what your group has accomplished.
❑ Work gloves
❑ Trash bags
❑ Rakes, shovels, and/or pitchforks
❑ Insect/tick repellent
❑ Refreshments
❑ First aid kit
❑ Orange vests and/or cones for trash collection sites along a road
❑ Life jackets if you will be on the banks of a stream or river (optional)
Based on Exploring Streams – Stream Monitoring Curriculum Guide and used with permission of the University of Wisconsin-Madison and the Wisconsin Department of Natural Resources.
1. Tell students they will be engaging in a stormwater stewardship activity by carrying out a cleanup.
2. Ask students to look at their stormwater flow path maps and identify areas where trash was a top pollutant. If possible, engage in a cleanup at that site. If not, explain to students where you will be doing a cleanup, how teams will be divided, and the length of time you will have. Remind them of safety guidelines to follow when collecting trash.
3. Gather needed supplies and head outside.
4. Give students time to carry out the cleanup.

Adapted with permission from Absorb the Storm: Create a Rain-Friendly Yard and Neighborhood by Lake Champlain Sea Grant and the Vermont Department of Environmental Conservation.
1. Many school buildings will not have gutters or downspouts, so engaging students in this activity might be something that happens at their homes or at small businesses where gutters and downspouts are used. Consider options based on the stormwater flow path maps the students create, and your ability to travel to offsite locations.
2. It may be difficult to engage a large group in this activity, and an adult may need to do certain steps (e.g., cut the downspout with a hacksaw), so it may need to be carried out by a club or in small teams at different locations over time.
❑ Hacksaw
❑ Elbow for downspout
❑ Extension for downspout
❑ Cap for sewer standpipe
❑ Pliers
❑ Sheet metal screws
❑ Splash block
1. Ask students to look at their stormwater flow path maps and see if they marked any downspouts that were directed onto impervious surfaces. Review with them why this may cause water quality issues due to stormwater runoff. Remind them of the Streams in The City: It’s A Hard (Surface) Life reading they did, and the impact of urban areas on stream flow. If gutters and downspouts drain roof runoff directly into the stormwater system or onto a parking lot or driveway, they can direct massive amounts of water from a storm into local waterbodies very quickly. This can bring pollutants to those waterbodies, cause streambank erosion, and result in loss of habitat for aquatic life. Explain that disconnecting and redirecting downspouts to vegetated areas is an easy stormwater stewardship action.
2. Explain that you will be working in teams to disconnect downspouts.
3. Gather needed materials and head to your chosen locations.
4. At the site, cut the existing downspout approximately 9 inches above the sewer standpipe with a hacksaw (see figure on following page).
Adapted with permission from Absorb the Storm: Create a Rain-Friendly Yard and Neighborhood by Lake Champlain Sea Grant and the Vermont Department of Environmental Conservation.
5. Cap the sewer standpipe.
6. Attach elbow by crimping the downspout with pliers to ensure a good fit. Connect elbow to downspout using sheet metal screws. It may be necessary to pre-drill holes.
7. Attach the elbow into the extension and secure with sheet metal screws.
a. Water should drain at least five feet away from the house, so direct the extension accordingly. A splash block (see image) may help direct water further away from the house.
b. If desired, redirect downspout to rain barrel or rain garden.

8. Be sure to take photos of your students in action! You can use “before” and “after” photographs to show people what your group has accomplished.
Adapted from “Build Your Own Rain Barrel Activity” with permission from University of Nebraska Lincoln Extension.
1. Contact school administration and maintenance staff to ensure it is okay to install a rain barrel.
2. Decide where the rain barrel will be placed. The barrel will need to be on level ground and slightly elevated, so an outlet hose can be attached.
3. Identify the amount roof runoff to be collected in the case of at least one inch of rain. See activity 2.5 and the corresponding activity sheet to calculate volume.
4. In the rain barrel (if not already pre-drilled), drill an outlet hole 3” up from the bottom with a 15/16” bit.
5. Cut an overflow hole with the hole saw 3” down from top of barrel.
6. Trace the strainer basket with a pen and drill a 15/16” hole inside mark; then cut the remaining inlet hole with a jig saw. The trainer needs to fit tightly into hole and not fall through.
7. To make the dry-fitting outlet, screw the spigot into lower outlet hole. If its fit is really tight, slightly enlarge the hole with a pocket knife. If the spigot is too loose, unscrew it and wrap it with thread seal tape.
8. Remove the spigot for students to install during class activity.
9. To make the dry-fitting overflow, screw the 1.5” adapter into overflow hole. Thread seal tape or caulk can be applied for a tighter fit when assembling the rain barrel with students. Remember, caulk will need to dry. Attach a 90-degree PVC elbow, about 2.5 feet of pipe, and additional elbow, and remaining pipe so that it flows away from the building’s foundation.
❑ Variable speed drill
❑ Hole saw
❑ Hacksaw
❑ Tape measure
❑ 15/16” spade bit
❑ Jig saw
❑ Pocket knife
❑ Marking pen/pencil
❑ Safety glasses, ear plugs, dust mask, leather gloves
❑ 50- to 100-gallon food-grade plastic barrel, durable & opaque color (size depends on roof drainage area)
❑ 3/4” male threaded hose bibb (also called a faucet or boiler drain) for outlet
❑ Thread seal tape and outdoor caulk
❑ Plastic kitchen strainer with aluminum mesh for inlet
❑ Overflow: 1.5” PVC pipe, about 5’ in length, and two 1.5” 90-degree PVC elbows
❑ 1.5” trap adapter (At the hardware store, make sure the PVC elbow fits the trap adapter. You may need a short piece of PVC pipe to connect them. Your hole saw also needs to match the size of the trap adapter.)
❑ Concrete bricks or stable platform materials for rain barrel to sit on.
Adapted from “Build Your Own Rain Barrel Activity” with permission from University of Nebraska Lincoln Extension.
1. Tell students that they will be installing a rain barrel to collect runoff from a roof downspout as part of a stormwater stewardship effort.
2. Review with students how a rain barrel works. Ask students what happens after the stormwater is collected in a rain barrel. (It has to be emptied!)
3. Tell students that while it would be great to be able to use the roof runoff for a vegetable garden, some roof materials aren’t safe to irrigate with for an edible garden. The water that is collected is not drinking, cooking or bathing water but is best for watering potted plants, flower gardens, shrubs, and lawns.
4. Review needed materials for the rain barrel and the already completed initial steps (i.e., the outlet, inlet, and overflow holes have already been cut into the barrel).
5. Head outside to the chosen location.
6. For the outlet, have a student pair screw the spigot into the lower hole.
7. For the inlet, have a student pair secure the strainer above the hole.
8. Place rain barrel on level ground or platform and positioning rain barrel. Have two students elevate the barrel to allow room to attach a hose to the spigot at the outlet. Have students position the rain barrel so the downspout can empty into the outlet.
9. For the overflow, have two students screw the 1.5-inch adapter into the overflow hole. Thread seal tape or caulk can be applied for a tighter fit. Remember, caulk will need to dry. Attach a 90-degree PVC elbow, pipe, additional elbow, and remaining pipe so that it flows away from foundation to the area that will be planted.

10. Be sure to take photos of your students in action! You can use “before” and “after” photographs to show people what your group has accomplished.
Resources
A rain barrel needs to be checked routinely. This includes:
• Empty rain barrels regularly. Direct rain barrel water to lawns or gardens. Ensuring that the collected water infiltrates soil on-site maximizes the benefit of this GSI practice. Releasing collected stormwater outside of storms helps to reduce peak water flows during storm events. Rain barrels should be emptied during dry times to avoid soil saturation, to irrigate lawns and gardens providing irrigation, and to recharge groundwater.
• Check to make sure the rain barrel is collecting roof runoff, and that there is no blockage to inlet (from leaf litter, etc.).
• Clean the strainer basket.
• Ensure the overflow is not blocked and is directed away from the building foundation
Seasonal maintenance includes:
• Fall/Winter: Rain barrels should be disconnected during winter. Reattach downspout section; use screws to secure it.
• Spring: Reconnect the rain barrel to the downspout.
• Summer: It is important to be able to ensure that GSI practices are maintained during the summer, when more intense rainstorms are common.
1. Tell students that they will check on the rain barrel they set up to see if it is functioning, perform any needed maintenance, and empty any roof runoff that collected.
2. Review with students why this is important. Why do students need to go back to the rain barrels once they are built? (They need to ensure rain barrels are collecting roof runoff, to ensure that the inlet and overflow are functioning properly and free of debris, and most importantly to empty the rain barrel in preparation for the next storm event. They should also check on the planted garden, if applicable.)
3. Discuss some of the weather events that occurred since setting up the rain barrel.
4. Ready the class to go outside. Have students bring materials for maintenance activity and field report sheets with writing utensils.
5. Begin rain barrel maintenance activity!
Resources
EPA Office of Water. (2013). The Importance of Operation and Maintenance for the Long-Term Success of Green Infrastructure.
Name(s):
Location of rain barrel:
Date of most recent rain event: / /
1. When was the rain barrel most recently emptied?
2. What proportion of the barrel is full? Make an estimate.
Date: / /
Date of most recent clean out: / /
3. How many bags of litter/debris did you and your classmates remove from the strainer?
4. What kinds of litter/debris did you remove?
❑ Trash ❑ Leaves
❑ Strainer was clean
❑ Other (Please describe: )
5. Is the water properly flowing to the rain barrel? How do you know?
6. Does it look like the rain barrel is able to handle the roof runoff that is directed to it? What evidence leads you to make that determination?
7. Have you made observations of the rain barrel when it is drizzling? When it is pouring?
8. What is receiving the collected runoff?
9. Does it look like the plants and soil are able to absorb the collected runoff?
10. Are the plants in good condition? Why or why not?
11. What other observations do you have? Make at least 3 observations of your own.
12. Are there any improvements or fixes that you think should be made?
The long-term functioning of a rain garden depends on the initial quality of the design and a solid monitoring and maintenance plan that can address routine and unexpected challenges. Partners who assist in the design and implementation of the rain garden should also outline the specific steps and schedule for monitoring and maintaining the rain garden. Below is an overview of the type of maintenance rain gardens need:
• Ongoing: Clean out inlet filters and grates monthly and after storms of more than an inch of rain.
• In the spring, sediment and debris build-up may need to be removed and thrown away. Soil can be loosened as needed and general plant maintenance may be needed (e.g., pruning, deadheading, replacement of plants).
• In the summer, rain gardens will need weeding at least a few times.
• In the fall, sediment and debris build-up and leaf litter may need to be removed. Additional weeding and garden preparation, including pruning and deadheading plants, may also be needed.
In addition, upkeep of vegetation in the garden varies by plant but is similar to traditional landscaping maintenance practices already occurring on the school campus.
❑ Work gloves ❑ Trowel ❑ Pruning tools ❑ New plants (if needed)
❑ Trash bags (to move away trash and compostable materials to a location where they can be disposed of or composted, as appropriate)
1. Tell students that they will be visiting a rain garden to weed, remove any trash, and, if needed, add native plants to help ensure it is functioning properly.
2. Review with students why this is important.
3. Prepare the class to go outside. Have students bring materials for maintenance activity and field report sheets with writing utensils.
4. Carry out the rain garden maintenance activity.
Resources
American Rivers. (n.d.). Staying Green: Strategies to improve operations and maintenance of Green Infrastructure in the Chesapeake Bay Watershed. EPA Office of Water. (2013). The Importance of Operation and Maintenance for the Long-Term Success of Green Infrastructure.
New York State Department of Environmental Conservation. (2015). New York State Stormwater Management Design Manual. New York State Department of Environmental Conservation. (2017). Maintenance Guidance: Stormwater Management Practices.
New York State Department of Environmental Conservation. (n.d.). Green Infrastructure Examples for Stormwater Management in the Hudson Valley. Seattle Public Utilities. (2009). Green Stormwater Operations and Maintenance Manual. UNEP. (2014). Green Infrastructure Guide for Water Management. United Nations Environmental Protection.
US EPA. (2015, September 2). What is Green Infrastructure?
US EPA. (n.d.). Operation and Maintenance Considerations for Green Infrastructure.
US EPA, OW. (n.d.). Infiltration Trench.
Vermont Department of Environmental Conservation. (2010). Vermont Low Impact Development Guide for Residential and Small Sites.
Vermont Department of Environmental Conservation. (2015). Green Stormwater Infrastructure Fact Sheet.
Lake Champlain Sea Grant, Winooski Natural Resources Conservation District, and University of Vermont Extension. (2008). The Vermont Rain Garden Manual: Gardening to Absorb the Storm.
Name(s):
Location of rain Garden:
Date of most recent rain event: / /
Date of most recent clean out of inlet: / /
How many bags of litter/debris did you and your classmates remove from the inlet?
What kinds of litter/debris did you remove?
❑ Trash
❑ Cigarette butts
Surrounding area
❑ Dog waste within 25 feet
❑ Parking lot uphill
❑ Leaves
❑ Grease/oil
❑ Dumpsters uphill from drain
❑ Fertilized field uphill from drain
Date: / /
❑ Grass clippings ❑ Silt, mud
❑ Inlet was clean
Is runoff flowing to the rain garden? Is the overflow outlet functional? How do you know?
Does it look like the rain garden is able to handle the runoff that is directed to it? What evidence leads you to make that determination?
Have you made observations of the rain garden when it is drizzling? When it is pouring?
Does it look like the plants and soil are able to absorb the collected runoff?
Are the plants in good condition? Why or why not?
What other observations do you have? Make at least three observations of your own.
Are there any improvements or fixes that you think should be made?
1. Installing a dog waste station requires funds for purchase of the station (estimated $150-$500/station, depending on model selected) and permission of the landowner (likely the school or local community).
2. Unless you plan to support installation of dog waste stations at several locations, the installation activity may be most appropriate for a small group.
3. A larger group of students can take turns maintaining the station (e.g., refilling bags). Alternatively, a school or city maintenance person may be able to maintain the station (especially if the station is the style where a trash bin is located at the station). Responsibility for maintenance should be determined before the station is purchased and placed.
❑ Dog waste station (e.g., zerowasteusa.com)
❑ Post driver
1. Ask students to look at their stormwater flow path maps to see if dog poop was mentioned as a pollutant along the path they walked. Ask them to describe the type of area they would expect to see this pollutant most often and to think about if there might be a location on their maps where it would be useful to have a dog waste station with bags and a sign to ask people to pick up after their pooches (e.g., a place on public property where many dogs and their owners pass each day).
2. Tell students they will be installing and later maintaining a dog waste station as a stormwater stewardship project.
3. Explain the process of installing the station and the roles students will play.
4. Gather the materials needed to install the station and head to the location.
5. Install the station using a post driver.
6. If needed, assign students to check on available bags at the station periodically and refill them as needed.
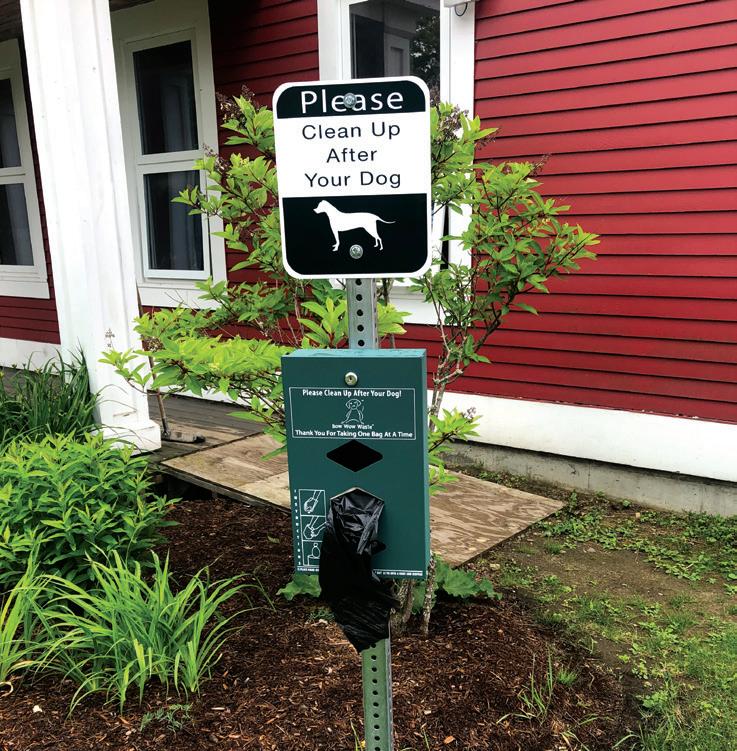
7. This activity may benefit from the students running an educational campaign to alert people of the new station.
1. Contact school administration and maintenance staff for approval to install a rain garden.
2. Design of rain garden and needed materials depend on native soil conditions, exposure, drainage area, stormwater runoff volume calculations, preference for plants, aesthetic, anticipated site use, and capacity for maintenance. Technical experts will be able to design rain gardens to meet schools’ physical conditions, aesthetic preferences, and functional objectives.
❑ Native grasses, flowers, and shrubs
❑ Soil media for rain garden infiltration (sand, gravel, pea stone)
❑ Technical rain garden components (see The Vermont Rain Garden Manual)
❑ Compost or soil to plant or transplant plants
❑ Shovels
❑ Work gloves
1. Tell students they will be helping establish a rain garden on their school grounds as a stormwater stewardship activity, and that a partner organization is helping in the design and overseeing implementation.
2. Review the definition and characteristics of a rain garden (Section 2 of this curriculum).
3. Invite the partner organization to visit the class.
4. Ask the partner representative to present an outline of the analysis that they did (site analysis, impervious area, and volume of runoff to be treated).
5. Tell students that this will be a mock “desk critique.” Students should take notes and identify questions or considerations that they think should or need to be addressed.
6. Ask partner to present their design concepts for the rain garden and explain why a particular design was chosen.
7. Students will be able to assist in planting the rain garden, but many of these design details will have been determined by the partner in collaboration with the school.
Resources
Cornell University Cooperative Extension Onondaga County. (n.d.). Rain Garden Plant List. Ellis, C.D., Kweon, B.-S., Myers, D.N., Morrow, J., Robinson, L., Bartas, S., Muhammad, D., Stone, C., White, M., n.d. Stormwater Management Lesson Plans for Grades 3-12. Environmental Protection Agency & University of Maryland Department of Plant Science and Landscape Architecture. Full Circle Gardens. (n.d.). Full Circle Gardens.
Interstate Commission on the Potomac River Basin. (n.d.). Creating a Rain Garden. Interstate Commission on the Potomac River Basin.
New York State Department of Environmental Conservation. (2015). New York State Stormwater Management Design Manual.
New York State Department of Environmental Conservation. (n.d.). Green Infrastructure Examples for Stormwater Management in the Hudson Valley.
UNEP. (2014). Green Infrastructure Guide for Water Management. United Nations Environmental Protection.
Vermont Department of Environmental Conservation. (2010). Vermont Low Impact Development Guide for Residential and Small Sites.
Vermont Department of Environmental Conservation. (2015). Green Stormwater Infrastructure Fact Sheet.
Winooski Natural Resources Conservation District, University of Vermont Extension, and Lake Champlain Sea Grant. (n.d.). The Vermont Rain Garden Manual: Gardening to Absorb the Storm.
1. Ask students what they thought worked well with their stormwater stewardship activity.
2. What would they have done differently?
3. What were students most surprised by in completing the stormwater stewardship activities?
4. Will the project in which they engaged help reduce or treat stormwater runoff? If so, how? If not, why not?
5. What are next steps they or someone else should take to maintain the stormwater management practice over time?

GUIDING QUESTIONS
STUDENT LEARNING OBJECTIVES
• How do we engage others to become stormwater stewards?
• Students will implement an educational campaign to promote others to engage in stormwater stewardship.
• Students will review what they have learned and practice communicating the importance of stormwater stewardship.
Next Generation Science Standards:
MS-ETS1-2 Engineering Design. Evaluate competing design solutions using a systematic process to determine how well they meet the criteria and constraints of the problem.
Common Core State Standards: ELA/Literacy
STANDARDS
RST.6-8.1 Cite specific textual evidence to support analysis of science and technical texts.
WHST.6-8.7 Conduct short research projects to answer a question (including a self-generated question), drawing on several sources and generating additional related, focused questions that allow for multiple avenues of exploration
WHST.6-8.9 Draw evidence from informational texts to support analysis, reflection, and research. ACTIVITY OUTLINE
MATERIALS
4.1 Develop a Stormwater Stewardship Pitch (50-100 minutes)
✓ Develop a Stormwater Stewardship Pitch worksheet
✓ Why is Stormwater Stewardship Important? worksheet
Activities 4.1 and 4.2 are both designed as research projects, so extended time in class and outside of class may be required. Consider if you would like to share your students’ work from Activity 4.2 more broadly than described in that activity (e.g., school newsletter, local news outlets, or working with watershed partners to develop other creative outlets for their material).
There are a variety of best practices that, if implemented over a broad area, can help to protect local waterways from stormwater pollution. These include:
• establishing a no-mow zone
• following Raise the Blade lawncare practices
• establishing a stream buffer
• establishing low-salt winter maintenance practices
• establishing safe snow zones
Each is described on the Activity 4.1 worksheet in more detail. In this activity, students will select a best practice to promote to a target audience (e.g., school administration and grounds crew, parents, local community). They then will develop and implement an educational pitch that shares information about and promotes adoption of the best practice with that audience.
❑ Varies
1. Ask students to brainstorm a list of actions across the watershed that people could take to help minimize stormwater runoff. Have students record the list in their notebooks.
2. Provide students with the Activity 4.1 worksheet. It explains five best practices that they might want others to adopt, and it helps them define what information about the best practice to share, and how they will share it.
3. Have students work in pairs to discuss the practices in the worksheet and the list of practices generated by the class. What is similar about the two lists? What is different?
4. Have each pair of students select a best practice to promote to others (from either the class list or the provided list).
5. Have the pairs share their selected practices with the rest of the class.
6. Combine pairs so that groups of 4-6 students are working on the same topic.
7. Have the small groups identify who they think should hear about the best practice and their messages around it. Who has responsibility to make decisions about their topic (e.g., the grounds crew, the principal)? Have them write a list of possible audiences for their message.
8. Have the small groups share their topic and list of possible audiences with the rest of the class. Decide as a group one audience per topic with which to share the outreach materials.
9. Have students break into small groups again to discuss what format might be useful to provide information about the best practice to the chosen audience (e.g., flyer, presentation, YouTube training video)? Have students select a format.
10. Give students time and resources needed to engage in research to better understand their topic, and to create the type of outreach they chose, including the message they wish to convey to the chosen audience.
11. Present this message to selected target audience.
There are a variety of best practices that can help to protect local waterways from stormwater pollution.
• Establishing a no-mow zone: Longer grass has longer roots, and longer roots allow more stormwater to infiltrate into the ground. Where large areas of lawn are cut short, there is greater chance that roots are short, and stormwater is more likely to runoff than to infiltrate into the ground. By establishing a no-mow zone (e.g., along the back edge of school fields or near a waterway), the fields can still be used for sports and activities, and the grass in the no-mow zone can be allowed to grow to help promote increased stormwater infiltration.
• Following Raise the Blade lawncare practices: Raise the Blade is an outreach campaign that promotes three lawncare practices: 1) cut grass no shorter than 3” in height; 2) cut no more than 1/3 of the length of the grass blade in any one cutting; and 3) allow the grass clippings to decompose in place. Together, these practices promote development of long and well-developed root systems (which allow more stormwater to infiltrate into the ground), and soils that are rich in organic matter (which has the ability to hold more water). These practices also render grass more drought resistant, as roots can more easily access ground water. Most areas of grass used for regular activities can follow Raise the Blade practices, making the grass healthier and helping the environment.
• Establishing a stream buffer: A stream buffer is a strip of land that is planted with natural vegetation (preferably native vegetation) located alongside a stream, river, pond, or lake. The vegetation absorbs stormwater as stormwater travels across the land towards the waterbody, helping reduce the amount of stormwater that reaches the waterbody. A no-mow zone could be a type of stream buffer, though a stream buffer planted with shrubs or trees is likely to absorb even more water than grasses.
• Establishing low-salt winter maintenance practices: Winter road maintenance in the northern United States and Canada is known to contaminate waterbodies with chloride. However, there are a variety of practices that can be used to reduce the amount of salt used while still keeping people safe (e.g., calibrating equipment, using prewet salt, or using a brine mixture of salt and water ahead of the storm).
• Establishing safe snow zones: Salt is commonly used on school properties to help keep surfaces free from ice. When salt is on parking lots and then it snows, the snow piles formed during plowing can contain high levels of chloride. To minimize chloride runoff to local waterbodies, safe snow zones can be established on school grounds. These are areas where snow piles should not be piled due to the likelihood that melting snow will quickly enter a storm drain or a waterbody. Using your stormwater flow path maps, you can identify low elevation areas such as storm drains and streams and promote piling of snow in safe snow zones that are away from those areas.
1. Name(s):
2. What similarities exist with this list as compared to the list you made with your class?
3. What differences exist between this list and the list your class made?
4. What practice do you choose to promote?
5. Who has responsibility to make decisions about the practice you chose? Is there more than one possible audience for your message? List all that you can think of here.
6. For which one audience will you develop your message (pick one from your list above)?
7. What formats might you use to share your message?
8. What one format will you use to share your message?
9. Identify the following key information to share with your audience about your topic. Please what you will say to answer each of the following questions.
• What is the current practice being used at the location?
• Why is that practice of concern?
• What could be done instead?
• How does the new practice help protect water quality and minimize polluted stormwater runoff?
1. After completing a stormwater stewardship activity, tell students that they will share some of the things they have learned about the importance of stormwater management with the public.
2. Brainstorm with students some ideas of how to share some of the things they have learned about stormwater with the public (e.g., signs, radio announcements, ads).
3. Ask students to choose which type of outreach material they would like to develop. Try to have a mix among signs, public service announcements, ads, and other ideas in the class.
4. Before developing the material, have students brainstorm ideas and research to gather information they would like to include. Have students use the Activity 4.2 Worksheet: Share Stormwater Stewardship Successes worksheet to organize ideas.
5. Have students begin drafting the material. Depending on the different types of material, students may develop two or more concepts.
6. Have a round robin for students to share their work and get constructive feedback from classmates. What is one thing students like? What is one thing they think would help make the message clearer? This could be written (and reviewed quickly by teacher for appropriateness) if it is difficult for students to give and receive feedback orally.
7. Have students continue working individually on their materials to address the feedback.
1. Name(s):
2. What facts about stormwater and stormwater pollution do you think are important for the public to know?
3. Why are these things important? Why should someone care?
4. What can be done to be better stormwater stewards and reduce pollution in watersheds?
5. How to get started? Define 1-3 suggestions you will share with others to help them to become better stormwater stewards and to reduce pollution in watersheds.
6. Do research to gather additional information you need.
7. How would you like to present your message?
• Public service announcement – Write out a short paragraph with your main ideas that will grab your audience’s attention.
• Advertisement or sign – Use visual pictures, drawings, and short phrases to represent your main ideas and grab your audience’s attention.
• Other?
8. Share your draft with your classmates and get some feedback.
9. Continue working on your final version sharing the importance of stormwater stewardship.
Aquatic Ecosystem: a community of organisms and their water-based physical environment
Bioswales: Vegetated channels that are designed to capture and redirect stormwater while filtering pollution.
Constructed wetlands: Wetlands that are designed to mimic the function of natural wetlands to efficiently and effectively remove sediments and pollutants from stormwater and capture stormwater when it rains, reducing runoff.
Erosion: The gradual removal of rock or soil due to natural earth processes that wear them away.
Green roofs: Specially designed roofs that are outfitted with plants that intercept rainwater before it becomes stormwater runoff. Green roofs promote evaporation through plants, known as evapotranspiration, to reduce stormwater runoff from the building.
Green stormwater infrastructure (GSI): A practice that mimics nature, and cleans stormwater on-site, minimizing stormwater runoff.
Impervious: A surface that does not allow liquid to pass through.
Infiltrate/Infiltration: The process of stormwater soaking into the ground.
Outlet: the mouth of a stream or river, where the stream or river meets another water body, such as a river or lake.
Permeable pavement: Pavement that allows stormwater to infiltrate through it. Permeable pavement can replace traditional impervious surfaces in parking lots, sidewalks, roads, and driveways. It helps to reduce stormwater runoff and minimizes pollution to local waterways.
Pervious: A surface that allows liquid to pass through.
Nonpoint source pollution: Pollution that comes from diffuse sources across the landscape.
Point source pollution: Pollution that comes from a specific source.
Pollutant: A substance that causes contamination, often in water or air.
Rain barrels: Barrels that are designed to collect stormwater runoff from roofs. Rain barrels reduce the volume of stormwater runoff and associated pollutants that enter waterbodies due to storm events. Collected rain water can be used to irrigate (water) gardens and lawns during drier periods.
Rain gardens: Landscaped depressions that are designed to capture, treat, and infiltrate stormwater.
Rain gauge: A device that collects and can be used to measure how much rain falls during a storm.
Runoff: The water that falls to the earth as precipitation or that melts from snow, ice or other type of frozen precipitation. This is also known as stormwater runoff.
Runoff coefficient: A value that is used to estimate the proportion of rain that becomes runoff as it moves across pervious and impervious surfaces.
Specific conductance: A measure of electrical conductivity of water.
Storm drain: An opening along the edge of a city street into which stormwater can flow.
Stormwater: The water that falls to the earth as precipitation or that melts from snow, ice or other type of frozen precipitation.
Stormwater runoff: Water that falls to the earth as precipitation or that melts from snow, ice or other type of frozen precipitation that flows across the land. This is also known as runoff.
Topographic map: A map that shows elevation of the landscape, natural features such as waterways, and manmade features such as roads and gravel pits.
Volume: The amount of space that a substance occupies.
Water quality: A measure of how clean the water is.
Watershed: The area of land that drains to a waterbody.


