34 minute read
by M.J.T. Sebola, G.R. Drennan, and N.J. Wagner
from Saimm 202208 aug
by SAIMM
Affiliation:
1School of Geosciences, University of the Witwatersrand, South Africa. 2DSI-NRF CIMERA, University of Johannesburg, South Africa.
Advertisement
Correspondence to:
M.J.T. Sebola
Email:
mjtsebola@yahoo.co.uk
Dates:
Received: 22 Mar. 2022 Revised: 4 Jul. 2021 Accepted: 12 Jul. 2021 Published: August 2022
How to cite:
Sebola, M.J.T., Drennan, G.R., and Wagner, N.J. 2022 Petrographic and geochemical characteristics of beneficiated metallurgical coal from the No. 6 Seam, Tshipise sub-basin, Soutpansberg coalfield, South Africa. Journal of the Southern African Institute of Mining and Metallurgy, vol. 122, no. 8, pp. 461–472
DOI ID: http://dx.doi.org/10.17159/24119717/2061/2022
ORCID: M.J.T. Sebola https://orcid.org/0000-00020213-4390 G.R. Drennan https://orcid.org/0000-00018715-1597 N.J. Wagner https://orcid.org/0000-00024046-4788
Synopsis
The Soutpansberg Coalfield hosts South Africa's hard coking coal reserves. However, coals in this region are understudied compared to other coalfields in the country.
This study characterizes the properties of fine-float fraction samples extracted from a wide diameter borehole core in the Makhado Project, Tshipise sub-basin, Soutpansberg coalfield. Conventional analyses were used to determine the coal quality, petrographic composition, mineralogy, geochemistry (including trace element and rare earth element composition), and free swelling index of samples from six coal horizons and three partings from the economic No.6 Seam.
The coal samples are classified as medium rank bituminous C coals (0.88 %RoVmr, 0.92 %Rmax) and are highly vitrinitic in composition (97 vol% mineral matter free (mmf)). The samples show strong caking potential (FSI of 9). The total rare earth concentrations range between 570 and 3193 ppm in the ash samples. Preliminary analysis show all but two samples are promising sources of rare earth elements as the total concentrations exceeded the 1000 ppm cut-off grade. Further research is required to confirm these preliminary findings.
Keywords
coal, density fractionation, vitrinite, rare earth elements, trace elements in coal.
Introduction
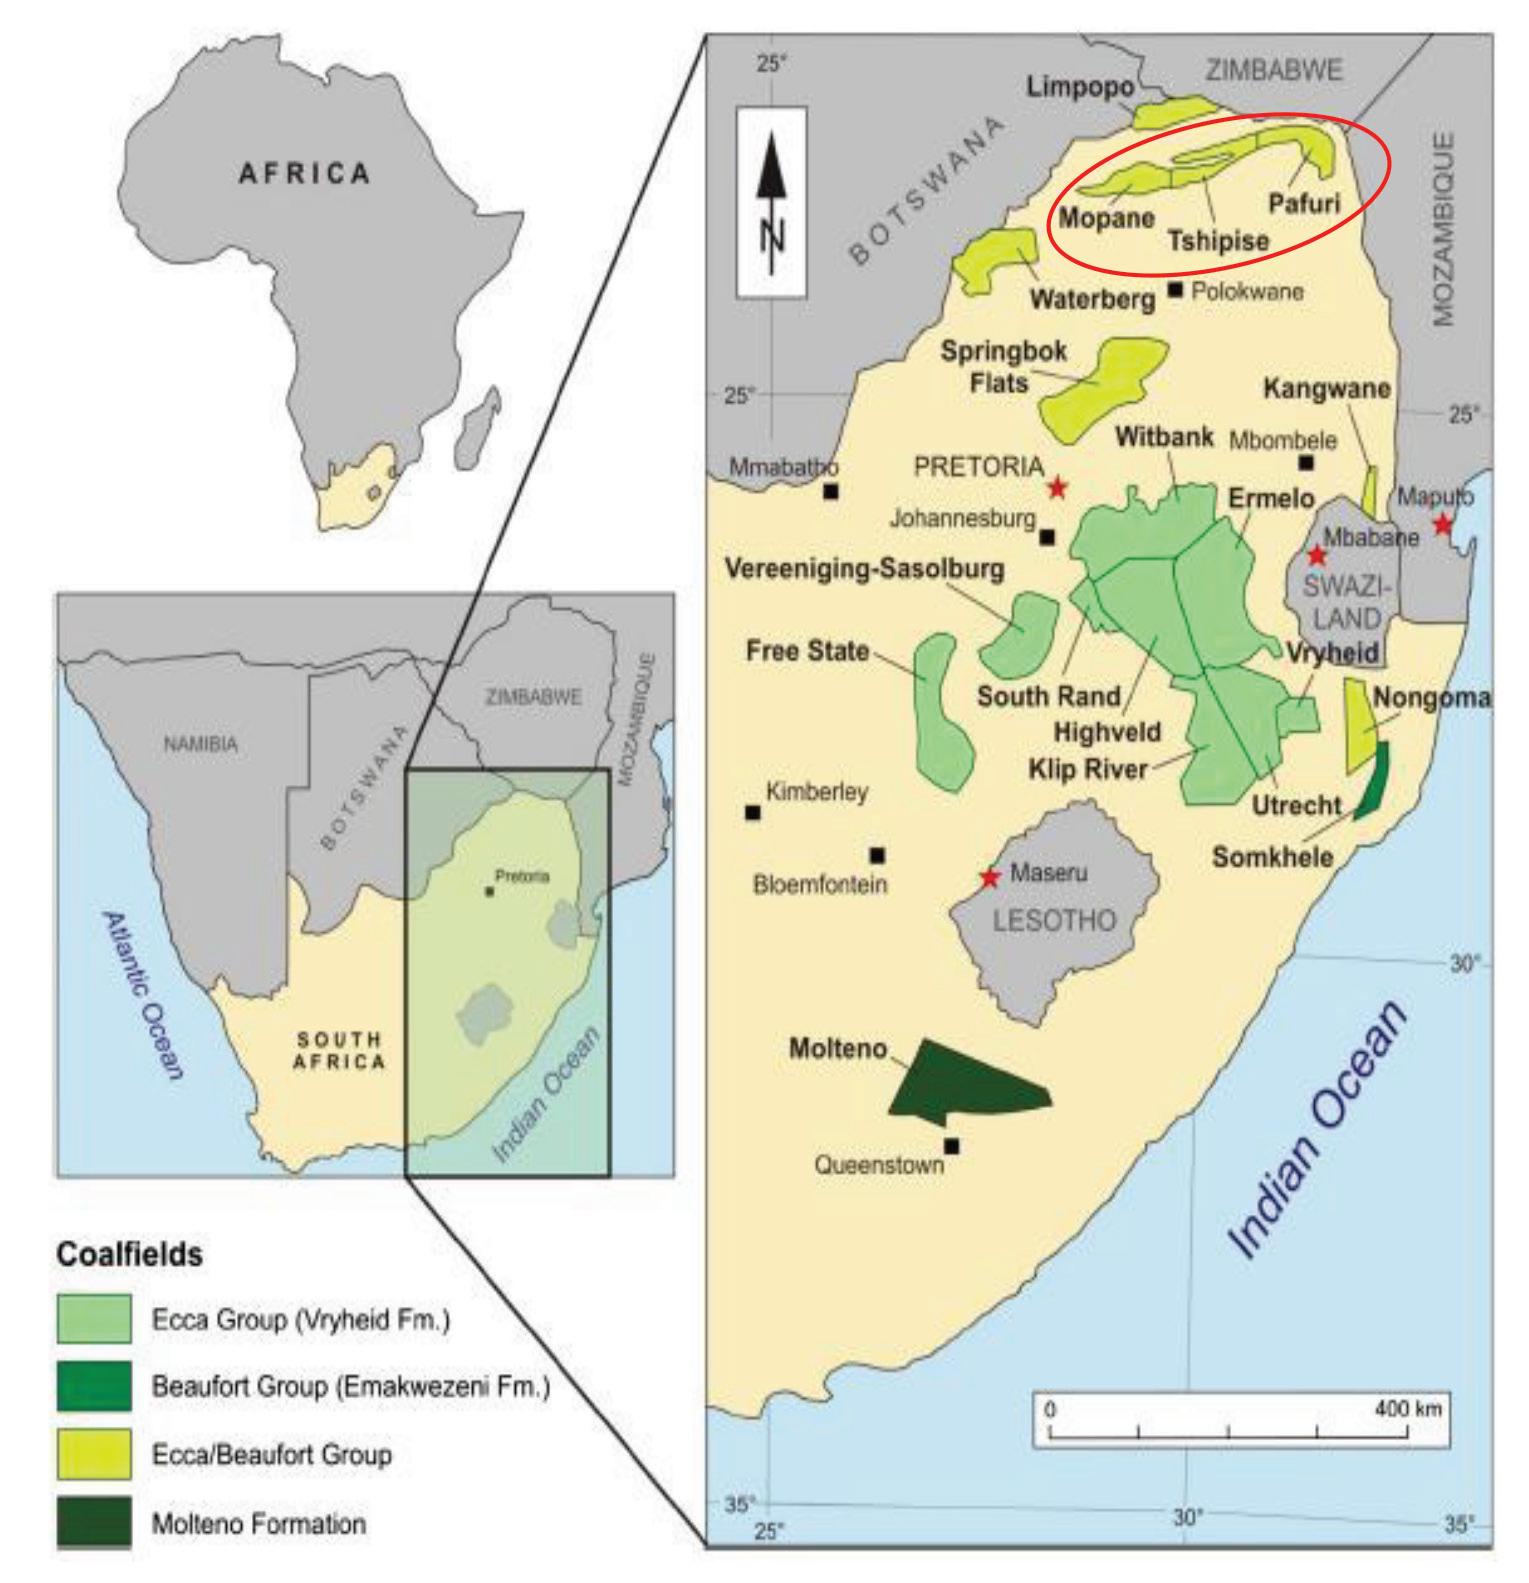
South African coalfields predominantly host coals of thermal quality, which are used to generate over 70% of the country’s energy (Minerals Council, 2022 https://www.mineralscouncil.org.za/). In contrast, approximately 1% of the coal mined in South Africa is of metallurgical/coking quality ((IEA, 2017; Peatfield, 2003; Prévost, 2013). The quality of metallurgical coals that are mined in South Africa are largely limited to semi-soft coking coal (SSCC) and pulverized coal for injection (PCI) coal (Hancox and Götz, 2014; Jeffrey, 2005). Metallurgical coal is extracted from the Grootegeluk Coal Mine (approx. 2.5 Mt/a) in the Waterberg Coalfield, and to a smaller extent from selected seams in the Main Karoo Basin (MKB): Witbank, Ermelo, Klip River, Vryheid, and Utrecht coalfields, as well as the Nongoma, Sonkhele and Kangwane coalfields (Figure 1). Due to the limited local supply, South Africa imports metallurgical coal to the value of R4 billion to meet annual demand for its iron and steel industry (Chamber of Mines, 2018; Prévost, 2013).
Significant deposits of hard coking coal (HCC) in South Africa are known to occur in the Soutpansberg coalfield. Here prime HCC was exploited from the eastern sector of the coalfield, at Tshikondeni Coal Mine between 1984 and 2014 (Hancox and Götz, 2014; Jeffrey, 2005; Prévost, 2017). However, published studies detailing the coal characteristics in this coalfield are limited despite the mining activity.
Metallurgical coal (coking coal) and graphite are recognized as critical raw materials for the development of clean technology and clean energy (Duda and Fidalgo Valverde, 2021; European Commission, 2020; York and Bell, 2019). In addition, hard coal and coal ash are increasingly being studied for the concentration and potential extraction of other critical raw materials, specifically rare earth elements (REEs) (Dai, Graham, and Ward, 2016; Dai et al., 2017; Dai and Finkelman, 2018; Franus, Wiatros-Motyka, 2015; Fu et al, 2022; Scott and Kolker, 2019; Seredin and Dai, 2012; Peiravi et al., 2017; Predeanu et al., 2021, among many others). China`s dominance in REE reserves, coupled with its restrictions on REE trade, as well as the high global demand for REEs, has ignited significant efforts into exploration and research to identify alternative unconventional REE sources (Eterigho-Ikelegbe, Harrar, and Bada, 2021; Huang, Fan, and Tiand, 2018; van Gosen et al., 2014; Zhang et al., 2020). Investigation into
Figure 1—Distribution of South African coalfields (Hancox and Götz, 2014). Circled in red: the Mopane, Tshipise and Pafuri sub-basins constitute the Soutpansberg coalfield
the potential extraction of REEs from South African coals and ash has received some attention, with published studies limited to coal and ash from the MKB (Akdogan et al., 2019; Akinyemi et al., 2012; Cornelius et al., 2021; Eze et al., 2013; Hart, Leahy, and Falcon, 1982; Wagner and Matiane, 2018).
Considering the limited literature available on Soutpansberg coals, as well as the high value placed on metallurgical coal, and the need to seek alternative REE resources, the aim of this paper is to present the petrographic and geochemical characterization of beneficiated metallurgical coal product from the No. 6 seam horizons of the Tshipise sub-basin of the Soutpansberg coalfield. The significance of this research is the contribution towards understanding the properties of metallurgical coal from the Soutpansberg coalfield. Moreover, the geochemical data presented is a preliminary evaluation of the occurrence of REE in the beneficiated coal ash product.
Geological setting
The Soutpansberg Coalfield is an intracratonic rift basin of Karoo age located in the Limpopo Province of South Africa (Figure 1). It is divided into three sub-basins, namely the western (Mopane sub-basin), central (Tshipise sub-basin), and eastern (Pafuri subbasin) (Malaza, 2013). Deposition of the stratigraphic units of the Soutpansberg coalfield was concurrent with those of the Karoo Supergroup in the MKB, which occurred from the end of the Carboniferous period (300 Ma) to the mid-Jurassic (183 Ma) and shows evidence of transition from a glacial to arid climate (Cadle et al., 1993; Cairncross, 2001). The Karoo-age strata in the Soutpansberg coalfield were deposited in horst and graben structures, in thinner sedimentary units compared to the MKB coal-bearing strata (Catuneanu et al., 2005; Johnson et al., 2006). Coal seams occur in the Madzaringwe Formation and the overlying Mikambeni Formation, seven economically viable seams being found in the former (Figure 2) within the Tshipise sub-basin (Sparrow, 2012). The Madzaringwe Formation is the equivalent of the coal-bearing sediments of the Ecca Group in the MKB (Hancox and Götz, 2014). Of the seven coal seams identified, the sixth seam (herein referred to as the No. 6 Seam) is the primary economic target and is further divided into six distinct horizons or plies: Seam Bottom Lower (SBL), Seam Bottom Middle (SBM), Seam Bottom Upper (SBU), Seam Middle Lower (SML), Seam Middle Upper (SMU), and Seam Upper (SU) (de Klerk and Sparrow, 2015; Sparrow, 2012). These horizons are characterized by relatively thin vitrinitic bands that are interbedded with carbonaceous mudstone and shale (Hancox and Götz, 2014).
Materials and methods
Samples and sample preparation
The samples originate from a large diameter drill core obtained from the Makhado Project in the Tshipise sub-basin of the Soutpansberg coalfield. The drill core intercepts the No. 6 coal seam of the Madzarinwge Formation (Figure 2), and six coal horizons (SU, SMU, SML, SBU, SBM, and SBL) and three partings
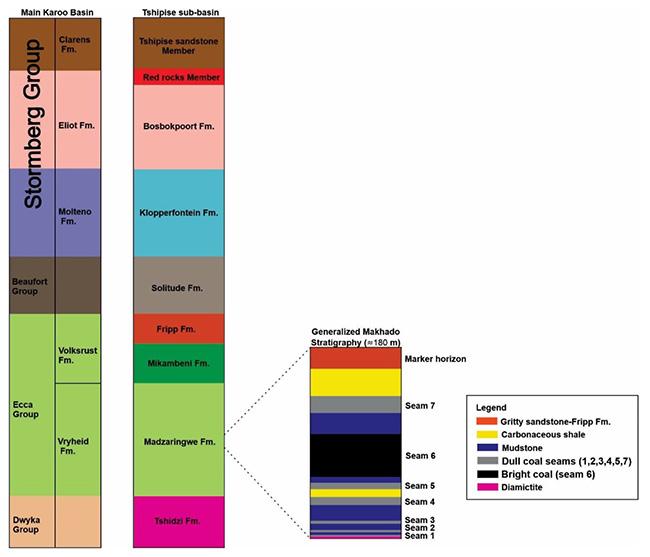
Figure 2—Stratigraphic correlation of the Karoo Supergroup in the Main Karoo Basin and the Tshipise sub-basin, Soutpansberg Coalfield (Modified after Luyt, 2017; Sparrow 2012). Samples in this study originate from the upper seams (SU, SMU, and SML), bottom seams (SBU, SBM, and SBL), and partings (P1, P2, and P3)
(P1, P2, and P3) were sampled. Nine samples were subjected to drop shatter, dry tumble and wet tumble tests to estimate the particle size distribution expected during the transportation, handling, and processing of the coals (data not reported herein; refer to Sebola, 2022). Float-sink testing was conducted on the resultant daughter particles to determine suitable washability conditions for the production of a 10% ash metallurgical product. The test procedures are detailed by Sebola (2022). Washability analyses indicated that the fine size fraction (-1+0.25 mm) at a density of 1.30-1.70 g/cm3 was suitable for a 10% ash product. The fine-sized float fractions are discussed in this paper.
The -1+0.25 mm samples were coned and quartered and the first quarter was reserved for coal petrography. Two quarters were milled to -212 μm and split further for coal quality determination: proximate analyses, total sulphur, free swelling index (FSI) and X-ray diffraction (XRD). The remaining quarter of the sample material was ashed for geochemical analyses: major oxide, trace element, and REE+yttrium and scandium content. Ashing was carried out by gradually heating the coal to a maximum temperature of 815°C over a three-hour period (following Dai et al, 2017) at MAK Analytical Laboratory, Johannesburg. Sample characterization Coal quality determination The proximate analyses entailed the determination of ash (ISO 1171), inherent moisture (SANS 5925), volatile matter (ISO 562), and fixed carbon by difference. Total sulphur was determined using the Leco CHN 628 based on ASTM standard D4239. The analyses were conducted at the coal laboratory in the Council for Geoscience, Pretoria.
Petrographic blocks were prepared according to SANS/ISO 7404-2, ensuring smooth, scratch-free surfaces for analysis. Coal petrography was conducted using a Zeiss Axio Imager M2M petrographic microscope equipped with a Hilgers Fossil system housed at the University of Johannesburg, at a total magnification of 500x using a 50x oil immersion lens. Macerals and mineral groups were determined following SANS/ISO 7404-3 in nonpolarized white reflected light; UV light was used to confirm liptinite macerals.
Random (%RoVmr) and maximum (%Rmax) vitrinite reflectance measurements were taken broadly following SANS/ ISO 7404-5. The monochrome camera was used to measure the %RoVmr and %Rmax on a minimum of 100 points of collotelinite in each sample. Measurements were taken under green reflected light using a 50x oil objective in non-polarized (RoVmr) and polarized (RoVmax) light. The microscope was calibrated using an yttrium-aluminium-garnet (YAG) 0.900%.
The coking properties of the samples were inferred by FSI, conducted according to ISO 501, at the Council for Geoscience laboratory. The FSI allowed for rapid, and cost-effective determination of the coking properties. Detailed assessment of the plasticity and cokability of the samples was beyond the scope of the study.
The mineral composition was determined using XRD. Diffractograms were obtained using a Malvern Panalytical Aeris diffractometer with PIXcel detector and fixed slits with Fe-
filtered Co-K radiation. The phases were identified using X’Pert Highscore Plus software. The relative phase amounts (weight %) were estimated using the Rietveld method. The samples were analysed at XRD Analytical and Consulting cc, based in Pretoria.
The XRF analysis was carried out at the Earth Lab, University of the Witwatersrand. Major elements were determined by the Norrish Fusion 1 technique using in-house correction procedures. The instrument used was the Panalytical Axios X-ray spectrometer and samples were analysed at 50 kV and 50 mA. Major elements were fused using Johnson Matthey Spectrolflux 105 at 1000°C into a glass bead and raw data corrected using in-house software. Standard calibrations were made up using synthetic oxide mixtures and international standard rocks as well as in-house controls. Sample weight used was 0.35 g and flux weight 2.0 g. Calibration standards include primary International Reference Materials USGS series (USA) and NIM series (South Africa). Precision is taken as 1% for elements having abundances of greater than 5% by weight, and 5% for elements with abundances less than 5%.
Trace element and REY+Sc determination It is of interest to determine the leves of trace elements and REEs, including yttrium (REY) and scandium (REY+Sc) of the Makhado No. 6 seam ashed samples . Assessment of these elements is important to determine the level of potentially harmful elements, as well as their economic potential as a secondary source of critical REE (Huang, Fan, and Tiand, 2018; Kumar and Kumar, 2018; Dai et al., 2017).
The ICP-MS method was utilized for the identification and quantification of trace elements and REY+Sc using the Thermo Scientific iCAP RQ instrument at the Earth Lab, University of the Witwatersrand. The ashed samples were digested in a microwave digester (MARS from CEM) using ultra-high purity 2:1 HF:HNO₃. The instrument is optimized for maximum counts on oxide levels set to less than 2% as well as doubly charged ions set to less than 2%. Three replicate measurements were recorded and averaged for each sample. Replicates deviating by more than 2% were flagged.
The trace element and REY+Sc data for the ashed samples was compared to values determined for the upper continental crust (UCC) by Taylor and McLennan (1985), as well as the Clarke values for world hard coals on ash-basis determined by Ketris and Yudovich (2009). Comparison to the UCC and Clarke values allowed the best comparison to trace element concentrations in conventional rock sources and global coal ash.
Results and discussion
Coal quality characterization
The coal quality data for the fine density fractionated float samples is reported in Table I.
The samples are characterized by low ash (3-5%, db) and high fixed carbon, as expected in this beneficiated product range. The volatile matter (daf) showed minor variation through the sequence and averaged 33%. The total sulphur content varied between 0.98 and 1.47%, with samples from the bottom horizons containing the least sulphur. All samples are strongly caking (FSI of 9) and suggest excellent coking properties pending specialized coking tests such as the Roga test (ISO 335) and Giseler plastometer test (ASTM D-2639) which are necessary to confirm the carbonization properties of the fine samples.
The major oxides occurring in the samples are silica (SiO₂, 42-67%), aluminium oxide (Al₂O₃, 14-27%), titanium dioxide (TiO₂, 5-14%), ferric oxide (Fe₂O₃, 2-7%), calcium oxide (CaO, 2-4%), and magnesium oxide (MgO, 1-2%). The remaining oxides are generally present in quantities less than 1%. Samples from the bottom seams had higher amounts of Al₂O₃, CaO, Na₂O, K₂O, and P₂O₅ compared to the upper seams and partings. Samples from the upper seams and partings showed higher amounts of SiO₂, Fe2O₃, and NiO.
The alkali content (Na₂O+ K₂O) varied from 1.21-1.95% and therefore exceeded the recommended 1.5% limit set for coking coals (Xaba, 2004) in all samples excluding SU and P1. The percentage phosphorus (%P) present in the ash of the samples was calculated from the P₂O₅ values (Table I) using the formula from Schernikau (2017):
[1]
Samples from the bottom seams reported higher %P (0.0390.065%) compared to the upper seams (0.001-0.004%) and partings (0.005-0.008%). Moreover, the %P exceeded the limit (%P ≤ 0.010%) for coking coals used in the South African steel industry (Xaba, 2004). Likewise, samples from the bottom seams, as well as P1, SML, and P3 exceeded the limit (%P ≤ 0.006%) for coking coals used in the South African ferro-alloy industry (Xaba, 2004). There is a need to further explore the occurrence of P-bearing minerals in these coal samples; further processing will be necessary to reduce the alkali and P contents to acceptable industry levels.
Table I
Coal quality of the -1+0.25mm samples

The mineral content determined by XRD (Table II) is low, predominantly consisting of quartz (1.30-3.20%) and kaolinite (0.70-2.30%). Minor tridymite (≤ 0.90%), a high-temperature polymorph of quartz, was also detected in the samples, possibly due to elevated temperature during XRD analysis. Additional minerals such as pyrite and siderite were below the detection limit of 0.5-3 wt%. The XRD and XRF data are in agreement as the measured high silica (SiO₂) and aluminium (Al₂O₃) correspond to the dominance of quartz and kaolinite reported in the samples. Petrographic characterization
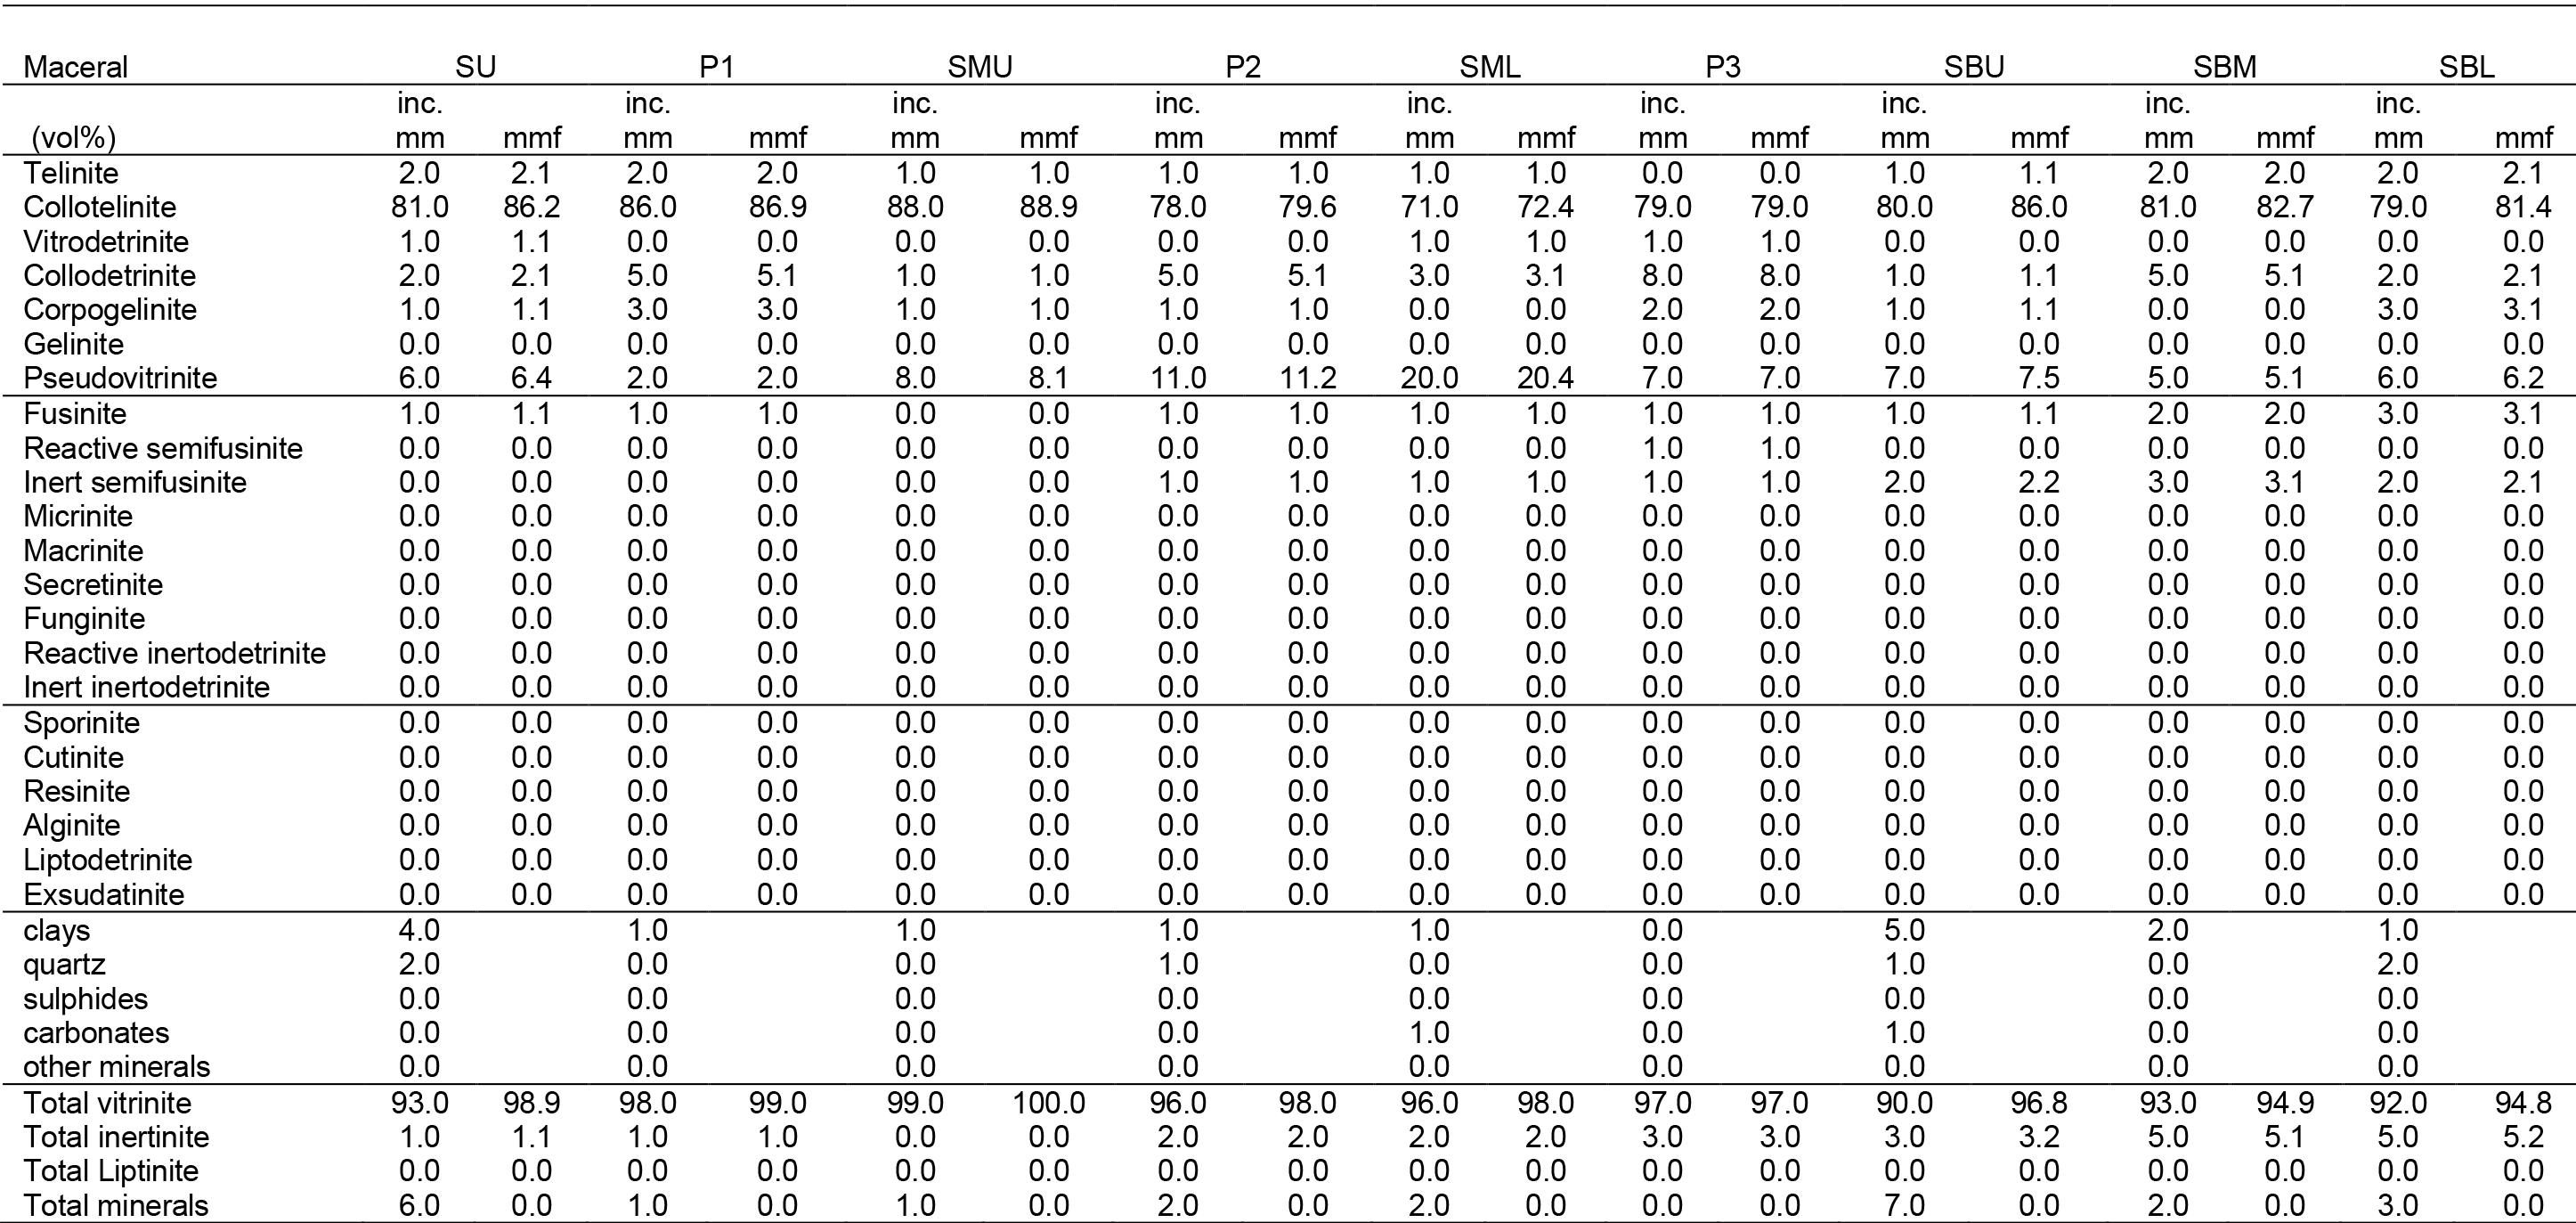
The samples are classified as medium rank C bituminous coals (ECE-UN, 1998), showing average %RoVmr values of 0.88% (Table III). The %Rmax readings show average values of 0.92% (v9). The petrographic composition (Table IV) is highly vitrinitic consisting of collotelinite up to 89 vol% (mmf). The collotelinite occur predominantly as smooth homogeneous particles, typically ≥ 150 μm in diameter (Figure 3A). Pseudovitrinite was detected in all samples, on average 8 vol% (mmf); sample SML contains very high (20 vol% mmf) pseudovitrinite. The pseudovitrinite particles are characterized by desiccation slits orientated perpendicular to bedding or sometimes randomly oriented (Figure 3B). Although pseudovitrinite is known to have a deleterious effect on the coking properties of metallurgical coal, studies have shown pseudovitrinite to be reactive under certain coking conditions (Kruszewska, 1998; Sahajwalla, 2012). Furthermore, the adverse effects of pseudovitrinite in the Makhado fines may be negligible due to the very high collotelinite content and FSI values. Inertinite constitutes up to 6 vol% (mmf), and includes fusinite, semifusinite (inert and reactive), and secretinite (Figure 3C-E). Overall, the reactive component of the samples is mainly vitrinite and minor reactive semifusinite.
From a utilization point of view, the ratio of fusinite and other inertinites relative to vitrinite is favourable as low amounts of inertinite in act to improve coke strength during carbonization (Suárez-Ruiz and Crelling, 2008). This is consistent with the high reactive versus inert maceral ratios for South African coking coals (Jordan, 2008; Powell, 2016).
The petrographically observable minerals occupy less than 3 vol% on average and consist predominantly of clay minerals and quartz (Table IV). Siderite, calcite and pyrite were rarely observed. The minerals are finely disseminated within the macerals and are indicative of syngenetic origins (Figure 3FL). Syngenetic minerals are difficult to liberate by physical beneficiation due to their intimate association with the macerals (Bhattacharya, Maheshwari, and Panda, 2016; Subba-Rao and Gouricharan, 2016).
Table II
Mineral species in the -1+0.25 mm samples (wt%)
Sample Quartz Kaolinite Tridymite Organic LOI (SiO₂) (Al₂Si₂O₅ (SiO₂) carbon (C) (OH)₄)
SU 3.20 0.70 0.40 95.70 96.55 P1 2.00 1.00 0.40 96.60 97.14 SMU 1.60 1.20 0.40 96.80 97.25 P2 2.60 1.20 0.50 95.80 95.25 SML 2.20 1.50 0.80 95.50 96.16 P3 1.30 1.30 0.60 96.80 95.56 SBU 2.50 2.30 0.90 94.30 94.82 SBM 2.00 1.90 0.70 95.40 95.59 SBL 2.00 1.80 0.80 95.30 95.35 Trace elements in coal ash
The trace element concentrations for the fine-sized samples (ash) are comparable to the Clarke coal ash values (Figure 4 and Table V). The trace elements occur in concentrations up to 47 412 ppm (Ti, Zr, V, Sr, P), 1200 ppm (Ga, Ni, Nb, Cu, Pb, Co, Hf), and 146ppm (Li, U, Th, Rb, Sb, W, Sn, Cs, Ta), respectively. Only Tl occurs in concentrations below 1.5 ppm. Samples from the bottom seams show higher concentrations of Ba, Sr, P, Cu, U, Th, Cs, and Tl. Overall, samples P3 (89 745 ppm), SBL (77 905 ppm) and P1 (77 041 ppm) contain the highest total trace element concentrations.
Trace elements considered to be of environmental and health concern include As, B, Cd, Hg, Mo, Pb, Se, Cr, F, Cl, Cu, Ni, V, Zn, Ba, Co, Ge, Li, Mn, Sb, Sr, Rn, Th, U, Be, I, Ra, Sn, Te and Tl (Finkelman, 1999; Swaine, 2000; Vejahati, Xu, and Gupta, 2010.). In the present study, hazardous trace elements determined were limited to Pb, Cr, Cu, Ni, V, Zn, Ba, Co, Li, Sb, Th, U, Sn, and Tl due to instrument limitations. The aforementioned elements are listed in order of decreasing environmental concern, and range in concentration between 0.274 and 9650 ppm (Figure 4 and Table V).
REY+Sc in coal ash
The REY+Sc concentrations (Table VI) for the Makhado fine-size samples (ash) generally follow a similar distribution pattern to the crustal abundance (UCC) and Clarke coal ash trend (Figure
Table III
Maceral reflectance and rank determination for the -1+0.25 mm samples
Maximum reflectance %Rmax Sample %RoVmr St.dev. Min. Max. Rank %Rmax Min. Max. St.dev. Vitrinoid type (v-type)
SU 0.87 0.077 0.60 1.10 Medium rank C 0.90 0.60 1.15 0.079 V9 P1 0.89 0.068 0.65 1.10 Medium rank C 0.92 0.70 1.10 0.068 V9 SMU 0.87 0.065 0.65 1.05 Medium rank C 0.90 0.70 1.05 0.064 V9 P2 0.88 0.065 0.65 1.05 Medium rank C 0.92 0.75 1.10 0.066 V9 SML 0.91 0.061 0.70 1.05 Medium rank C 0.94 0.75 1.10 0.063 V9 P3 0.87 0.079 0.60 1.10 Medium rank C 0.90 0.65 1.10 0.081 V9 SBU 0.89 0.067 0.70 1.05 Medium rank C 0.93 0.75 1.10 0.069 V9 SBM 0.89 0.064 0.75 1.10 Medium rank C 0.92 0.75 1.10 0.066 V9 SBL 0.87 0.078 0.60 1.10 Medium rank C 0.91 0.65 1.15 0.080 V9
Table IV
Maceral group analyses (vol%) of the -1+0.25 mm samples (vol %)
5). Although the REY+Sc concentrations of the fine-size samples greatly exceed the UCC values, they are comparable to the Clarke coal ash concentrations.
Overall, the total REY+Sc (REY+ Sc) concentrations are highest in the bottom seams (2521-3193 ppm) compared to the upper seams (570-1342 ppm). Sample P3 contains comparable REY+Sc concentrations (2604 ppm) to the bottom seams. The total LREE+Sc (LREE+Sc) concentrations (300-2618 ppm) are higher compared to 213-1454 ppm for the total MREE+Y (MREE+Y), 57-178 ppm for total HREE (HREE) concentration. The order of decreasing abundance observed in the samples for the LREE+Sc follows the general trend Ce>La>Nd>Sc>Pr>Sm, while the MREE+Y trend generally follows Y>Dy>Gd>Eu>Tb. The HREE generally follow a trend of Yb>Er>Ho>Tm>Lu.
The REY considered as critical to the economy due to their undersupply (Y, Nd, Dy, Er, Eu, and Tb) are in the range 268-979 ppm, generally reaching their maximum in sample P3 and samples from the lower seams. Pr, which is also in high demand occurs above 100 ppm only in the lowermost seams.
The UCC-normalized graph (Figure 6A) shows that samples from the upper seams and partings exhibit enrichment from 2 to 20 times, compared to 9 to 33 times in sample P3. Enrichment in the bottom seams is in the range 10 to 23 times. Notably, Sc and Y show enrichment factors of 32 and 24 respectively in sample P3. Enrichment levels relative to the Clarke hard coal ash values are 5 times higher in samples from the upper seams, 8 times higher in the bottom seams, and 10 times higher in the partings (Figure 6B). The LREE/HREE ratios show that LREEs are slightly more enriched in the bottom seams, while the upper seams show higher HREE enrichment. The UCC- and Clarke- normalized curves are generally smooth. However, a zig-zag pattern is observed between Nd and Dy on the UCC-normalized curves (Figure 6A). The zigzag pattern is also apparent for the HREEs (Ho-Lu) on the Clarke- normalized curves (Figure 6B). These anomalies likely arise due to incomplete digestion during sample preparation, or spectral interferences. However, the overall smoothness of the graphs gives confidence in the REY+Sc data (Dai et al., 2017).
Seredin (2010) proposed the outlook coefficient (Koutl) as a rapid method for the preliminary evaluation of economic REE deposits. Dai et al (2017) provided a revised criterion for the preliminary assessment of the REY in coal ash as economic raw materials. The revised outlook coefficient (Coutl) is defined as 'the ratio of the relative amount of critical REY metals in the total REY to the relative amount of excessive REY' (Dai et al., 2017, p. 15), and is calculated as:
[2]
The outlook coefficients are then classified as follows: ➤ Unpromising REY source: Coutl < 0.7 ➤ Promising REY source: 0.7 ≤ Coutl ≤ 1.9 ➤ Highly promising REY source: Coutl > 2.4
In addition to the above Coutl criteria, the REY must be ≥ 1000 ppm in order to meet the minimum cut-off grade required for economic recovery (Dai et al., 2017).
The Coutl value for the Makhado fine-size samples vary from 0.8 to 2.0 and thus indicate promising REY sources (Table VII). The REY for the lower seams as well as P2, SML and P3 exceeds 2000 ppm and therefore meets the cut-off grade (Figure 7). In contrast, samples SU and SMU do not qualify as promising REY sources due to their REY concentrations being less than the required 1000 ppm cut-off grade. South African coal ash samples obtained from power stations in the MKB were similarly disregarded as potential sources of REY due to their REY content falling below 1000 ppm, despite meeting the Coutl criteria (Wagner and Matiane, 2018).
Overall, the concentration of trace elements and REY+Sc in the fine-sized Makhado samples is considered to be abnormally

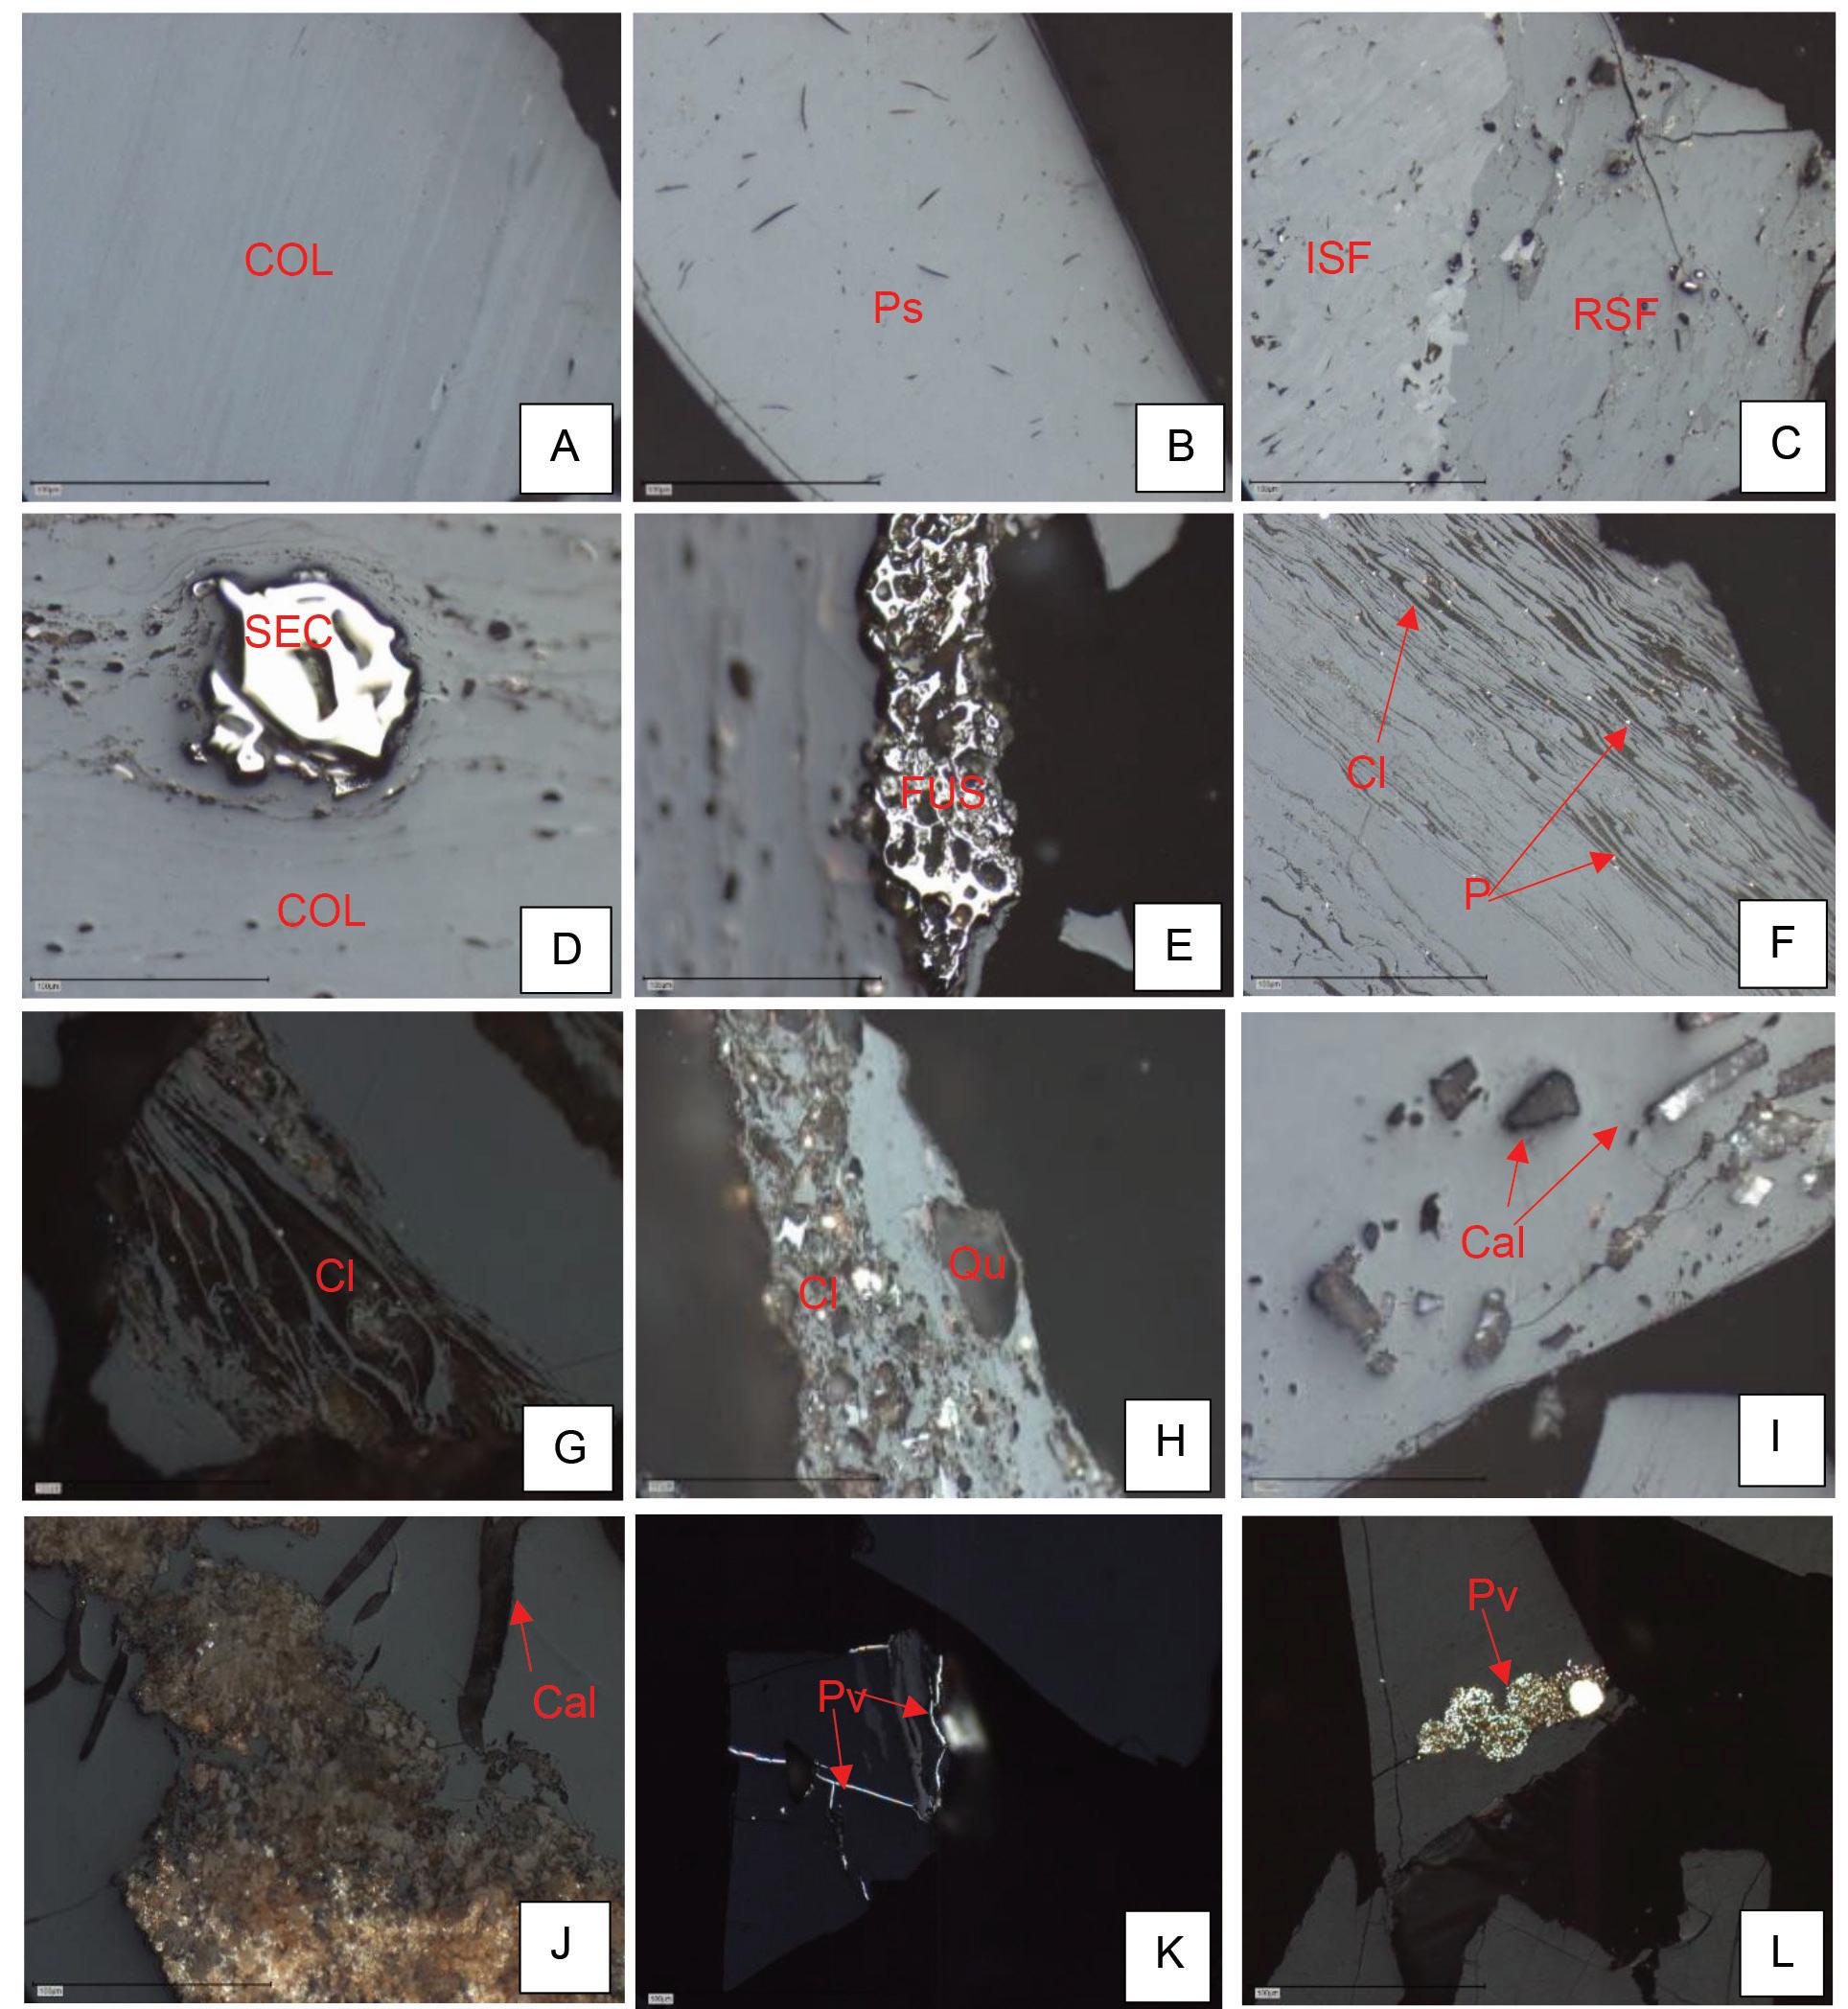
Figure 3—Dominant macerals and minerals occurring in the -1+0.25 mm samples. (A) Dark and lighter bands of collotelinite. (B) Massive pseudovitrinite particle showing randomly oriented slits. (C) Inert semifusinite and reactive semifusinite. D) Secretinite embedded in collotelinite. Note collotelinite wrapped around secretinite. (E) Fusinite char embedded in collotelinite. (F and G) Flocculated clay minerals infilling cell lumens in vitrinite particles. (H) Quartz particles of varying sizes associated with clay minerals. (I) Calcite within collotelinite. (J) Calcite cleats cross-cutting siderite nodule. (K) Pyrite-infilled fractures (L) Clusters of framboidal pyrite occurring within clay minerals. COL = collotelinite. Ps = Pseudovitrinite. ISF = Inert semifusinite. RSF = reactive semifusinite. FUS = Fusinite. SEC = Secretinite. Py = Pyrite. Cl = clay minerals. Qu = Quartz. Cal = calcite. Si = Siderite. Reflected light, oil immersion at 500x magnification. Scale bar = 100 μm
high given the fact that they are beneficiated coals containing of very low ash. Studies show that high concentrations of trace elements and REY+Sc are generally expected in coal sink/discard fractions because they contain high amounts of mineral matter which host the trace elements and REY+Sc (Daim, Graham, and Ward, 2016; Duan et al., 2019; Finkelman, Palmer, and Wang, 2018; Huggins et al., 2009; Kolker et al., 2021; Lin et al., 2017; Wang et al., 2006; Ward, 2016; Wen-feng et al., 2009; Zhang, Honaker, and Groppo, 2017). The trace elements and REY+Sc in the Makhado fine ash samples are likely hosted in the finely disseminated clay minerals i.e., kaolinite which are intricately bound to the vitrinite macerals.
It is recommended that further studies into the modes of occurrence and associations of trace elements and REY+Sc be conducted on corresponding sink fractions to the finefloat samples analysed in this study. This approach will allow for a better understanding of the partitioning behaviour of trace elements and REY+Sc in clean and discard coals during beneficiation.
Conlusions
This study characterized the petrographic and geochemical properties of fine-sized beneficiated metallurgical coals from the Soutpansberg coalfield, South Africa. The samples were selected based on the suitability of their washability characteristics for the production of metallurgical coal. The coal samples were found to show strong caking properties on the basis of FSI and petrographic analyses; however, further testing is required to confirm their carbonization properties. The coal samples as well the partings are medium rank C bituminous coals, vitrinite-rich and very low ash.
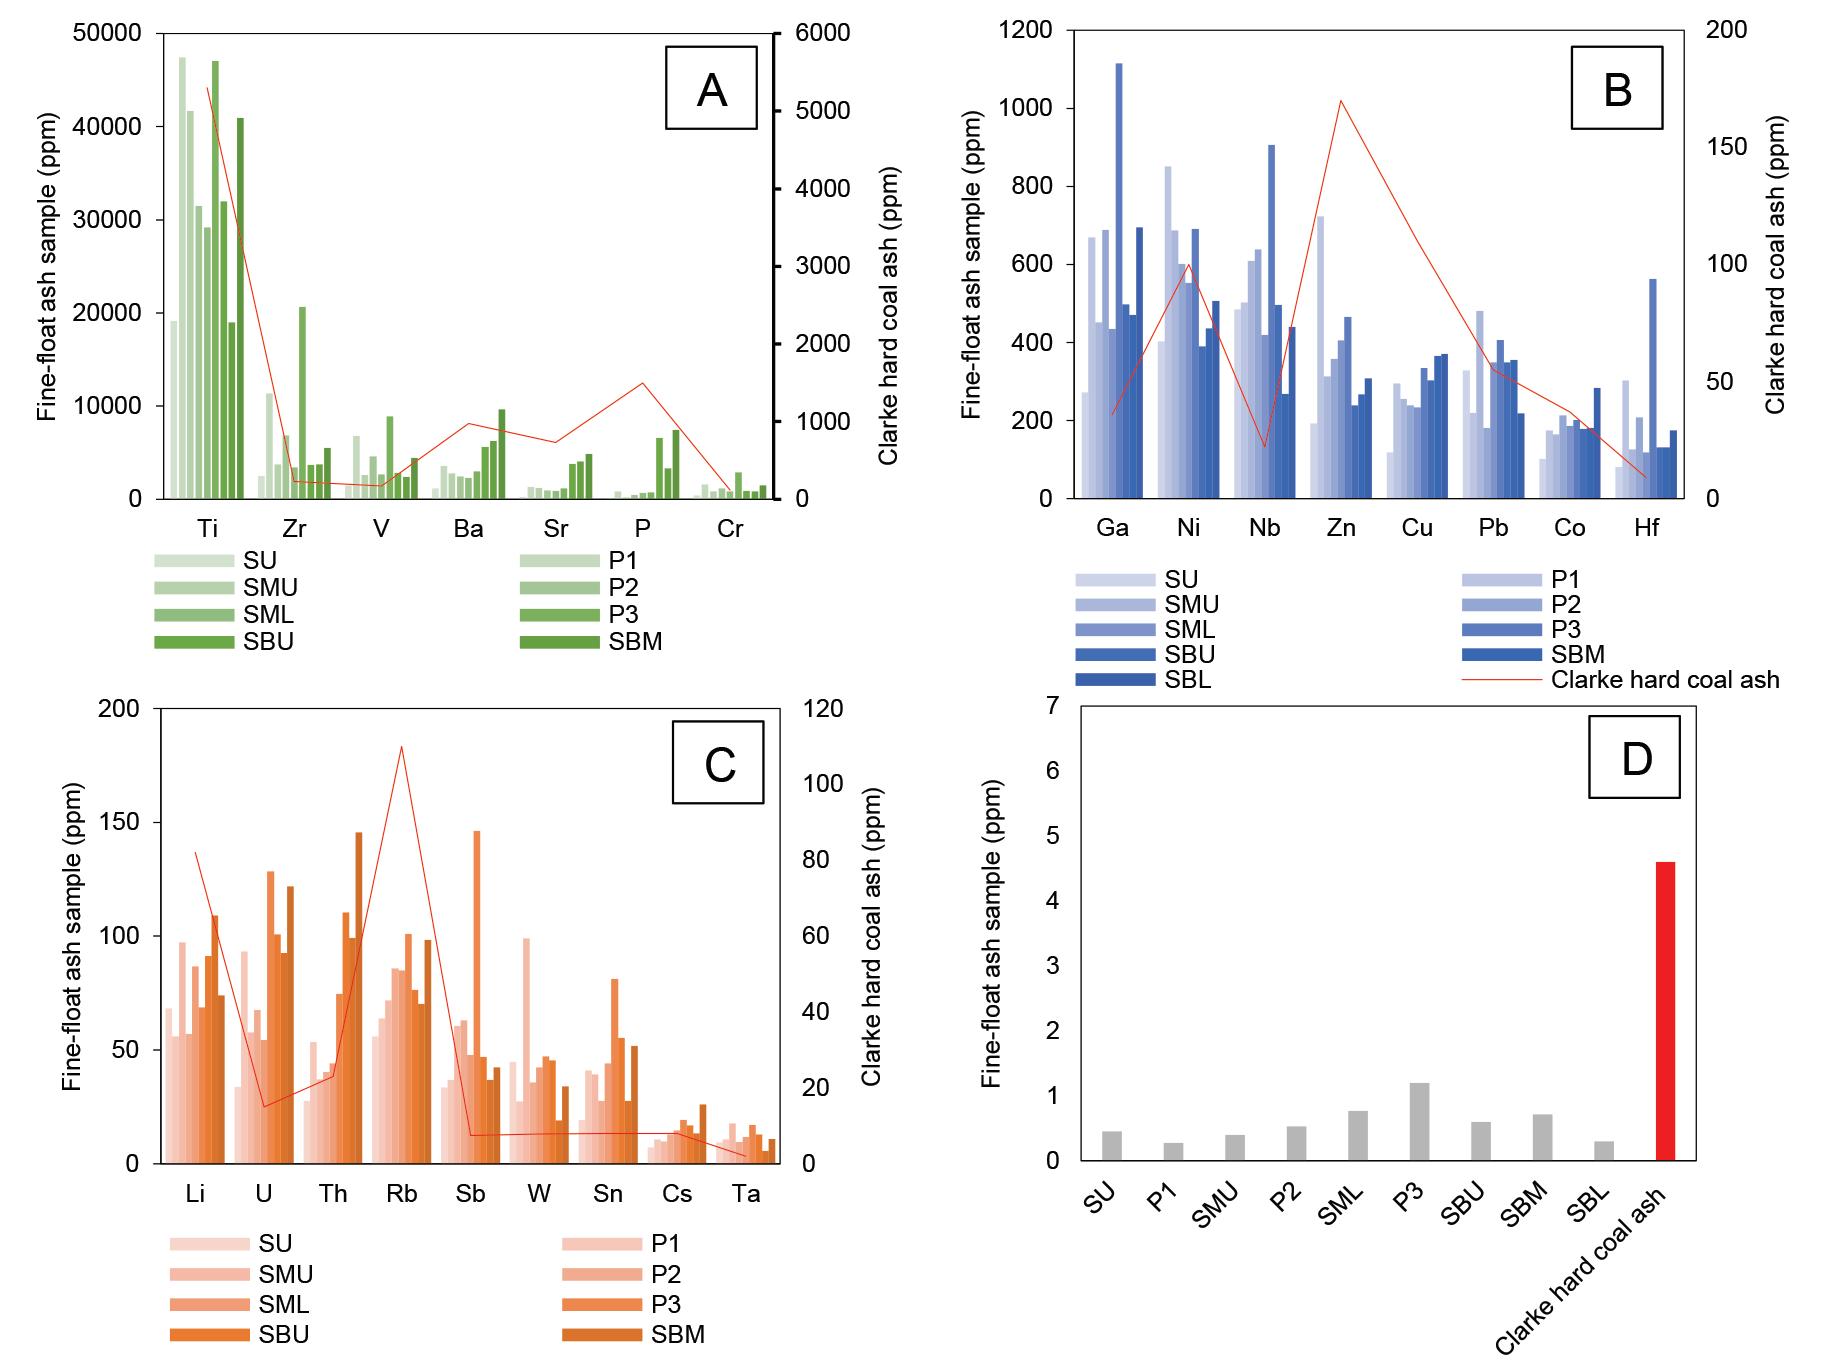
Figure 4—Trace elements concentrations in the -1+0.25 mm ash samples relative to the Clarke hard coal ash values are grouped as (A) Ti, Zr, V, Ba, Sr, P and Cr ≤ 47 412 ppm, (B) Ga, Ni, Zn, Nb, Cu, Pb, Co, and Hf ≤ 1200 ppm, (C) Li, U, Th, Rb, Sb, W, Sn, Cs, and Ta ≤ 146 ppm, (D) Tl ≤ 1ppm
Table V
Trace element concentrations (ppm) in the -1+0.25 mm ash samples
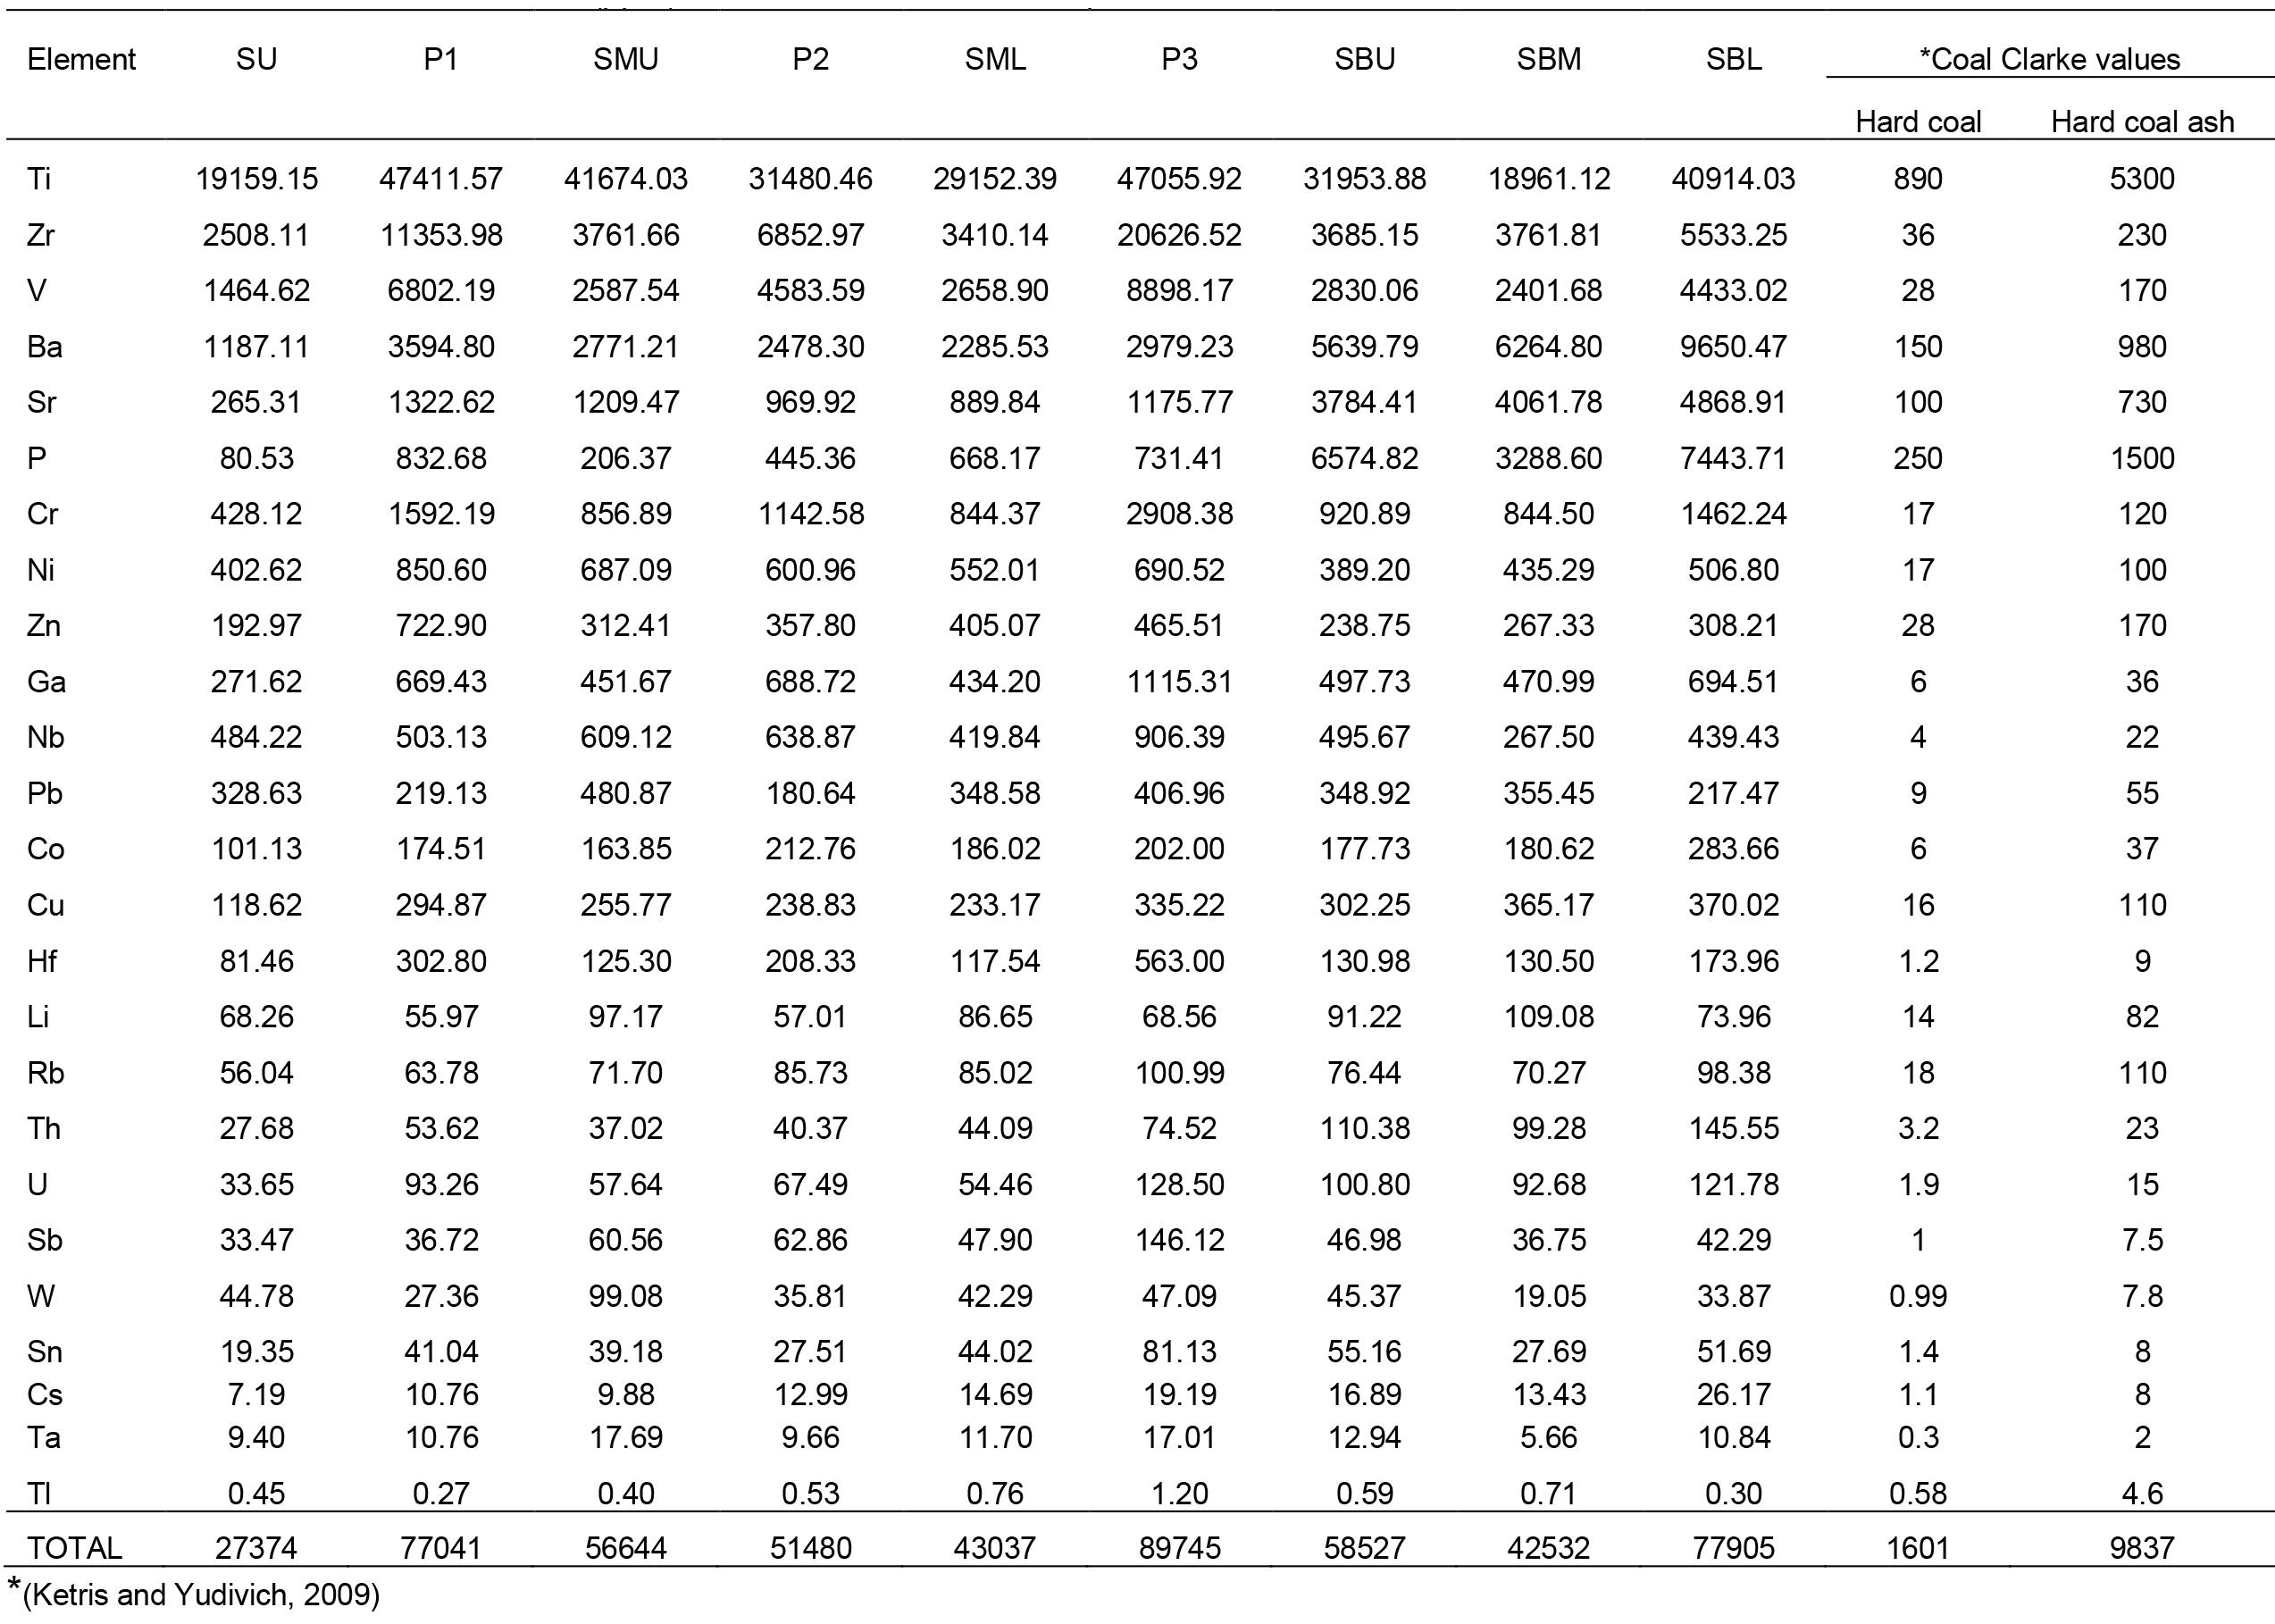
Table VI
REY+ Sc concentrations (ppm) in the -1+0.25 mm ash samples
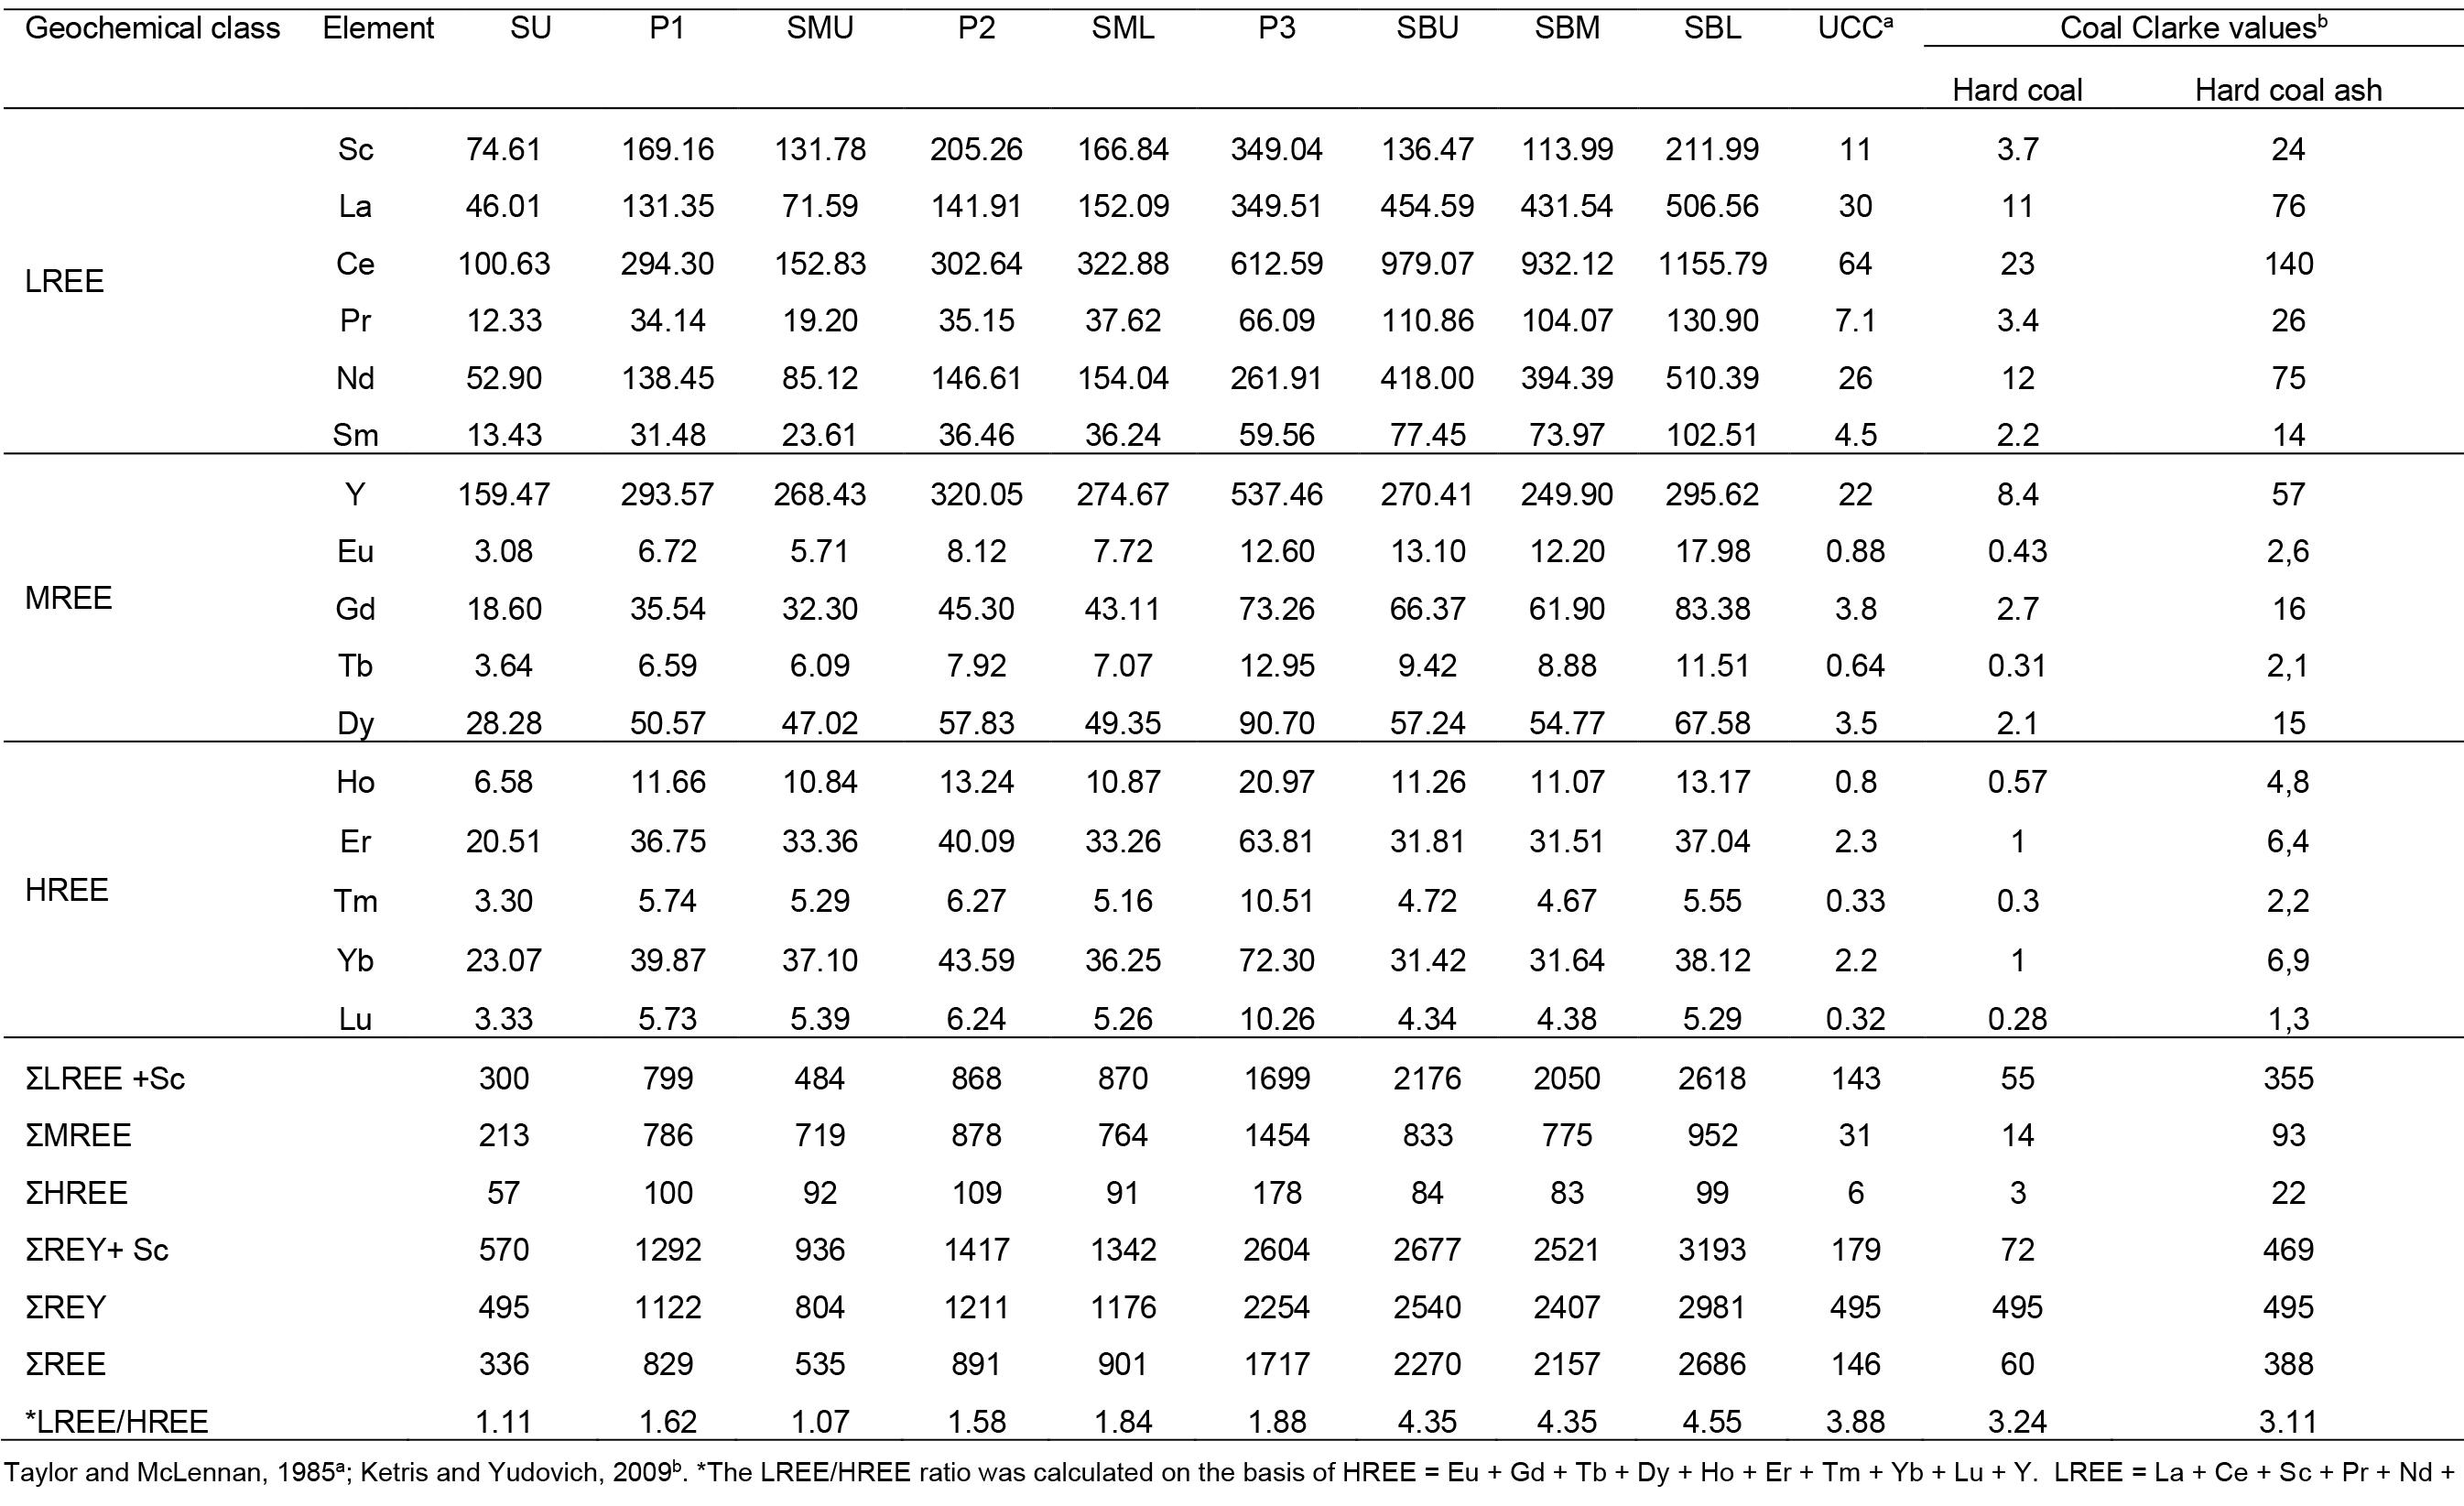
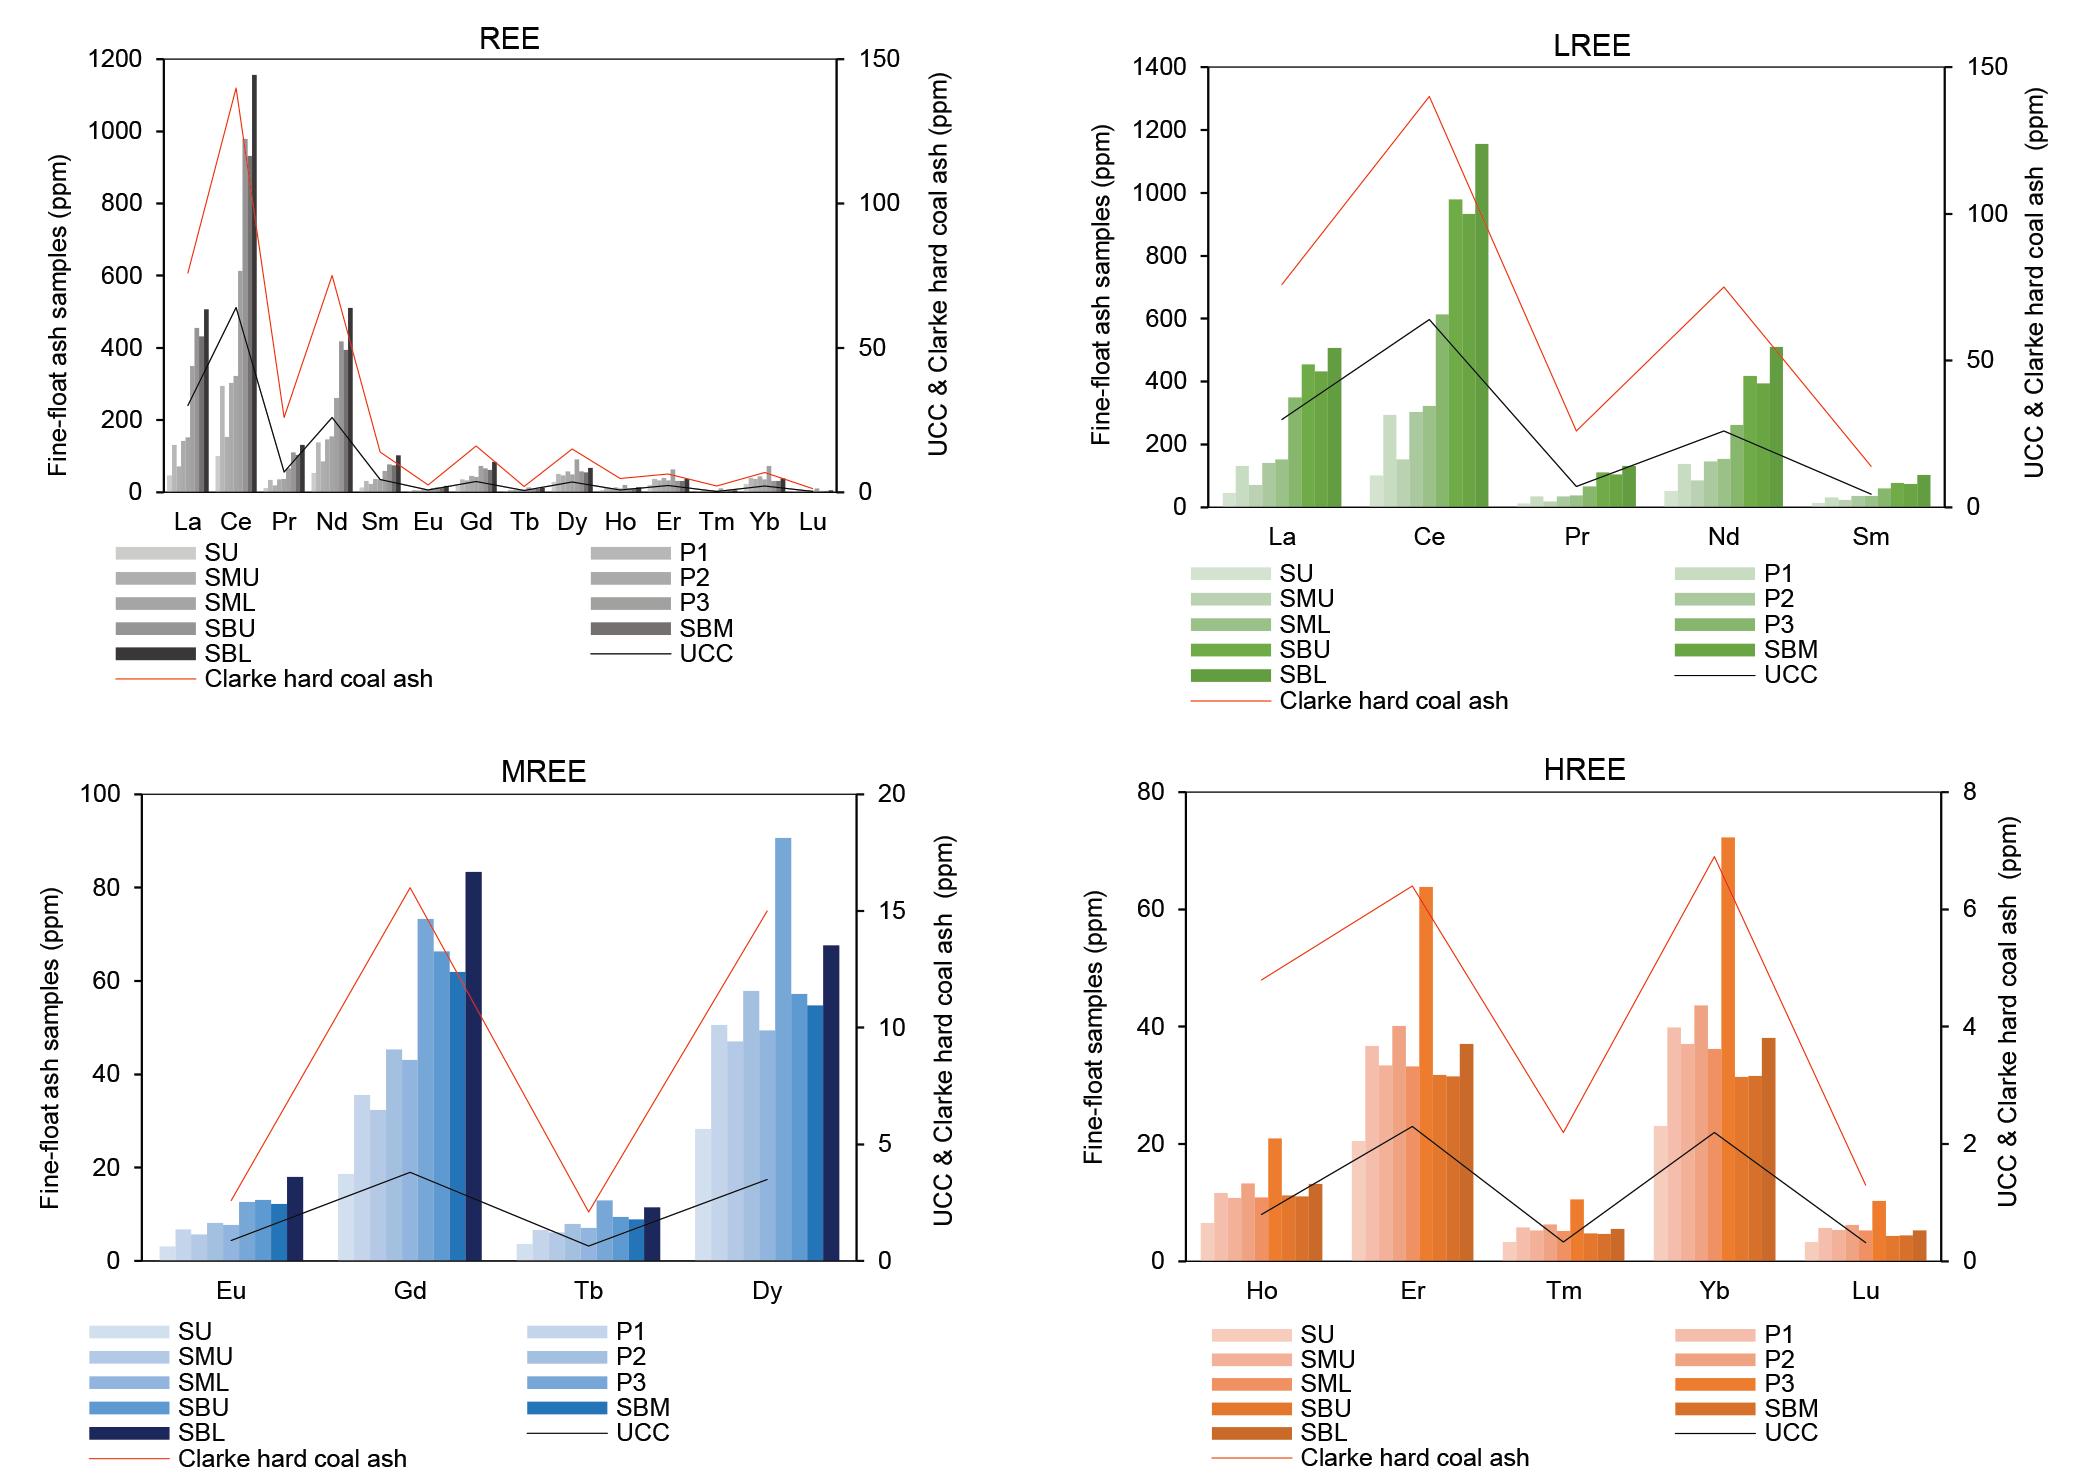
Figure 5—Rare earth concentrations in the -1+0.25 mm samples relative to the UCC (Taylor and McLennan, 1985) and the Clarke values on coal ash basis (Ketris and Yudovich, 2009)
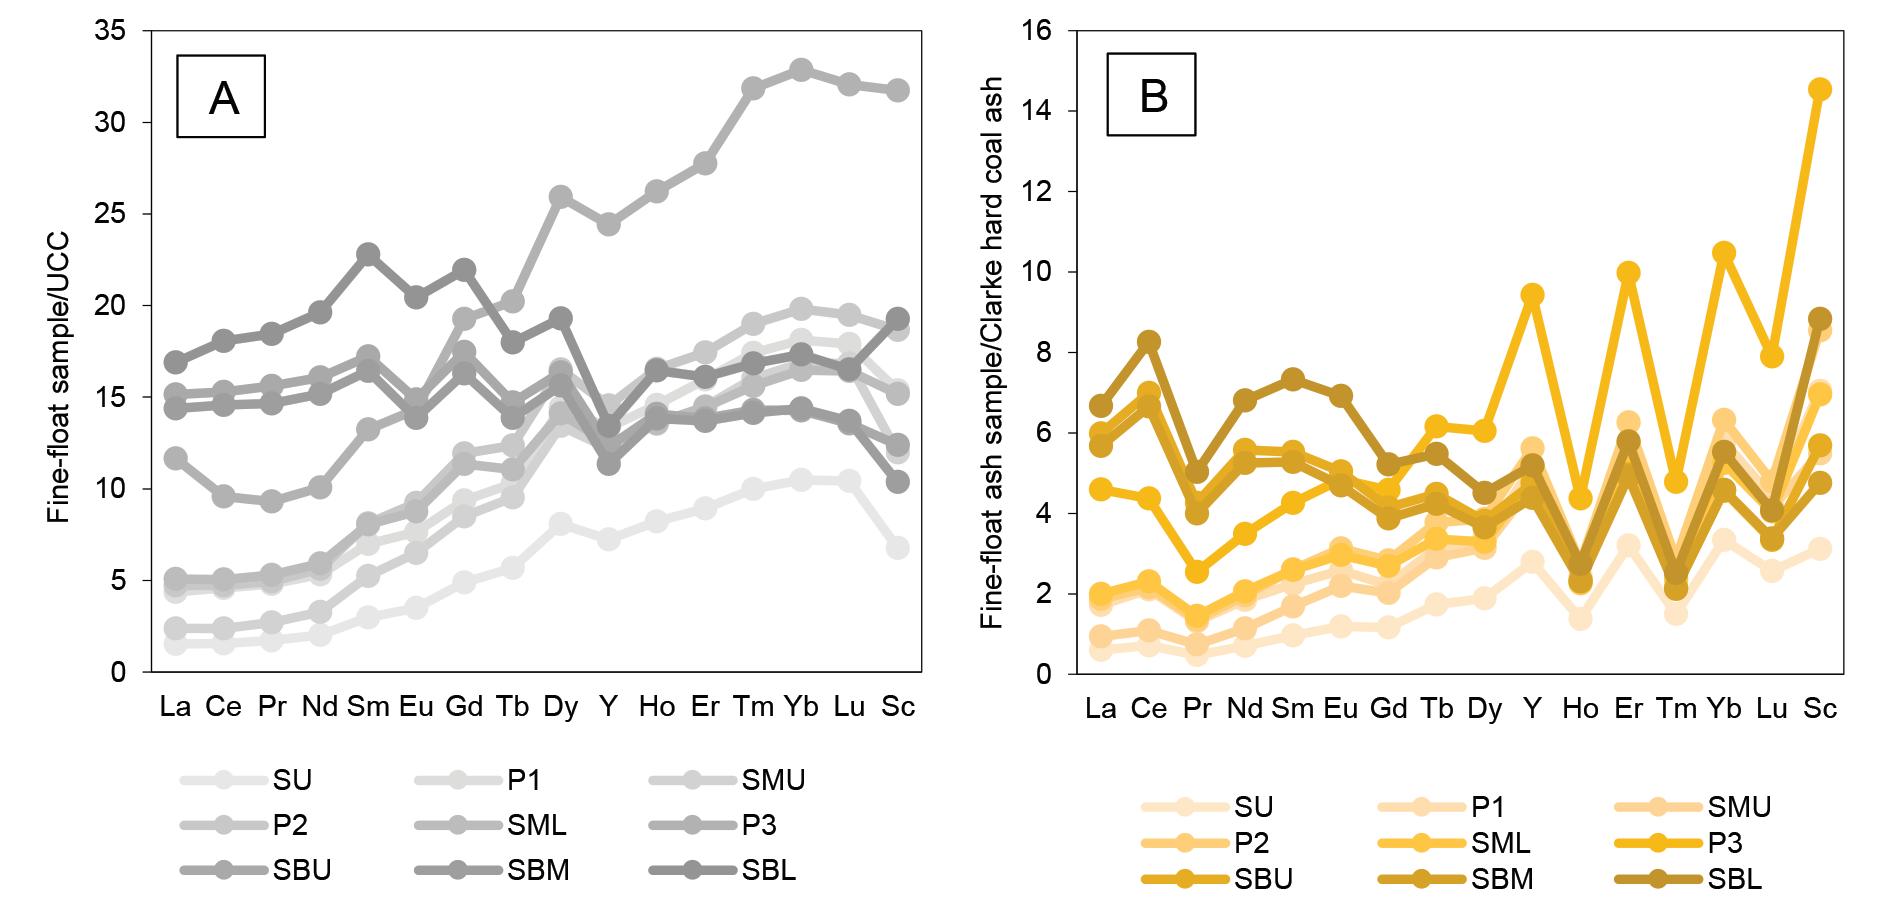
Figure 6—REY+Sc concentration in the -1+0.25 mm samples normalized to (A) the Earth´s UCC values (Taylor and McLennan, 1985), (B) Clarke values on ash-basis (Ketris and Yudovich, 2009)
Table VII
Outlook coefficient (Coutl) for the -1+0.25mm ashed samples
Sample REY Coutl Revised Coutl classification SU 495 2.0 Promising REY source P1 1122 1.5 Promising REY source SMU 804 2.1 Promising REY source P2 1211 1.6 Promising REY source SML 1176 1.4 Promising REY source P3 2254 1.3 Promising REY source SBU 2540 0.8 Promising REY source SBM 2407 0.8 Promising REY source SBL 2981 0.8 Promising REY source
Preliminary assessment of the REY+Sc showed all but two of the ashed coal samples are promising for economic development as their REY exceed the 1000 ppm cut-off grade, albeit at laboratory level.
The findings of this study highlight the properties of metallurgical coals from the Soutpansberg coalfield, as well as their potential as unconventional REE source pending further investigation into their viability.
Acknowledgements
The Council for Geoscience, South Africa is acknowledged for funding this research project. The management of the MC Mining (Makhado Project) is thanked for providing the sample material and access to test work data. The DSI-NRF CIMERA grant awarded to N.J. Wagner provided support for the petrographic analyses.
CrediT author statement
MJT: Conceptualization, methodology, project administration, formal analysis, Investigation, data curation, validation, writing original draft, writing-reviewing and editing, visualization, funding acquisition; N.J.: PhD supervision, funding, resources, validation, writing-reviewing and editing, conceptualization, methodology G.R: PhD supervision, funding, resources, validation, writingreviewing and editing, conceptualization, methodology.
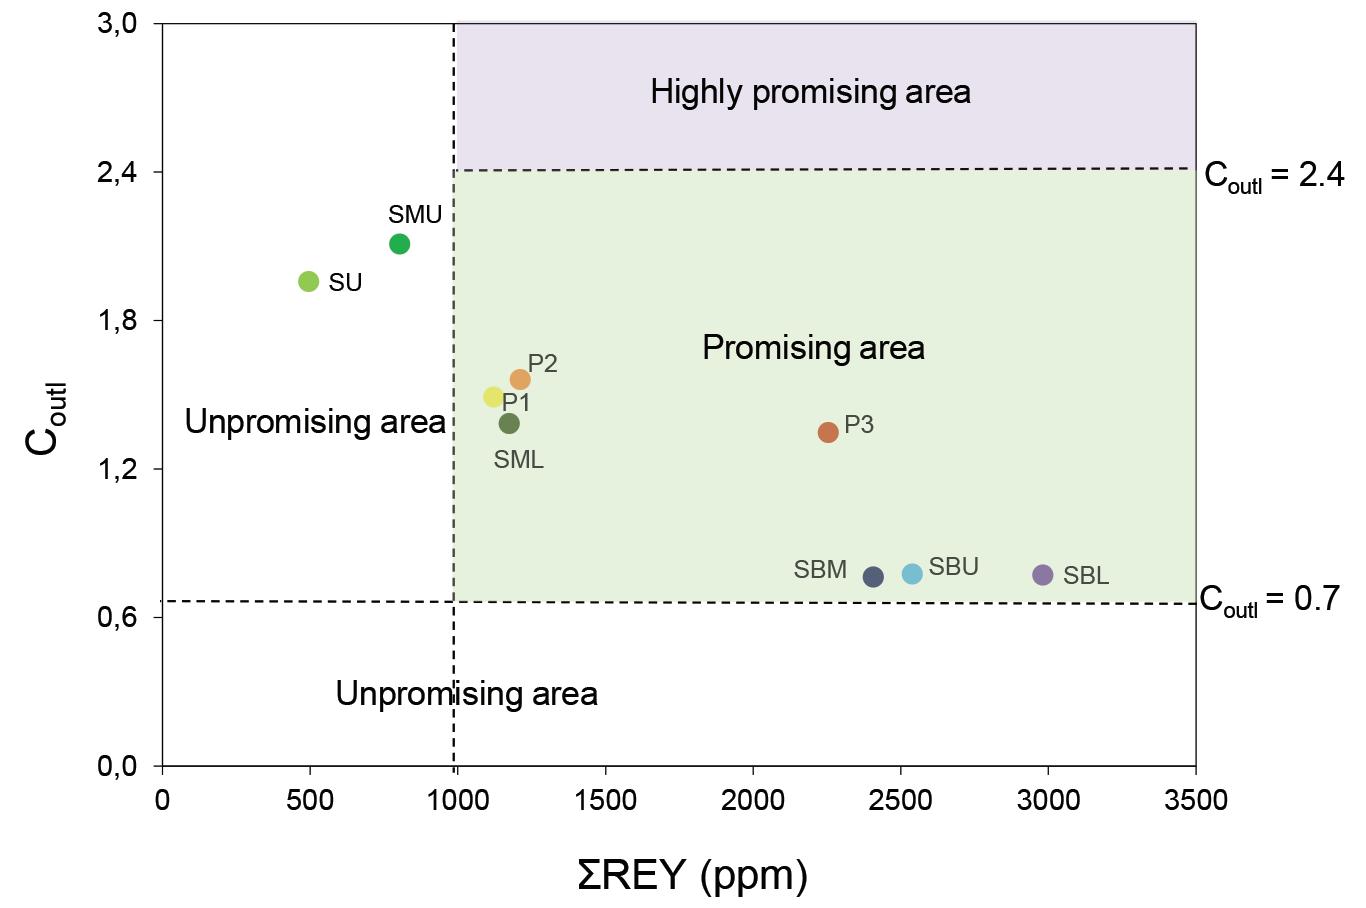
Figure 7—Revised Coutl graph following Dai et al. (2017). All samples apart from SU and SMU fall in the `promising` area. Total REY concentrations in samples SU and SMU are < 1000 ppm
References
Akdogan, G., Bradshaw, S., Dorfling, C., Bergmann, C., Ghosh, T., and
Campbell, Q. 2019. Characterization of rare earth elements by XRT sorting products of a South African coal seam. International Journal of Coal Preparation and Utilization. pp. 1–17. https://doi.org/10.1080/19392699.2019.1685506
Akinyemi, S.A., Gitari, W.M., Akinlua, A., and Petrik, L.F. 2012. Mineralogy and geochemistry of sub-bituminous coal and its combustion products from
Mpumalanga Province, South Africa. Analytical Chemistry. Krull I.S. (ed.)
Chapter 2. InTechOpen. https://doi:10.5772/50692
Bhattacharya, S., Maheshwari, A., and Panda, M. 2016. Coal cleaning operations:
The question of near gravity material. Transactions of the Indian Institute of
Metals, vol. 69, no. 1. pp.157–172. http://doi:10.1007/s12666-015-0737-z
Cadle, A.B., Cairncross, B., Christie, A.D.M., and Roberts, D.L. 1993. The Karoo
Basin of South Africa: type basin for coal-bearing deposits of southern Africa.
International Journal of Coal Geology, vol. 23, no. 1-4. pp. 117–157. https://doi. org/10.1016/0166-5162(93)90046-D
Cairncross, B. 2001. An overview of the Permian (Karoo) coal deposits of southern Africa. Journal of African Earth Sciences, vol 33, no. 3-4. pp. 529–562. https://doi.org/10.1016/S0899-5362(01)00088-4
Catuneanu, O., Wopfner, H., Eriksson, P.G., Cairncross, B., Rubidge, B.S.,
Smith, R.M.H., and Hancox, P.J. 2005. The Karoo basins of south-central
Africa. Journal of African Earth Sciences, vol. 43, no. 1-3. pp. 211-253. https://doi. org/10.1016/j.jafrearsci.2005.07.007
Chamber of Mines. 2018. National coal strategy for South Africa. 30 pp. https:// www.mineralscouncil.org.za/special-features/604-national-coal-strategy-forsouth-africa
Cornelius, M.L.U., Ameh, A.E., Eze, C.P., Fatoba, O., Sartbaeva, A., and
Petrik, L.F. 2021. The behaviour of rare earth elements from South African coal fly ash during enrichment processes: Wet, magnetic separation and zeolitisation. Minerals, vol. 11. no. 9. pp. 950. https://doi.org/10.3390/ min11090950
Dai, S. and Finkelman, R.B. 2018. Coal as a promising source of critical elements:
Progress and future prospects. International Journal of Coal Geology, vol. 186. no.1. pp. 155–164. https://doi.org/10.1016/j.coal.2017.06.005
Dai, S., Graham, I.T., and Ward, C.R. 2016. A review of anomalous rare earth elements and yttrium in coal. International Journal of Coal Geology, vol. 159, no.1. pp. 82–95. https://doi.org/10.1016/j.coal.2016.04.005
Dai, S., Xie, P., Jia, S., Ward, C.R., Hower, J.C, Yan, X., and French, D. 2017.
Enrichment of U-Re-V-Cr-Se and rare earth elements in the Late Permian coals of the Moxinpo Coalfield, Chongqing, China: Genetic implications from geochemical and mineralogical data. Ore Geology Reviews, vol. 80, no. 1. pp. 1–17. https://doi.org/10.1016/j.oregeorev.2016.06.015
De Klerk, E. and Sparrow, J. 2015. Independent Competent Persons Report on
Coal of Africa Limited’s Greater Soutpansberg Projects Prepared for Coal of
Africa Limited and Peel Hunt LL. Unpublished Report by Venmyn Deloitte for
Coal of Africa Limited. 290 pp.
Duan, P., Wang, W., Liu, X., Sang, S., Ma, M., and Zhang, W. 2019. Differentiation of rare earth elements and yttrium in different size and density fractions of the Reshuihe coal, Yunnan Province, China. International Journal of Coal
Geology, vol. 207, no.1. pp. 1–11. https://doi.org/10.1016/j.coal.2019.03.014
Duda, A., and Fidalgo Valverde, G. 2021. The Economics of Coking Coal Mining:
A Fossil Fuel Still Needed for Steel Production. Energies, vol. 14, no. 22. pp. 7682. https://doi.org/10.3390/en14227682
ECE-UN (Economic Commission for Europe – United Nations). 1998.
International classification of in-seam coals. (Energy/1998/19). https://unece. org/fileadmin/DAM/energy/se/pdfs/coal/1998_International_Classification_of_
In-Seam_Coals_-January_1998.pdf
Eterigho-Ikelegbe, O., Harrar, H., and Bada, S. 2021. Rare earth elements from coal and coal discard–A review. Minerals Engineering, vol. 173, no. 1. pp. 107187. https://doi.org/10.1016/j.mineng.2021.107187
European Commission. 2020. Study on the EU's list of Critical Raw Materials -
Final Report 2020. http://www.europa.eu
Eze, C.P., Fatoba, O., Madzivire, G., Ostrovnaya, T.M., Petrik L.F., Frontasyeva,
M.V., and Nechaev, A.N. 2013. Elemental composition of fly ash: a comparative study using nuclear and related analytical techniques. Journal of Chemistry-
Didactics-Ecology-Metrology, vol. 18, no. 1-2. pp.19–29. https://doi:10.2478/cdem2013-0014
Finkelman, R.B. 1999. Trace elements in coal. Biological Trace Element Research, vol. 67, no. 3. pp. 197–204. https://doi.org/10.1007/BF02784420
Finkelman, R.B., Palmer, C.A., and Wang, P.P. 2018. Quantification of the modes of occurrence of 42 elements in coal. International Journal of Coal Geology. vol. 185, pp. 138–160. https://doi.org/10.1016/j.coal.2017.09.005
Franus W., Wiatros-Motyka M.M., and Wdowin, M. 2015. Coal fly ash as a resource for rare earth elements. Environmental Science and Pollution Research. vol. 22, no. 12. pp. 9464–9474. https://doi.org/10.1007/s11356-015-4111-9 Fu, B., Hower, J.C., Zhang, W., Luo, G., Hu, H., and Yao, H. 2022. A review of rare earth elements and yttrium in coal ash: Content, modes of occurrences, combustion behaviour, and extraction methods. Progress in Energy and
Combustion Science, vol. 88, no. 1. pp. 100954. https://doi.org/10.1016/j. pecs.2021.100954
Hancox, P. J. and Götz, A.E. 2014. South Africa’s coalfields-A 2014 perspective.
International Journal of Coal Geology, vol. 132, no.1. pp.170–254. https://doi. org/10.1016/j.coal.2014.06.019
Hart, R.J., Leahy, R., and Falcon, R.M. 1982. Geochemical investigation of the
Witbank Coalfield using Instrumental Neutron Activation Analysis. Journal of
Radioanalytical Chemistry, vol. 71, no.1-2. pp. 285–297. https://doi.org/10.1007/ bf02516156
IEA. 2017. Coal 2017-Analysis and forecast to 2022, IEA, Paris. https://www.iea.org/ reports/coal-2017. 13 August 2022.
Huang, Z., Fan, M., and Tiand, H. 2018. Coal and coal byproducts: A large and developable unconventional resource for critical materials-Rare earth elements. Journal of Rare Earths, vol. 36, no.4. pp. 337–338. https://doi. org/10.1016/j.jre.2018.01.002
Huggins, F.E., Seidu, L.B.A., Shah, N., Huffman, G.P., Honaker, R.Q., Kyger, J.R., and Seehra, M.S. 2009. Elemental modes of occurrence in an Illinois# 6 coal and fractions prepared by physical separation techniques at a coal preparation plant. International Journal of Coal Geology, vol. 78, no.1. pp. 65–76. https://doi. org/10.1016/j.coal.2008.10.002
Jeffrey, L.S. 2005. Characterization of the coal resources of South Africa. Journal of the Southern African Institute of Mining and Metallurgy, vol.105, no. 2. pp. 95–102. https://hdl.handle.net/10520/AJA0038223X_3050
Johnson, M.R., van Vuuren, C.J., Visser, J.N.J., Cole, D.I., Wickens, H., de, V.,
Christie, A.D.M., Roberts, D.L., and Brandl, G. 2006. Sedimentary rocks of the Karoo Supergroup. The Geology of South Africa. Johnson, M.R.,
Anhaeusser, C.R., and Thomas, R.J. (eds.). Geological Society of South Africa,
Johannesburg/Council for Geoscience, Pretoria. pp. 461–499.
Jordan, P. 2008. Characterising coals for coke production and assessing coke: predicting coke quality based on coal petrography, rheology and coke petrography. MSc dissertation. University of the Witwatersrand, South Africa. https://core.ac.uk/download/pdf/39664974.pdf
Ketris, M. and Yudovich, Y. 2009. Estimations of Clarkes for carbonaceous biolithes: world averages for trace element contents in black shales and coals.
International Journal of Coal Geology, vol. 78, no. 2. pp.135–148. https://doi. org/10.1016/j.coal.2009.01.002
Kolker, A., Scott, C., Lefticariu, L., Mastalerz, M., Drobniak, A., and Scott, A. 2021. Trace element partitioning during coal preparation: Insights from US
Illinois Basin coals. International Journal of Coal Geology, vol. 243, no. 1. pp. 103781. https://doi.org/10.1016/j.coal.2021.103781
Kruger, H. 2013. Coking coal. ArcelorMittal presentation for Fossil Fuel
Foundation Coal Coke and Carbon in the Metallurgical Industry. 32 pp. https:// studylib.net/doc/8896225/coking-coal---the-fossil-fuel-foundation-of-africa
Kruszewska, K.J. 1998. The reactivity of pseudovitrinite in some coals. Fuel, vol. 77, no. 14. pp. 1655–1661. https://doi.org/10.1016/S0016-2361(98)00088-X
Kumar, D. and Kumar, D. 2018. Sustainable management of coal preparation. Woodhead, New York, USA. https://doi.org/10.1016/C2016-0-01854-5
Lin, R., Howard, B.H., Roth, E.A., Bank, T.L., Granite, E.J., and Soong, Y. 2017. Enrichment of rare earth elements from coal and coal by-products by physical separations. Fuel, vol. 200. pp. 506–520. https://doi.org/10.1016/j. fuel.2017.03.096
Luyt, J.P. 2017. The tectono-sedimentary history of the coal-bearing Tshipise Karoo basin. MSc dissertation, University of Pretoria, South Africa. http://hdl.handle. net/2263/63290
Malaza, N. 2013. Basin analysis of the Soutpansberg and Tuli Coalfields, Limpopo
Province of South Africa. PhD thesis, University of Fort Hare. 270 pp. http:// hdl.handle.net/20.500.11837/311
Minerals Council South Africa. 2022. Coal - Key facts and figures. https://www. mineralscouncil.org.za/sa-mining/coal [accessed 20 March 2022].
Peatfield, D. 2003. Coal and coal preparation in South Africa - A 2002 review.
Journal of the Southern African Institute of Mining and Metallurgy, vol. 103. pp. 355–372. https://hdl.handle.net/10520/AJA0038223X_2807
Peiravi, M., Ackah, L., Guru, R., Mohanty, M., Liu, J., Xu, B., Zhu, X., and Chen,
L. 2017. Chemical extraction of rare earth elements from coal ash. Minerals &
Metallurgical Processing, vol. 34. pp. 170–177. https://doi.org/10.19150/mmp.7856
Powell, D.M. 2016. A techno-economic evaluation of the production of hard coking coal from Tshikondeni coal discards. MSc dissertation, North-West
University, South Africa. http://hdl.handle.net/10394/20453
Predeanu, G., Slăvescu, V., Bălănescu, M., Mihalache, R.D., Mihaly, M., Marin,
A.C., Meghea, A., Valentim, B., Guedes, A., Abagiu, T.A., Popescu,A.M.,
Manea-Saghin, A.M., Vasile, B.S., and Drăgoescu, M.F. 2021. Coal bottom ash processing for capitalization according to circular economy concept. Minerals
Engineering, vol. 170. pp.107055. https://doi.org/10.1016/j.mineng.2021.107055
Prévost, X. 2013. Review of the South African coal mining industry. 12 pp. https:// cer.org.za/wp-content/uploads/2017/12/Annexure-P.pdf
Prévost, X. 2017. Coal’s powerful role. Inside Mining, vol. 10. pp. 12–13. https://hdl. handle.net/10520/EJC-6e951428f
Sahajwalla, V. 2012. The effect of coal properties on carbonization behaviour and strength of coke blends. Masters dissertation, University of New South Wales.
Schernikau, L. 2017. Economics of the international coal trade: Why coal continues to power the World. 2nd edn. Springer, Berlin. https://doi. org/10.1007/978-3-319-46557-9
Scott, C. and Kolker, A. 2019. Rare earth elements in coal and coal fly ash. US
Geological Survey Fact Sheet 2019-3048. 4 p. https://doi.org/10.3133/fs20193048
Sebola, M.J.T. 2022. The influence of beneficiation on the petrographic, geochemical & physical properties of metallurgical coal from the
Soutpansberg Coalfield, South Africa. PhD thesis, University of the
Witwatersrand, Johannesburg.
Seredin V.V and Dai, S. 2012. Coal deposits as potential alternative sources for lanthanides and yttrium. International Journal of Coal Geology, vol. 94, no. 1. pp. 67–93. https://doi.org/10.1016/j.coal.2011.11.001
Seredin, V.V. 2010. A new method for primary evaluation of the outlook for rare earth element ores. Geology of Ore Deposits, vol. 52. pp. 428–433. https://doi. org/10.1134/S1075701510050077
Sparrow, J. 2012. The Soutpansberg Coalfield `he Forgotten Basin`. Presentation at the Inaugural FFF Limpopo Conference, October 2012. 45 pp. https:// fffcarbon.co.za/conferences/2012/John_Sparrow.pdf
Suárez-Ruiz, I., and Crelling, J.C. 2008. Applied coal petrology: the role of petrology in coal utilization. Academic Press. 301pp. https://doi.org/10.1016/
B978-0-08-045051-3.X0001-2
Subba-Rao, D.V. and Gouricharan, T. 2016. Constituents of coal. Coal Processing and Utilization, CRS Press. 536 pp. https://doi.org/10.1201/b21459
Swaine, D.J. 2000. Why trace elements are important. Fuel Processing Technology, vol. 65. pp. 21-33. https://doi.org/10.1016/S0378-3820(99)00073-9
Taylor, S.R. and McLennan, S.M. 1985. The continental crust: Its composition and evolution. Blackwell, Oxford. https://www.osti.gov/biblio/6582885
Vejahati, F., Xu, Z., and Gupta, R. 2010. Trace elements in coal: Associations with coal and minerals and their behavior during coal utilization–A review. Fuel, vol. 89. pp. 904–911. https://www.doi:10.1016/j.fuel.2009.06.013
Van Gosen, B.S., Verplanck, P.L., Long, K.R., Gambogi, J., and Seal II, R.R. 2014.
The rare-earth elements-Vital to modern technologies and lifestyles. USGS
Mineral Resources Program, Fact Sheet 2014-3078. https://doi.org/10.3133/ fs20143078
Wagner, N.J. and Matiane, A. 2018. Rare earth elements in select Main Karoo
Basin (South Africa) coal and coal ash samples. International Journal of Coal
Geology, vol. 196. pp. 82–92. https://doi.org/10.1016/j.coal.2018.06.020
Wang, W., Qin, Y., Sang, S., Jiang, B., Guo, Y., Zhu, Y., and Fu, X. 2006. Partitioning of minerals and elements during preparation of Taixi coal, China. Fuel, vol. 85. pp. 57–67. https://doi.org/10.1016/j.fuel.2005.05.017
Ward, C.R. 2016. Analysis, origin and significance of mineral matter in coal:
An updated review. International Journal of Coal Geology, vol. 165. pp. 1-27. https://doi.org/10.1016/j.coal.2016.07.014
Wen-feng, W., Yong, Q., Jun-yi, W., and Jian, L. 2009. Partitioning of hazardous trace elements during coal preparation. Procedia Earth and Planetary Science, vol. 1. pp. 838–844. https://doi:10.1016/j.pro .2009.09.131
Xaba, D.S. 2004. Evaluate the remaining resources of low phosphorus coal in
Mpumalanga Province. Coaltech 2020 Task 1.2.1 report. CSIR Miningtek,
Johannesburg. https://coaltech.co.za/mining/evaluate-the-remainingresources-of-low-phosphorus-coal-in-mpumalanga-province
York, R. and Bell, S.E. 2019. Energy transitions or additions?: Why a transition from fossil fuels requires more than the growth of renewable energy. Energy
Research & Social Science, vol. 51, no. 1. pp. 40–43. https://doi.org/10.1016/j. erss.2019.01.008
Zhang, W., Honaker, R., and Groppo, J. 2017. Concentration of rare earth minerals from coal by froth flotation. Mining, Metallurgy & Exploration, vol. 34, no. 3. pp. 132–137. https://doi.org/10.19150/mmp.7613
Zhang, W., Noble, A., Yang, X., and Honaker, R. 2020. A comprehensive review of rare earth elements recovery from coal-related materials. Minerals, vol. 10, no 5. pp. 451. https://doi.org/10.3390/min10050451. u


