3 minute read
Where is all the gold?

from Saimm 202304 apr
by SAIMM

Appendix Statistics for very small samples (after Duncan, 1979)
If one has two quantities (two independent measurements in an experiment, for example) which are disparate and differ by an independently random amount, then the best estimate of the measured quantity is the arithmetic mean of the two quantities. The best estimate of the dispersion, hence an indication of the error of the measurements, is the standard deviation. For a sample containing only two measurements the arithmetic mean remains an unbiased estimator, while the standard deviation, even if Bessel’s n/ (n–1) correction has been applied, is still biased. In normal practice, samples contain many more than two data points, so this bias disappears.
Advertisement
The arithmetic mean for a sample containing two data points is given by:
The standard deviation with Bessel’s correction for an n = 2 sample is given by:
This can be treated as a standard error for the population of normally distributed cumulative mine production statistics, and is used as a means to provide an unbiased estimate of the expected error in the published statistics.
Guidelines for computing uncertainties in error analysis (after Taylor, 1997)
When several quantities x, y, z, ... w are measured with small uncertainties δx, δy, δz, .....δw, and the measured values are used to calculate another quantity q, then the uncertainty in q will depend on the uncertainties in x, y, z, .....w as described below, if and only if the uncertainties δx, δy, δz, .....δw are both random, and independent of each other.
If q is a sum of two or more variables, i.e. q = x + y + z + ... + w, then uncertainties add in quadrature.
or
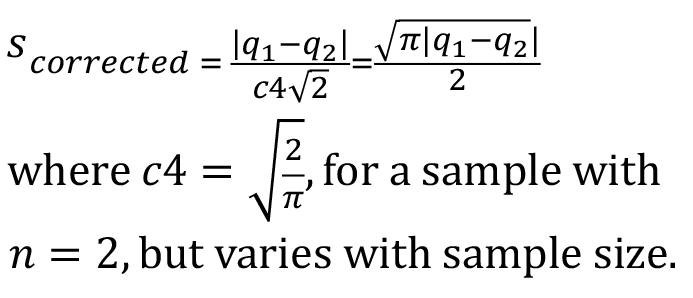
The standard deviation for a two–data sample is underestimated by about 20%, so it must be corrected by a variable known in industrial quality control as c4, and is given by:
If q is the difference of two or more variables, i.e. q = x – y – z –... – w, then the uncertainties add in quadrature.
The means to calculate c4 can be found in Duncan (1979) or on the internet. Applying c4 to the standard deviation makes it an unbiased estimator of the population variance, provided that the sample is random and the population is normally distributed. It is reasonable to assume that the cumulative mine production statistics contain many random errors in the form of omissions, incorrectly recorded statistics, double-counting, and so on. Furthermore, the compiled statistics are sums of multiple mines’ production over their lifetimes, or the sum of all producing mines’ production per annum over a number of years. Both of these statistics, if computed again and again, will behave in exactly the same way as the sampling distribution of means and will, by the central limit theorem, be normally distributed. When comparing two cumulative mine production figures computed different ways, r is used to estimate an expected normalized residual expressed as a percentage: so that the expected normalized residual expressed as a percentage is
The above formula was simplified for the calculations of residuals in Table II by the following approximation: then the fractional uncertainties add in quadrature or [3]
If q is a product or quotient of several variables, i.e.
The uncertainties are expressed as positive quantities, and the sum in quadrature is always less than or equal to the sum of the uncertainties expressed as positive fractions. The above equations are used to determine all the uncertainties in Table VIII.
Table VIII is repeated in Table A1 in figures similar to the way the mines reported them. The author notes here that all of the figures except those in rows 1–3 are estimates from sparse data, and are not scientifically acceptable as estimates in the form reported. They are repeated here in their raw form so that the reader can follow the author’s calculations as they were done in a spreadsheet. The rounded estimates made to three significant figures with their uncertainties reported in Table VIII above are more acceptable.
Where is all the gold?
Table AI
Estimate of total gold resource and gold remaining in the Witwatersrand Basin as measured and calculated before rounding in Table VIII
* All reef tonnages reported to the nearest 1000 t, as the mines have always done; gold production is reported to the nearest ton because of the large quantities involved (the mines reported to the nearest 100 g), and grades to the nearest 0.01 g/t.


