
21 minute read
Tina Koziol
AUTHOR:
Tina Koziol1
Advertisement
AFFILIATION:
1School of Economics, University of Cape Town, Cape Town, South Africa
CORRESPONDENCE TO:
Tina Koziol
EMAIL:
tina.koziol@alumni.uct.ac.za
DATES:
Received: 02 May 2021 Revised: 22 May 2022 Accepted: 28 July 2022 Published: 29 Sep. 2022
HOW TO CITE:
Koziol T. How vulnerable are interconnected portfolios of South African banks? S Afr J Sci. 2022;118(9/10), Art. #10995. https://doi.org/10.17159/ sajs.2022/10995
ARTICLE INCLUDES:
☒ Peer review ☒ Supplementary material
DATA AVAILABILITY:
☐ Open data set ☐ All data included ☒ On request from author(s) ☐ Not available ☐ Not applicable
EDITOR:
Michael Inggs
KEYWORDS:
stress testing, portfolio similarity, fire-sale contagion
FUNDING:
South African Reserve Bank
© 2022. The Author(s). Published under a Creative Commons Attribution Licence.
Price shocks that propagate through the financial system present a significant risk to financial system stability. This study was an evaluation of the vulnerability of South African banks’ portfolios to pricemediated contagion in the last decade. Using longitudinal data of balance sheet positions of the 10 largest banks from 2010 to 2020, the stress tests were triggered by price shocks on one marketable asset held by all banks: South African government bonds. Overall, the study found that second-order feedback effects from bank deleveraging are muted and that the concentrated structure of the South African banking system has a positive effect on shock absorption. However, a gradual trend towards more similar asset portfolios in the past 10 years has gradually increased exposure to the price-mediated contagion channel.
Significance:
• The paper presents a novel modelling framework to study feedback price-effects in stress tests conducted on the South African banking system. • A new data set shows the evolution of South African banks’ portfolio structure and vulnerability by computing two fragility metrics and a portfolio similarity measure. • Using this data set, the relationship between banking sector vulnerability and portfolio similarity is tested empirically and it is shown how common asset holdings aggravate systemic risk to pricemediated contagion.
Introduction
This paper presents an investigation of the vulnerability of interconnected South African banks’ portfolios to the price-mediated contagion channel. Feedback effects that amplify losses in financial networks are the focus to understand systemic risk.1 Price-mediated contagion is a channel of systemic risk through which losses compound across assets and financial institutions by means of price externalities. To address the overall objective of investigating vulnerability in the banking sector, the paper answers the following questions: (1) Which bank contributes more to the price spillover amplification process? (2) Has the exposure to this type of systemic risk changed over time? And (3) what is the role of portfolio similarity? These questions were addressed by calibrating stress-test simulations to empirical data of South African banks’ balance sheets. The simulation model extends a fire-sale externality model first presented by Greenwood et al.2 by incorporating liquidity buffer. The stress-test simulations were applied to a sample of 10 South African banks over the period from 2010 to 2020. The selection of banks in the sample covers the largest, most connected banks and more than 96.7% of all assets in the South African banking system. The simulation exposes vulnerabilities that lie within the similarity of banks’ portfolios: price-mediated contagion becomes particularly potent when banks hold similar portfolios because price shocks amplify relative to common balance sheet holdings. There were several main findings. During the stress-test simulations, the amplification of losses in second- and third-order deleveraging rounds is largely contained when the initial price shock hits the portfolios of SA government bonds. This is because the relationship between individual banks’ exposure to the shock, their interconnectedness to other banks, and their liquidity reserves is conducive to shock absorption, with the structure of the financial system characterised by a few large banks having a positive effect on financial system stability. Second, I rank individual banks according to their contribution to systemic risk arising from this contagion channel. When examining each bank’s contribution to spillover loses, their systemic relevance is fairly stable over time. The largest four banks in terms of asset size each contribute between 20% and 27% of exposure to price-mediated contagion, while also becoming more similar in terms of asset size, leverage and portfolio composition. However, this development has led to a gradual increase in exposure to this type of contagion channel for the overall banking sector. As banks become more similar in their balance sheet set-up, the price-mediated contagion channel becomes more potent. While still being at low levels, the aggregate sector vulnerability to this type of contagion doubled between 2010 and 2020. Last, but not least, leverage, while being an important factor for price feedback spillover losses in general, has decreased in the South African banking sector in the last 10 years, thereby mitigating the risk of indirect contagion of asset price shocks.
Even before the financial crisis, researchers knew that systemic risk could arise in many forms. Triggers of systemic events include, for example, bank runs or large-scale loan defaults on the part of over-indebted households. However, systemic risk also resides ‘within’ the financial system in the complex nature of the interconnected relationships between institutions which are not obvious to the observer. A large area of research seeks to measure this kind of systemic risk by tracing amplification mechanisms that propagate shocks in those networks. These amplification effects can be direct or indirect and arise in different channels of contagion. Direct amplification typically occurs between financial institutions which are connected through bilateral contractual obligations.1
Interbank loans are one example of such direct balance sheet linkages which play a role in loss propagation. If one financial institution defaults on its liabilities, it adversely impacts the balance sheet of another financial institution, which triggers further losses and so on. This is referred to as domino contagion or cascades of defaults and the seminal paper in this research branch shows how payment shortfalls spread in the banking sector following the bankruptcy of one or more individual institutions.3 However, financial systems are not only vulnerable to direct amplification effects that arise from insolvency contagion, but also to indirect amplification effects that can propagate through price shocks. Sudden price shocks are also known as fire-sale externalities in the contagion literature and they have received a lot of attention in the wake of the financial crisis as researchers have emphasised their role in shock amplification processes and liquidation spirals. Shleifer and Vishny4 reported that fire-sales occur in situations in which financial institutions experience sudden constraints, e.g. a large liquidity requirement, which lead to forced liquidation of assets. When a bank faces a liquidity crisis and is forced to sell off assets in a short amount of time to meet counterparties’ claims, it accepts prices that can be substantially below market value. The discount on the market value is higher, the more illiquid the asset.1,4 Fire-sales are particularly potent as a destabilising factor in the financial sector because of financial institutions’ vulnerability to sudden stops in their short-term financing. There are several approaches to model fire-sales. Stylised models of the financial system are shown, for example by Cifuentes et al.5 who use an exponential price impact in a system of banks where fire-sales occur following a shock to one tradeable asset. If liquidation gains of this asset are not sufficient, banks start selling the illiquid asset to restore their fixed risk-weighted capital ratio. If they still cannot bring their capital ratio back within required levels, banks will default and trigger direct contagion to its counterparties. Caccioli et al.6 use a similar approach where an insolvency of one institution triggers fire-sales and default contagion within a network of banks. In their stylised model, they find that banking systems are stable below a critical value of leverage and become more and more unstable as leverage increases above this value. In the empirical literature, Greenwood et al.2 were among the first authors to calibrate a price-mediated contagion model to data. Their framework uses a constant holding structure and fixed leverage ratio to study the effect of a debt haircut for European sovereign bonds on capital losses in the European banking system. A similar modelling approach was employed by Cont and Schaanning7 in their stress-test analysis of the European banking sector. They extended the original framework by introducing asymmetric liquidation behaviour and a concave price impact function which depends on assets’ market depth and selling volumes. They show that the quantification of systemic losses based on those kind of indirect fire-sale contagion effects yields substantially different results from traditional stress-test methods. This paper contributes to the literature in three ways. First, Greenwood et al.’s2 framework is extended by relaxing the assumption that banks keep constant portfolio shares during liquidation and by adding a liquidity buffer. In Greenwood et al.2, model banks immediately sell assets to keep portfolio shares constant while I add the assumption that banks first check their financing needs against their cash liquidity to make banks’ selling behaviour more realistic. Secondly, I calibrate this model to empirical data of South African banks’ balance sheets to show the evolution of banks’ exposure to price-mediated contagion in a banking system characterised by a few large but well-connected banks. And, thirdly, I show the relationship between banks’ vulnerability to price-mediated contagion and their portfolio similarity.
Modelling the effect of portfolio similarity on banking sector vulnerability
Measuring similarity
What are common asset holdings of South African banks and how do they affect financial stability? The similarity between two banks m and n at time t can be measured as the Euclidean distance between them in K-dimensional space7
where wm,k,t is the portfolio weight invested in asset class k by bank m. Figure 1 shows the pairwise Euclidean distance between the largest 10 banks as of February 2020 in terms of asset size and highlights that the five largest banks (A to E) are much closer in portfolio composition than the rest (F to J). Figure 1b also shows that South African banks have become more similar in terms of asset composition over the past 10 years, potentially aggravating the systemic risk arising from overlapping portfolios in the sector. To quantify price spillover effects from different shock scenarios, I employed a computational stress-test simulation model. Computational models are useful to conduct policy-relevant research because they can be studied by incorporating more realistic assumption and behaviour. Adding layers of complexity to mathematical models comes with the caveat that these models are very difficult to solve analytically, and hence, need to be studied by simulation. The framework of the model leans on Greenwood et al.2 but is extended by incorporating a cash liquidity buffer and allowing for changing portfolio weights. The purpose of the model is to describe sequential rounds of
a b
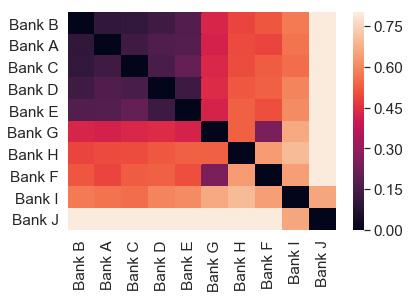
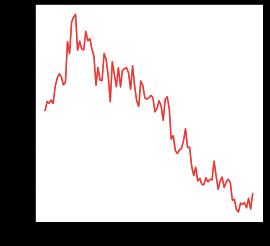
Source: South African Reserve Bank BA900 forms Figure 1: (a) Pair-wise Euclidean distance between top 10 banks as of February 2020. The closer (darker) the value to 0, the more similar the portfolios. (b) Average Euclidean distance from 2010 to 2020 for the largest 10 banks. The smaller the value, the more similar the largest banks in terms of asset size.
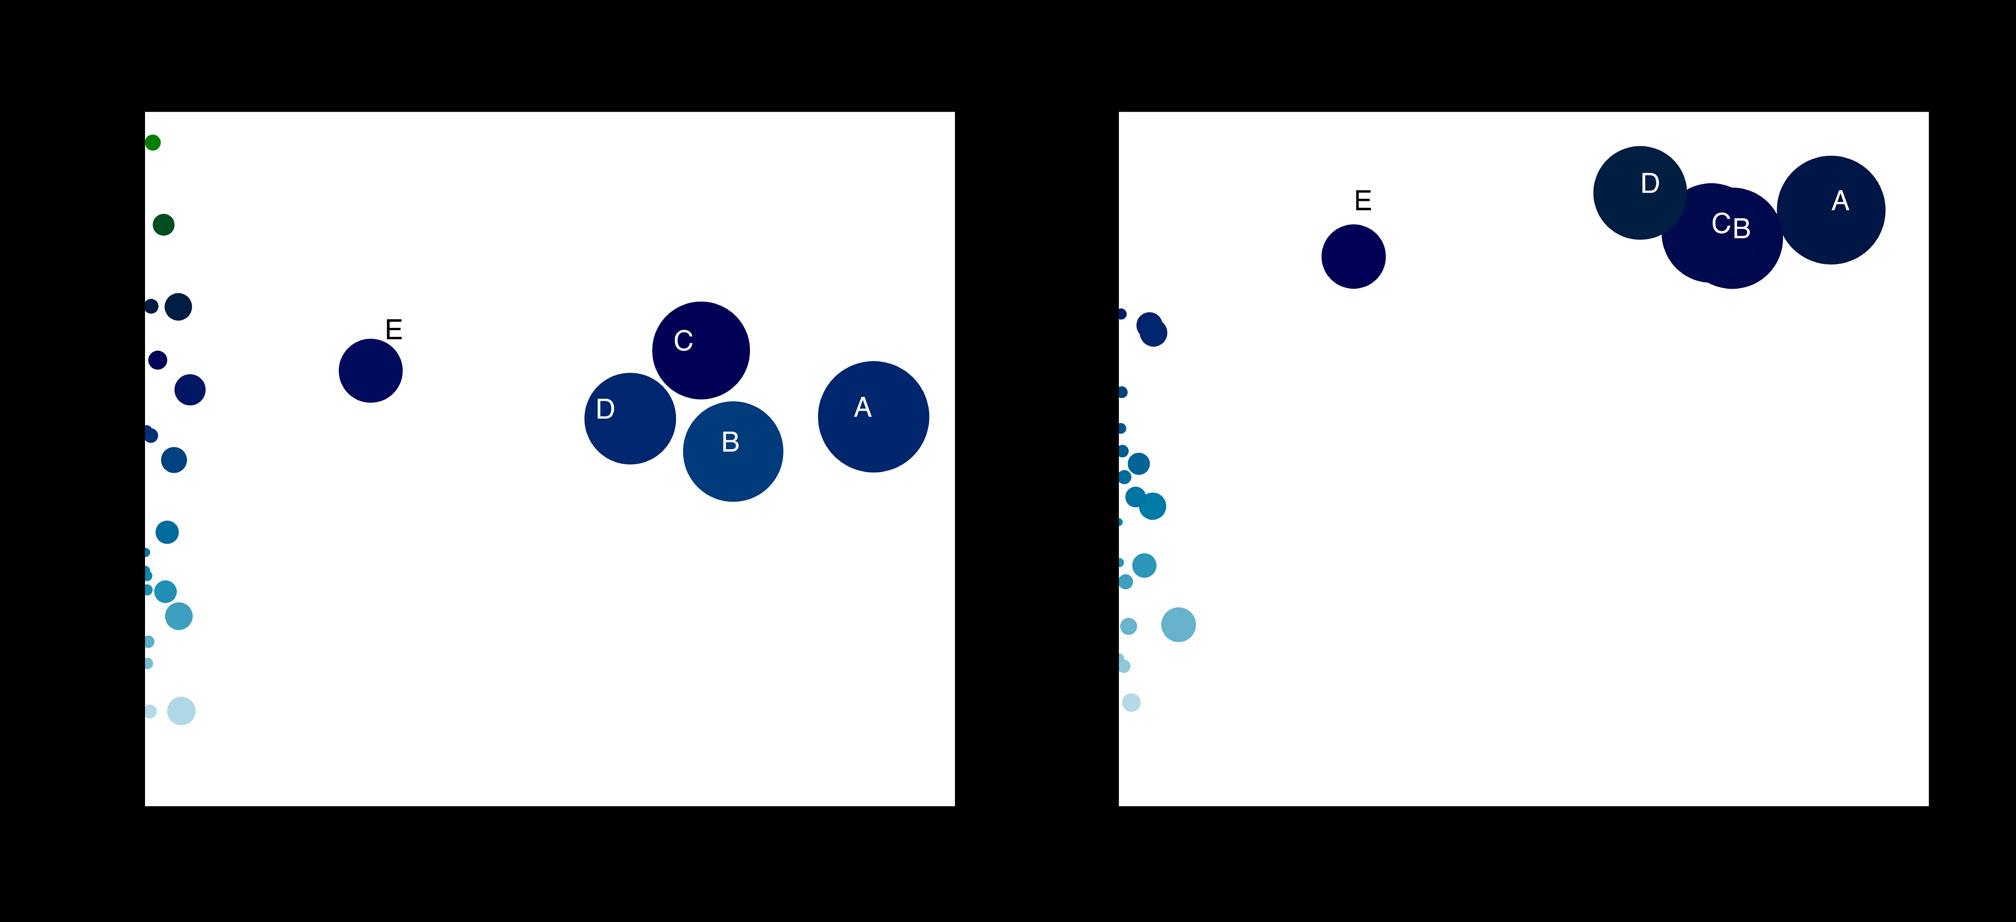
Source: South African Reserve Bank BA900 forms balance sheet data Figure 2: Leverage and total asset value of the largest 10 banks in December 2015 and February 2020. Bubble size represents market share in terms of assets. Banks are becoming more similar in terms of leverage and asset size.
price spillovers and bank deleveraging following an initial external shock. Banks’ balance sheets and portfolio weights mk for each asset class are defined as follows. Assume a set of n banks B = {1,...,n} and k asset classes K = {1,...,k}. Each individual bank bi has total assets ai with portfolio weight wi on asset k such that ∑ k n wk= 1. Leverage is defined by debt di over equity ei. The balance sheet is thus:
Asset Cash wkc Loan book wklb Trading book wktb
ai
ai
ai
Liabilities
Equity ei
Debt di
Algorithm and parameters
In addition to the definition of banks’ balance sheets, it is important to formulate assumptions that guide the simulation. A full description can be found in the supplementary material. In short, when banks are exposed to an initial shock, they move away from their target leverage position. They respond by scaling down their asset side by either depleting their liquidity reserves or liquidating assets. If this happens on a large scale, cumulative banks’ sales lead to a price effect which in turn induces a second-round (and third- and fourth-order etc.) price shock. It is those second-degree price spillovers that are at the heart of the fire-sale externality channel. The price effect depends on the illiquidity parameter ρk, which determines the magnitude of feedback effects and is chosen in the same neighbourhood as in Greenwood et al.2
Results
The aim of this study was to quantify systemic losses arising from the fire-sale contagion channel, as well as individual banks’ contribution to overall fragility of the financial system conditional on the shock. I used balance sheet data for the largest 10 banks from the BA900 forms of the South African Reserve Bank and simulate general shock scenarios. Banks’ portfolios consist of 27 asset classes which are aggregated from the BA900 forms. Bank names have been anonymised in this study for regulatory reasons. A key characteristic of the South African banking sector is its high concentration of assets among few retail banks, i.e. the four largest banks account for approximately 80% of total assets in the sector. Figure 2 shows the relationship between banks’ size and leverage ratios in 2015 and 2020 and how the largest four banks ‘moved closer together’ in terms of leverage and total assets.
Stress-test scenario
This section describes the stress-test scenario conducted to identify determinants of banking sector fragility to price-mediated contagion. The shocks are hypothetical and chosen to be artificially large to maximise stress-testing exposure. The stress scenario includes a -10% and -30% shock to the price of a marketable asset held by all banks, i.e. SA government bonds held in the trading book. One should note that the -30% price shock is extremely unlikely and only chosen to maximise the stresstest envelope. The largest price drop for the 10-year SA government bond in the last 20 years was -23% on 28 January 2004 (Figure 3).
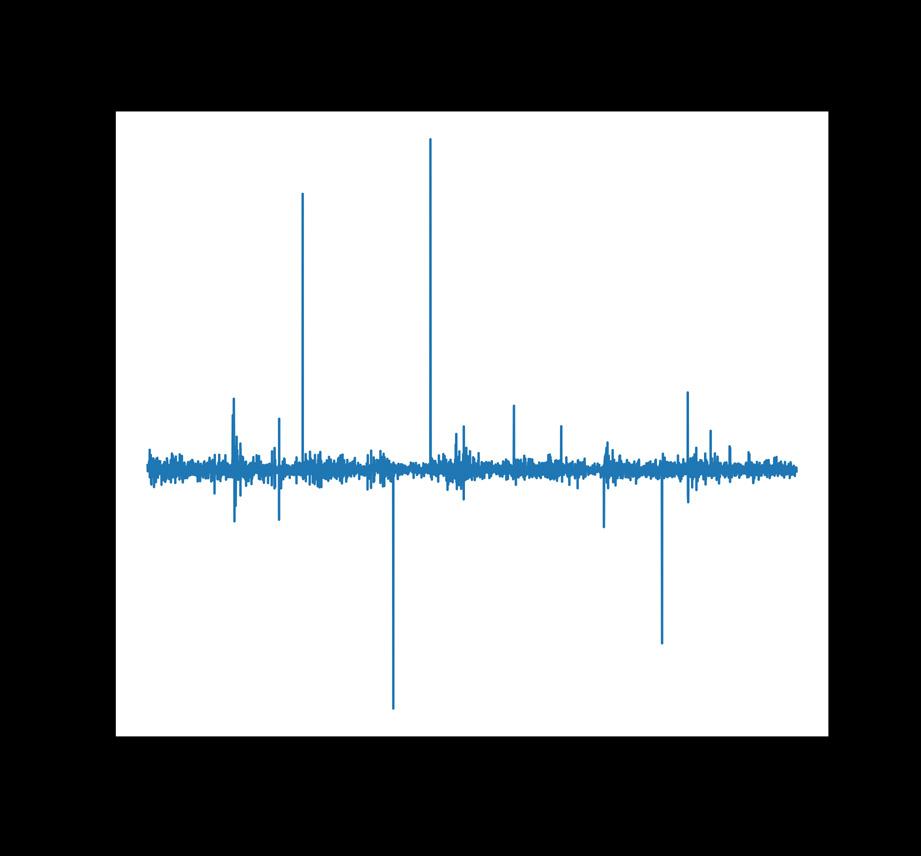
Figure 3: Daily price returns of the ZAR186 10-year South African government bond; y-axis displays price change in proportion, i.e. a maximum of 30%.
All banks holding SA government bonds in their trading book are exposed to this initial shock and engage in selling behaviour depending on whether
their leverage and/or liquidity requirements are breached. To shed more light on this, the heat map in Figure 4 displays fire-sales occurrence for each bank for the -10% and -30% shock on SA government bonds. Feedback price effects are caused mainly by Banks A to E, i.e. the five largest and most similar banks. Bank H does not experience any stress in the small shock scenario, but contributes to systemic losses given a larger -30% shock. Interestingly, Bank F and Bank I do not liquidate any of their assets even in the large shock scenario, which can be attributed to two factors. Firstly, they have very little asset holdings in SA government bonds overall, and, thus, no direct exposure to the initial shock. Second, the feedback price effects that occur in subsequent iterations can be absorbed by their liquidity buffers.
Which bank is vulnerable and which is systemic?
The question arises as to which bank is most systemic and which bank is most vulnerable. Two stress indicators can be computed for each bank in the shock scenario: (1) ‘systemicness’, a metric for systemic relevance capturing each bank’s contribution to total sector spillover losses, and (2) indirect vulnerability, i.e. the share of the bank’s equity lost ’indirectly’ through other banks’ deleveraging.2 Bank size enters the systemicness indicator, but not the indirect vulnerability indicator, which is driven by leverage and shock exposure to the bank’s assets. For example, a smaller bank can be vulnerable but not systemic. The systemicness of bank n is higher, the higher bank n’s leverage, the higher its connectedness (n owns illiquid and large assets hold by other banks) and the bigger bank n is in terms of total assets held.2 Table 1 shows that there are four systemically relevant banks (A–D) which contribute between 19% and 26% to total banking sector equity losses induced by the large stress-test scenario in 2020. These are also the largest four banks in terms of asset size. Looking at their indirect vulnerability in 2020, these systemically relevant banks display highly similar vulnerability in the large shock scenario (9.7% and 10.2% losses due to price-mediated contagion), alluding to the fact that they became very similar in terms of asset size and composition.
How has systemic relevance of banks changed over time?
Table 1 shows each bank’s contribution to total banking sector spillover losses for December 2015 and February 2020. The relevance of the largest four banks to systemic risk is fairly stable over time with Bank C overtaking Bank D in 2010. While Bank A is still the most systemic, contributing approximately 26% to total banking sector equity losses arising from price spillovers (Table 1), the largest four banks are moving closer together regarding their role in facilitating price-mediated contagion. Interestingly, while Bank A is the largest and most systemic bank in the stress test for February 2020 (Table 1), Bank B is the most vulnerable to the given shock scenarios (Table 2).
Table 1: Banking sector vulnerabilities, i.e. their contribution to banking sector equity losses, in the -30% shock scenario on South African government bonds for December 2015 and February 2020. Bank A is still the most ‘systemic’, contributing approximately 26% of total banking sector equity losses arising from price spillovers in 2020.
Bank A
Bank B Bank C
Bank D
Bank E Others
Dec-2015 Rank Feb-2020 Rank
28% 1 26% 1 23% 2 24% 2 22% 3 20% 3 18% 4 19% 4 7% 2% 5 6 9% 2% 5 6
Table 2: Banks’ indirect vulnerability, i.e. their percentage of equity lost due to price-mediated contagion during the -30% price shock on South African government bonds for December 2015 and February 2020
Dec-2015 Rank Feb-2020 Rank
Bank B -9.2% 1 -10.2% 1 Bank A -7.7% 2 -9.7% 2 Bank D -7.5% 3 -10.2% 1 Bank E -7.4% 4 -9.7% 4 Bank C -6.5% 5 -8.2% 5 Others -3.2% 5 -3.1% 6
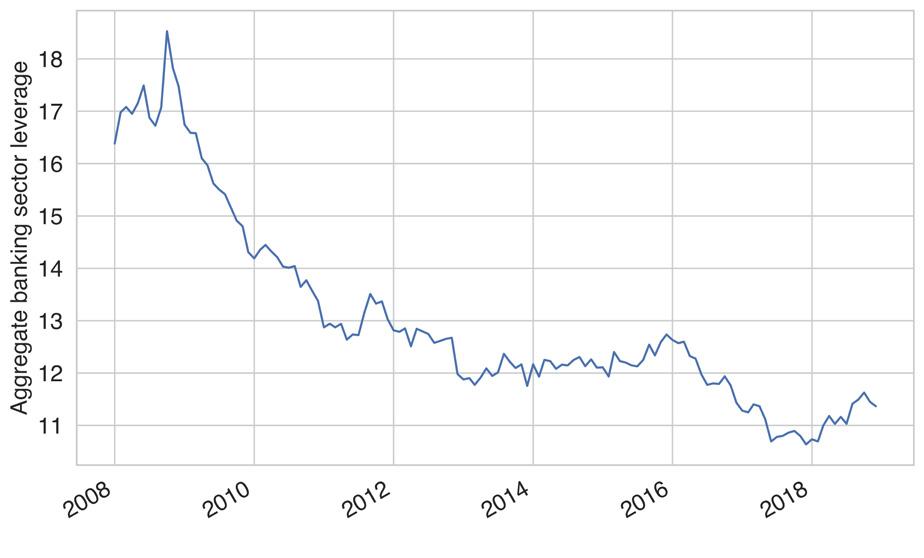
The central question of the study is to investigate whether portfolio similarity amongst South African bank increases the risk of pricemediated contagion.4-6 If one sums up all individual banks’ systemicness, one gets the fraction of aggregate banking system equity that is wiped out by feedback price effects to the initial shock. This is a metric of overall fragility of the financial system known as aggregate vulnerability.2 Figure 5 shows that the aggregate vulnerability for a 30% shock scenario on SA government bonds is very low and ranges between 4% and 8% of banking system equity between 2010 and 2020. However, while still at subdued levels, the aggregate vulnerability doubled over this period. What drove this development? One can rule out higher leverage ratios as a factor because the average leverage ratio of the largest 10 banks decreased over the period (Figure 6). One may suspect overlapping and interconnected portfolios as driving forces behind this trend.
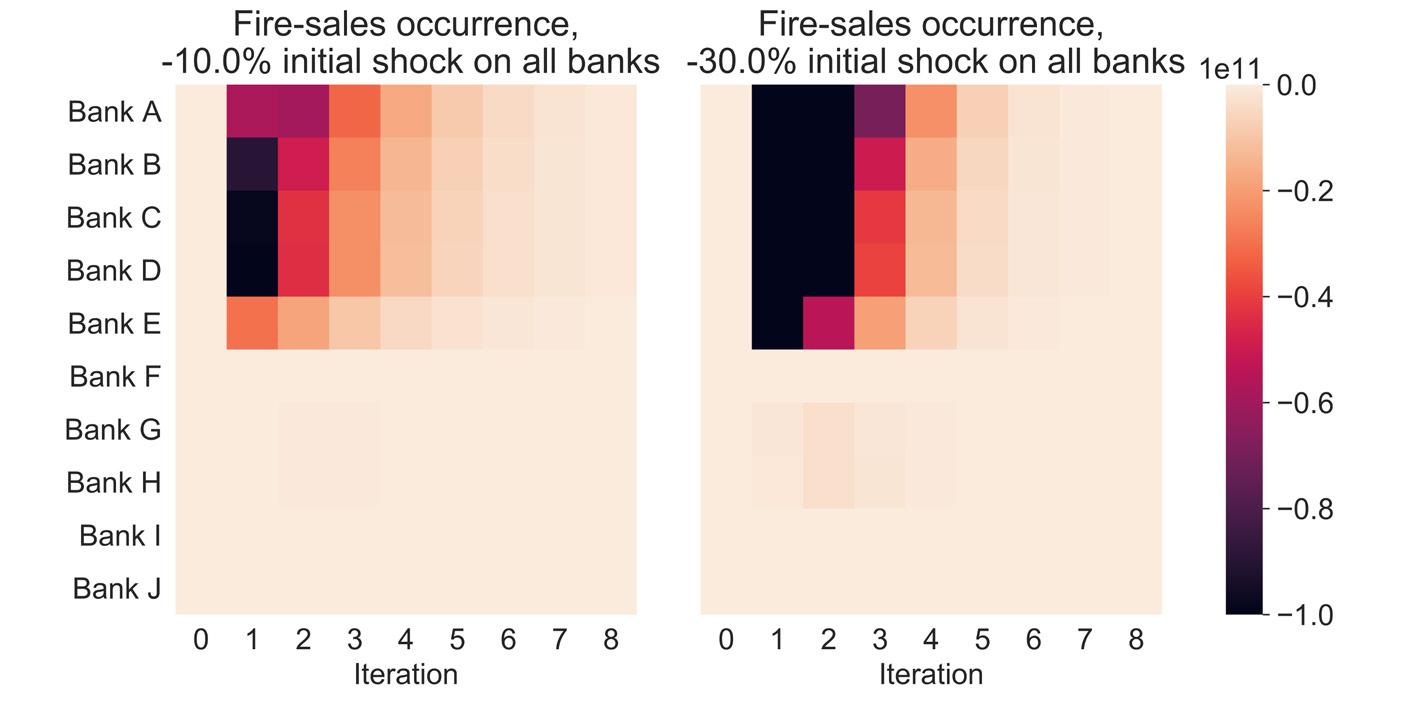
Source: South African Reserve Bank BA900 forms balance sheet data for February 2020 Figure 4: Asset sales per bank post-shock. All banks holding South African government bonds in their investment book are affected by a 10% (left chart) and 30% (right chart) price shock. Colour shades range from 0 to ZAR100 billion.
The scatter plot in Figure 7 shows the strong negative correlation between portfolio distance as measured by the average Euclidean distance between the largest 10 banks and aggregate sector vulnerability. Note that the more similar the banks, the lower the distance between their portfolios. Hence, we have an inverse correlation between distance and vulnerability.
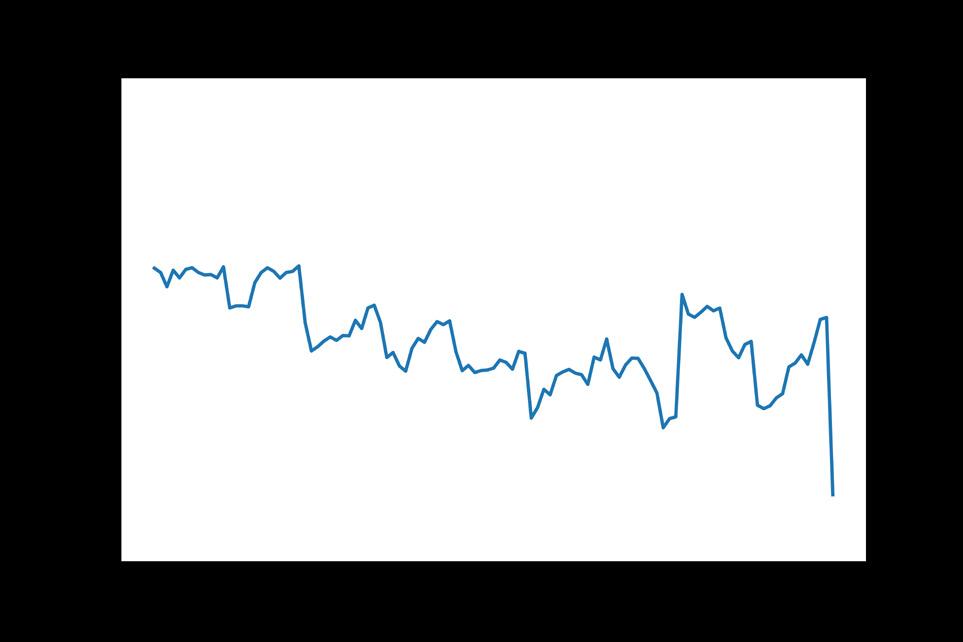
Figure 5: Aggregate banking sector vulnerability from 2010 to 2020. The y-axis has the share of banking sector equity wiped out by spillover losses, e.g. 4% in December 2010.
Figure 6: Leverage ratio averaged over for the largest 10 banks from January 2010 to February 2020. Leverage is defined as debt/ equity (book value).
Figure 7: Scatter plot of average portfolio similarity of the largest 10 banks as measured by the Euclidean distance and aggregate banking sector vulnerability to spillover losses.
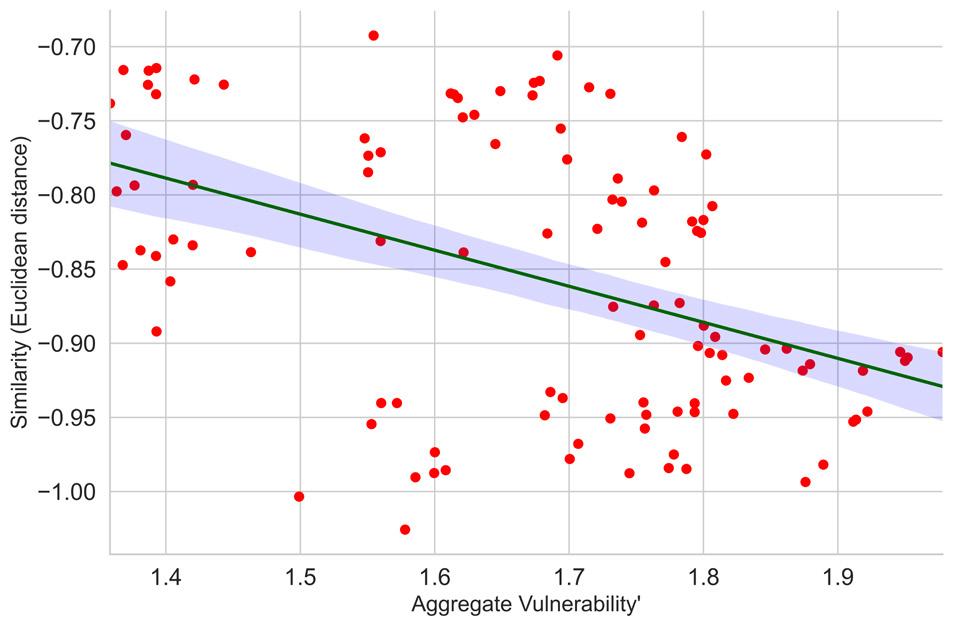
To quantify this relationship further, I conducted a least squares regression with heteroscedasticity-consistent standard errors of the log of aggregate vulnerability on the log of portfolio similarity (Euclidean distance). Table 3 shows a highly statistically significant β coefficient of -0.8, i.e. a 1% decrease in the average Euclidean distance leads to an increase in aggregate sector vulnerability of 0.8%. Hence, the hypothesis that higher similarity of portfolios in the South African banking sectors leads to higher exposure to price-mediated contagion could be confirmed. No suspicious patterns in residuals were detected in the post-regression analysis (Figure 8).
Table 3: Ordinary least squares regression of the log of aggregate banking sector vulnerability on the log of portfolio similarity for the largest 10 banks over the 10-year period from 2010 to 2020 using White–Huber standard errors. The Durbin–Watson test was carried out and did not detect serially correlated residuals.
Variable Log aggregate vulnerability
Log similarity -0.806*** (0.149)
Constant -3.622*** (0.128)
Observations
R-squared 108 0.196
Robust standard errors in parentheses ***p<0.01
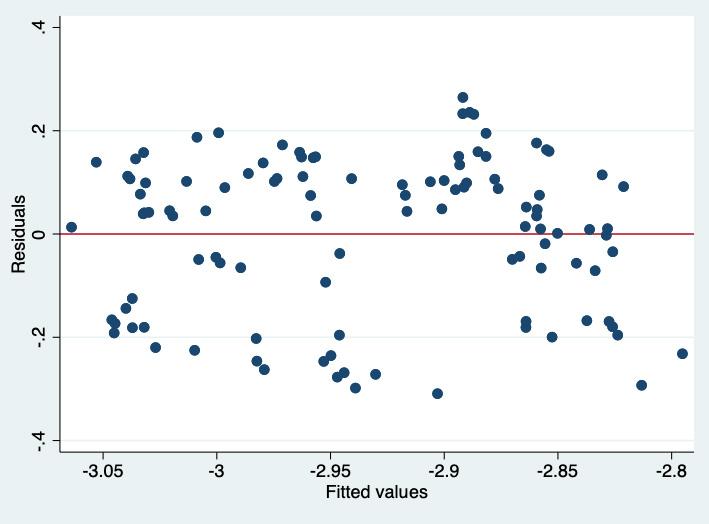
Figure 8: Residual versus fitted plot of pooled ordinary least squares regression. Residuals do not show any meaningful patterns.
Conclusion and policy implications
The vulnerability of the South African banking sector to price shocks of SA government bonds was explored. Overall, the findings demonstrate that second-order feedback effects from banks’ deleveraging are muted because asset sales are not large enough to trigger de-stabilising liquidation cascades. Firstly, knock-on price effects are partly absorbed by liquidity buffers. Given a 30% shock to SA government bonds held in banks’ trading book, second-round equity losses amount to approximately 8% of pre-shock levels. However, this exposure was twice as large in 2020 as it was in 2010. Furthermore, the stress tests confirm that a bank’s contribution to price spillover from contagion through common asset holdings is higher, the higher their leverage, their total assets (size), their connectedness (i.e. they own illiquid and large assets that are also held by other banks) and the larger the initial shock to which they are exposed. However, amplification can be substantially reduced by enlarging liquidity buffers. Overall, the characteristic of the South African banking system to be highly concentrated has a positive absorptive effect on financial system stability in terms of the fire-sale contagion channel. To mitigate the risk of price-mediated contagion in the banking system, the results point to two crisis intervention instruments. Firstly, the provision of emergency liquidity is crucial during a crisis to reduce the likelihood of banks’ asset liquidation. The stress test demonstrates the importance of liquidity buffers to dampen banks’ deleveraging spirals through fire-
sales. Second, the results suggest that regulators put maximum leverage requirements on hold during times of stress. Maximum leverage is a regulatory instrument that prevents high risk-taking behaviour ex ante. In times of stress, however, this regulation has the potential to aggravate the situation by incentivising deleveraging through asset liquidation. To lessen these amplification effects, banks should be allowed to have larger than normal leverage ratios temporarily until systemic risk subsides. As for holding government bonds in particular, the findings suggest that, from the perspective of price shock absorption and risk to price-mediated contagion, banks holding larger shares of their portfolio in government bonds is positive for financial sector stability. However, this does not take into account the interlinkage between banks and their respective governments and the so-called sovereign-bank nexus which describes the negative feedback effects on credit risk and crisis management that arise when banks hold sovereign credit risk. The explicit modelling of such amplification effects is an interesting extension of the current model framework and should be explored in further research.
Acknowledgements
I am grateful to the South African Reserve Bank for their financial support in the framework of the Financial Stability Grant.
Competing interests
I have no competing interests to declare.
References
1. Brunnermeier MK, Pedersen LH. Market liquidity and funding liquidity. Rev
Financ Stud. 2009;22(6):2201–2238. https://doi.org/10.1093/rfs/hhn098 2. Greenwood R, Landier A, Thesmar D. Vulnerable banks. J Financ Econ. 2015;115(3):471–485. https://doi.org/10.1016/j.jfineco.2014.11.006 3. Eisenberg L, Noe TH. Systemic risk in financial systems. Manage Sci. 2001;47(2):236–249. https://doi.org/10.1287/mnsc.47.2.236.9835 4. Shleifer A, Vishny R. Fire sales in finance and macroeconomics. J Econ
Perspect. 2011;25(1):29–48. https://doi.org/10.1257/jep.25.1.29 5. Cifuentes R, Ferrucci G, Shin HS. Liquidity risk and contagion. J Eur Econ
Assoc. 2005;3(2/3):556–566. https://doi.org/10.1162/jeea.2005.3.2-3.556 6. Caccioli F, Shrestha M, Moore C, Farmer JD. Stability analysis of financial contagion due to overlapping portfolios. J Bank Financ. 2014;46(1):233–245. https://doi.org/10.1016/j.jbankfin.2014.05.021 7. Cont R, Schaanning E. Fire sales, indirect contagion and systemic stress testing. Norges Bank Working Paper 02/2017. SSRN; 2017. https://doi. org/10.2139/ssrn.2955646


