8 minute read
Cost report Operating Cost Report


Operating Cost Report
Advertisement
Operating costs flat as a % of income As at the end of June 2019, total operating costs equated to 35.2% of gross income on an All Property level. This is 50bps down from December 2018 and 50bps above its long term average of 34.7%.
The improvement in the gross cost to income ratio came about as a result of total operating cost growing at a slower rate than gross income during the 6 months. Gross income growth of
KEY FINDINGS
● The improvement in the gross cost to income ratio came about as a result of total operating cost growing at a slower rate
than gross income during the 6 months. Gross income growth of 5.1% was driven by recoveries (fixed & variable) which grew
by 5.8% - faster than base rental which increased by 4.7%. Meanwhile operating costs grew by 3.6% during the six months -
translating to an annualised growth of 7.2%.
● All four property sectors saw their gross cost to income ratio improve during the period with the office sector recording
the biggest improvement of 100bps to end at 32.8%.
● The office sector's improving cost ratio needs to be viewed in context as the difficult operating environment is resulting in several
"false savings" such as declining letting commissions, electricity usage and cleaning cost - all a result of a decline in the level of
occupied area.
● Meanwhile, the overall net operating cost to income ratio improved during the year given the increase in variable cost recover
ies (i.e. metered consumption not 'fixed' according to the lease) as well as the improved recovery rate thereof.
● On an All Property level, the net income to cost ratio from 22.5% as at December 2018 to 21.9% as a t the end of June 2019.
● On a net basis, cost to income ratios were down for the residential, office and industrial sectors. In contrast, the retail sector saw
an increase of 40bps in its net cost ratio as variable tenant recoveries grew at a slower rate than total operating cost
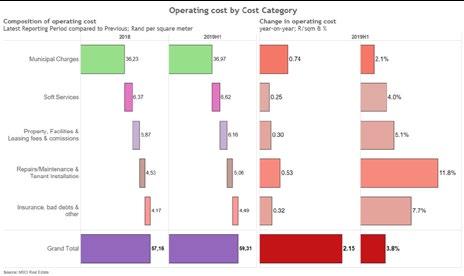
● Overall operating costs increased by R2.15/sqm per month for the six months ended June 2019 (3.8% up on a square meter
basis). The biggest driver of the increase was Municipal Charges (R0.74/sqm).
● Of the three main property sectors, Retail's cost to income ratio remains the highest on a gross and net basis. As at June 2019,
the sector's gross cost to income was measured at 37.4% while its net cost to income ratio stood at 23.5%.
● The office sector's gross cost to income ratio was 32.8% as at June 2019 with Prime Offices at 33.5% and Secondary Offices at
29.2%. The industrial sector's gross and net cost to income ratios are the lowest among the three traditional property sectors.
● The residential sector, in many ways still in its infancy in a South African context, has a higher cost to income ratio compared
5.1% was driven by recoveries (fixed & variable) which grew by 5.8% - faster than base rental which increased by 4.7%. Meanwhile operating costs grew by 3.6% during the six months - translating to an annualised growth of 7.2%.
All four property sectors saw their gross cost to income ratio improve during the period with the office sector recording the biggest improvement of 100bps to end at 32.8%. The office sector's improving cost ratio needs to be viewed in context as the difficult operating environment is resulting in several "false savings" such as declining letting commissions, electricity usage and cleaning cost - all a result of a decline in the level of occupied area.
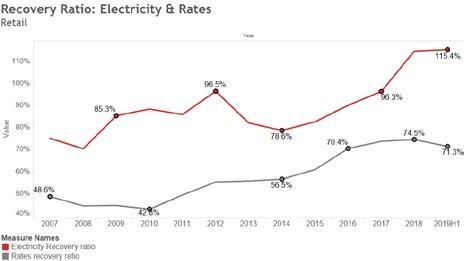
RATES RECOVERY POTENTIALLY NEARINGA CEILING? Meanwhile, the overall net operating cost to income ratio improved during the year given the increase in variable cost recoveries (i.e. metered consumption not 'fixed' according to the lease) as well as the improved recovery rate thereof. On an All Property level, the net income to cost ratio from 22.5% as at December 2018 to 21.9% as at the end of June 2019.
On a net basis, cost to income ratios were down for the residential, office and industrial sectors. In contrast, the retail sector saw an increase of 40bps in its net cost ratio as variable tenant recoveries grew at a slower rate than total operating cost.
This perhaps suggests that some landlords in the retail space may be approaching a ceiling in the level of costs it can recover from tenants. The graphic below shows the electricity and rates recovery ratios for the Retail sector. While the electricity recovery ratio can be expected to remain high given that tenants are typically individually metered, a slide in the Rates recovery ratio could be an indication that - on average- retailer cost of occupancy may be becoming unsustainable.
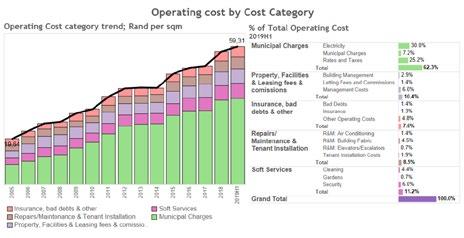
MUNICIPAL CHARGES STILL THE LARGEST COST CATEGORY Among the major property operating cost categories, municipal charges continues to make up the largest percentage of overall operating cost. Municipal charges comprises rates & taxes, electricity & other metered utility charges such as water and CID charges.
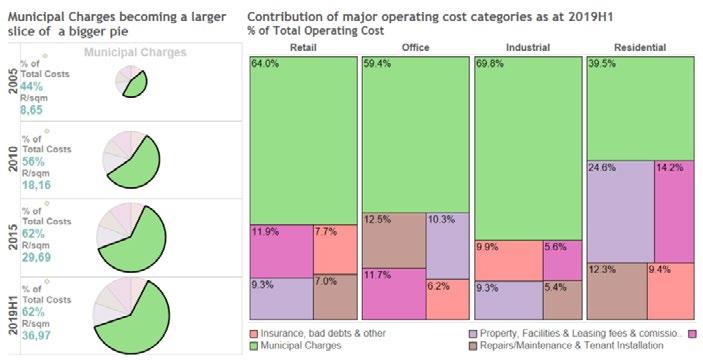
On a per square meter basis, municipal charges are up 2.1% for the size months ended June 2019. At the end of the period, municipal charges accounted for 62% of total operating costs and 22.0% of Gross Income. From 2010 to 2019, municipal charges grew faster than any other operating cost category- becoming a bigger slice of a bigger pie. During this time, it effectively double in going from R18.16 in 2010 to R36.97 in June 2019 (CAGR of 7.8%).
On a sector level, industrial property's municipal charges make up the largest percentage of total costs at 69.8% - followed by Retail & Office with 64.0% and 59.4% respectively.
The office sector continues to have a higher weighting in Repairs/ Maintenance/Tenant Installation with a contribution of 12.5% to the overall cost line. This is significantly higher than the retail and industrial sectors underlining the importance office landlords are attaching to both tenant retention and incentives for new tenants in the current environment.
Slightly worrying is the continued growth in the level of bad debts written off- not for Offices but across all sectors. In the first half of 2019, Bad debt write offs across all property sectors increased to multiyear highs and in the case of industrial property, to an all-time high of 78cents/sqm.
MUNICIPAL CHARGES UP TO 62% OF TOTAL COSTS
ARGEST PERCENTAGE INCREASE IN REPAIRS. MAINTENANCE AND TENANT INSTALLATIONS Overall operating costs increased by R2.15/sqm per month for the six months ended June 2019 (3.8% up on a square meter basis). The biggest driver of the increase was Municipal Charges (R0.74/sqm), with the rest of the operating cost categories increasing by a combined R1.41/sqm. The largest increase on a percentage basis was the repairs, maintenance and tenant installations category which in turn was driven by the office sector as mentioned earlier in this report. With the latest double digit increase (more than 20% on an annualised basis), this category has become the second largest cost category on an All Property level as at June 2019.

Insurance, bad debts as well as other costs increased to R4.49/sqm/month- a 7.7% increase over the six months-driven by a higher level of bad debt write offs across all sectors.
Property/Facilities & Leasing fees & commissions increased by 30 cents per square meter (or 5.1%) to R5.06/ sqm/month at the end of June 2019. Leasing and Property Management Fees remained stable during the six months indicative of the muted operating environment while Building Management (which includes on-site staff salaries) was responsible for the bulk of the growth in the broader category.
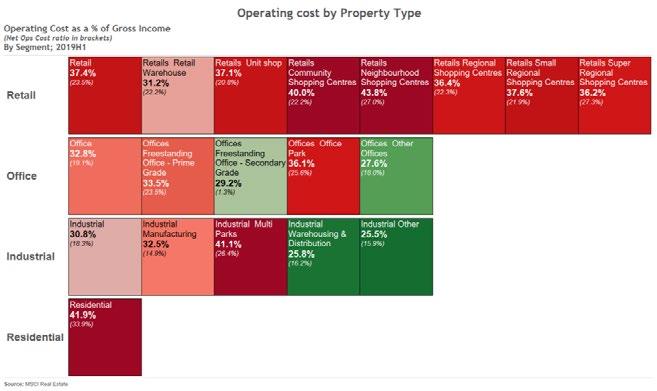
RETAIL COSTS HIGHER AS A % OF GROSS INCOME Of the three main property sectors, Retail's cost to income ratio remains the highest on a gross and net basis. As at June 2019, the sector's gross cost to income was measured at 37.4% while its net cost to income ratio stood at 23.5%. On a segment level, Super Regional (>100k sqm) & Regional centres (50k-99.9k sqm) reported the lowest gross cost to income ratio of the multi tenanted retail formats at 36.2% and 36.4% respectively
as at June 2019. On a net basis, Super Regional centres' cost to income ratio decreased from 27.5% as at December 2018 to 27.3% as at June 2019.
The office sector's gross cost to income ratio was 32.8% as at June 2019 with Prime Offices at 33.5% and Secondary Offices at 29.2%. Office Parks had a lightly higher gross cost to income ratio at 36.1%. The industrial sector's gross and net cost to income ratios are the lowest among the three traditional property sectors. However, among the underlying segments there is some variance with Warehousing being less cost intensive than the Manufacturing and the Industrial Multiparks segments. The residential sector, in many ways still in its infancy as an investable property sector in a South African context, has a higher costww to income ratio compared to the three traditional sectors. The makeup of its basket of costs are also different with a lower weighting in the Municipal Charges category and a higher allocation towards Property & facilities Management and Letting Fees and commissions.