12 minute read
Community Financial Report
Embrace
COMMUNITY
OVERVIEW
Council’s key financial results for the financial year ended 30 June 2019:
KEY RESULTS
Total Income Total Expenses Net Result Operating Surplus/(Deficit) Total Assets Total Liabilities
Net Assets
2018-19
$110.4M $74.9M $35.5M $1.8M $957.3M $48.4M
$908.9M
FINANCIAL PERFORMANCE Total income
Council’s income is derived from various sources and a breakdown of Council’s 2018-19 income is shown below. Rates and utility charges are Council’s main source of recurrent income. However, other types of income such as fees and charges, sale of contract and recoverable works, grants and contributions are also important sources of funding.
33% 0%
3% 2% 4% 2% 4% 4% 48%
Rates & Utility Charges Fees & Charges Interest & Investment Revenue Sale of Contract & Recoverable Works Grants & Contributions - Operating Share of Profit from Associate Other Revenues Grants & Contributions - Capital Capital Income
TOTAL INCOME
Rates and utility charges Fees and charges Interest and investment revenue Sale of contract and recoverable works Grants and contributions - operating Share of profit from associate Other revenues Grants and contributions - capital Capital income
TOTAL INCOME 2016-17
$47.6M $4.7M $2.1M $6.3M $15.7M $3.0M $3.1M $11.8M $0.1M
$94.4M 2017-18
$50.5M $5.3M $2.3M $5.6M $4.4M $2.6M $3.2M $38.2M $0.2M
$112.3M 2018-19
$52.7M $4.8M $2.4M $4.5M $4.4M $2.4M $3.0M $36.1M $0.1M
$110.4M
Total income received during 2018-19 was $110.4 million, which is a decrease of $1.9 million from the previous year. Rates and utility charges were $2.2 million higher than the previous year. However, this result is slightly behind the 2018-19 budgeted revenue for rates and utility charges of $53.1 million due to reductions in property valuations. Fees and charges were $0.5 million lower than the previous year due predominantly to an decrease in fees associated with building, plumbing and new development fees. Interest received was $0.1 million higher than the previous year as cash levels remained relatively consistent. Sale of contract and recoverable works income were $1.1 million lower than the previous year. This result is in line with the 2018-19 budget that took into account lower levels of contracts with Department of Transport and Main Roads as well other recoverable works. Operating grants and contributions were at similar levels compared to the previous. The share of profit from associate is Council’s share of profits from Queensland Urban Utilities (QUU), in which it has an ownership interest of 1.042 per cent. Further information on QUU is contained at Note 12 of the audited financial statements. Other revenues are $0.2 million lower than the previous year due to lower tax-equivalents returns from QUU along with reduction in the waste disposal income from Logan City Council. Capital grants and contributions were $2.1 million lower than the previous year. This is due mainly to the higher level of subsidies received during 2017-18 for restoration works related to flood damage offset by the advance receipt of grant funding for the Beaudesert Business Park project - funded under the State Government’s Building our Regions program.
Total expenses
Council provides a wide range of services to the community and, in doing so, incurs a variety of expenses. A breakdown of Council’s 2018-19 expenses is shown below.
21%
2% 3%
40%
Employee Benefits Materials & Services Finance Costs Depreciation & Amortisation Capital Expenses
34%
TOTAL EXPENSES
Employee benefits Materials and services Finance costs Depreciation and amortisation Capital expenses
TOTAL EXPENSES 2016-17
$27.7M $30.5M $1.1M $13.8M $4.3M
$77.4M 2017-18
$28.8M $23.4M $1.1M $16.1M $8.2M
$77.6M 2018-19
$29.9M $25.3M $1.2M $16.0M $2.6M
$75.0M
Employee benefits have increased by $1.1 million from the previous year due to an administrative pay increase applied 1 July 2018 along with costs in delivering Council’s Refresh and Refocus program.
Materials and services have increased by $1.9 million from the previous year. This relates largely to Council’s decision to reverse the accounting treatment of gravel re-sheeting from being a capital expenditure to a maintenance and operations item. Additionally there were increases of $2.2 million in other operational areas including facilities, parks and gardens, fleet, waste collection, IT systems due to new operating initiatives and/ or increase in operational costs. These increase were offset by reductions in Council’s legal expenses and decrease in budgeted expenditure for recoverable works.
Finance costs are the interest on loans taken out by Council and these have increased by $0.1 million from the previous year due to $3.0M of new borrowings received in 2017-18.
Depreciation and amortisation expenses are non-cash and represent the reduction of the value of non-current assets as a result of wear and tear, age or obsolescence. Non-current assets are shown in the Statement of Financial Position. These have increased by $122.3 million from the previous year predominantly due to changes in valuation assumptions.
Capital expenses represent the write off of the written-down value of non-current assets because they have been disposed of. This can occur through sale or obsolescence. The decrease from the previous year of $5.6 million relates to road and bridge write offs resulting from the impact of ex-Tropical Cyclone Debbie. Capital expenses are non-cash.
OPERATING RESULT
OPERATING RESULT
Operating surplus/(deficit)
2016-17
$9.5M
2017-18
$4.5M
2018-19
$1.8M
The operating surplus/(deficit) is the net result excluding capital items related to income and expenses. A surplus indicates that revenue raised covers operational expenses and there is an amount available equivalent to the surplus for capital funding purposes or other purposes. A deficit indicates that revenue raised does not cover operational expenses. Council’s operating surplus in 2018-19 was $1.8 million.
FINANCIAL POSITION Total assets
Assets consist of current assets, which can be converted to cash in less than one year and non-current assets, which would most likely take longer than a year to convert to cash. A breakdown of Council’s assets is shown below:
TOTAL ASSETS
Cash and investments Trade and other receivables Other assets Loans Investment in associate Infrastructure, property, plant and equipment
Total assets 2016-17
$29.3M $11.7M $2.2M $14.7M $34.3M
$691.7M
$783.8M 2017-18
$45.9M $11.6M $2.0M $14.7M $35.2M
$738.3M
$847.7M 2018-19
$38.1M $6.0M $2.0M $14.7M $36.0M
$860.6M $957.3M
Cash and investments has decreased from the previous year by $7.8 million. Trade and other receivables decreased by $5.6 million from the previous year, which relates to a lower level of outstanding rates and charges as well as lower receivables for other grant-funded projects, lower levels of infrastructure charges and lower levels of QUU dividends. Other assets consist of inventories, other assets, non-current assets held for sale and intangible assets. This saw a similar result from the previous year due to the increase in levels of quarry materials being netted off by a decrease level in workshop and supply inventory. The loan balance of $14.7 million represents Council’s loan to QUU. This is an interest only loan and payments received are recognised as interest revenue. The value of the loan represents 40 per cent of Council’s regulatory asset base that was transferred to QUU upon formation. The investment in associate represents Council’s participation rights in QUU. Upon formation of QUU, Council’s participation rights represented 60 per cent of Council’s regulatory asset base. The increase of $0.8 million from the previous year is due to the recognition of Council’s share of QUU returns. The written-down value of infrastructure, property, plant and equipment increased by $122.3 million from the previous year. Infrastructure, property, plant and equipment accounts for 90 per cent of Council’s total assets.
2018-19 capital expenditure
Capital works excluding those funded by the Natural Disaster Relief and Recovery Arrangements program (NDRRA) of $43.6 million were undertaken during 2018-19.
CAPITAL EXPENDITURE
Roads Bridges Drainage Footpaths Facilities, parks and gardens Vehicles, plant and equipment Waste management Other projects
Total
2018-19 Capital Expenditure
Waste Management Other Projects $1.0M $0.7M Vehicles, Plant & Equipment 2% 2% $2.8M 7%
Facilities, Parks & Gardens $3.2M 8%
Footpaths $1.0M 2%
2018-19
$20.1M $14.6M $0.2M $1.0M $3.2M $2.8M $1.0M $0.7M
$43.6M
Drainage $0.2M 0%
Roads $18.3M 44%
Bridges $14.6M 35%
Total liabilities
Liabilities consist of current liabilities, which are expected to be paid or settled in less than one year and non current liabilities, expected to be paid or settled in more than one year. A breakdown of Council’s liabilities is shown below:
TOTAL LIABILITIES
Trade and other payables Employee benefits Borrowings Provisions
Total liabilities 2016-17
$4.7M $9.8M $21.3M $1.0M
$36.8M 2017-18
$11.2M $10.8M $23.2M $1.1M
$46.3M 2018-19
$8.2M $11.2M $26.7M $1.0M
$48.4M
Trade and other payables decreased by $3.0 million from the previous year. Employee benefits increased by $0.4 million from the previous year due to the reduction in discount rates used for calculation (Commonwealth bond rates). Employee benefits represent the amount required under the accounting standards to be set aside to fund employee entitlements for annual leave and long service leave.
Borrowings increased by $3.5 million from the previous year due to the drawdown of an additional $4.7 million in loans at June 2019. This was offset by $1.2 million in repayments of loan principle. Provisions consist of rehabilitation provisions for quarries and waste disposal sites. Other liabilities for 2018-19 consists of the prepayment by the State Government to mitigate the impacts on households for 2019-20 of the domestic State Waste Levy, which takes effect from 1 July 2019.
Net community assets and equity
Net community assets and equity are represented by what we own (total assets) less what is owed (total liabilities).
NET COMMUNITY ASSETS
Net assets
2016-17
$747.0M
2017-18
$801.4M
2018-19
$908.9M
COMMUNITY EQUITY
Accumulated surplus Asset revaluation surplus
Total equity 2016-17
$561.7M $185.3M
$747.0M 2017-18
$596.4M $205.0M
$801.4M
2018-19 $631.9M $277.0M $908.9M
Community equity increased by $107.5 million (rounded) from the previous year, which is the value of total comprehensive income from the Statement of Comprehensive Income of $35.5 million, and the movement of the Asset Revaluation Surplus of $72.0 million.
CASH FLOWS
The Statement of Cash Flows shows where Council received its cash and where this was subsequently spent.
CASH FLOWS 2016-17 NET CASH INFLOW/(OUTFLOW) FROM:
Operating activities $17.0M Investing activities ($18.6M) Financing activities $1.1M
Net increase/(decrease) in cash held ($0.6M) 2017-18
$21.8M ($7.2M) $2.0M
$16.6M 2018-19
$19.1M ($30.3M) $3.5M
($7.8M)
Net cash from operating activities decreased by $2.7 million from the previous year. Net cash used in investing activities increased by $23.1 million from the previous year. Net cash from financing activities increased by $1.5 million from the previous year.
Year-end cash balance
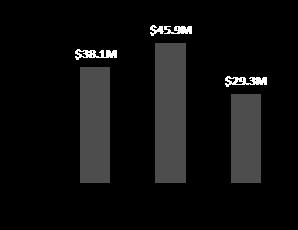
Council’s year end cash balance was $38.1 million as at 30 June 2019.
FINANCIAL SUSTAINABILITY INDICATORS
Section 104(2) of the Local Government Act 2009 provides the following definition of financial sustainability:
A local government is financially sustainable if the local government is able to maintain its financial capital and infrastructure capital over the long term. Financial sustainability is a strategy and ratios are used as pointin-time measurements to assess the outcomes of the strategy. The Department of Infrastructure, Local Government and Planning has developed financial sustainability indicators to assist in the assessment of the long-term financial sustainability of councils. Section 169(5) of the Local Government Regulation 2012 outlines the three relevant measures of financial sustainability that all Queensland local governments must report on: a) Asset Sustainability Ratio b) Net Financial Liabilities Ratio, and c) Operating Surplus Ratio. The measurement of the above ratios is in accordance with the Financial Management (Sustainability) Guideline 2013.
Why is financial sustainability important?
Local governments are responsible for directly providing residents with a wide range of public services and community infrastructure and facilities. This requires local governments to hold and maintain a significant base of infrastructure assets, which necessitates not only substantial initial investments but also continued expenditure to maintain and renew assets over the course of their respective useful lives. The outcomes of Council’s financial sustainability strategy are as follows: • To allow for the adequate provision for programs (including capital expenditure) and services into the future without having to introduce substantial or disruptive revenue (and expenditure) adjustments; and • To allow for the equitable distribution of the costs of establishing and maintaining community assets and services between current and future ratepayers. The Queensland Audit Office’s report to State Parliament on the outcomes of local government audits for 2015-16 rated Scenic Rim Regional Council as having a low risk of financial sustainability concerns. The Queensland Treasury Corporation performed a credit risk during 2018-19 and rated Council as being Sound with a Neutral Outlook. Council is committed to remaining financially sustainable through appropriate levels of service provision.
ASSET SUSTAINABILITY RATIO Definition:
An approximation of the extent to which the infrastructure assets managed by Council are being replaced as they reach the end of their useful lives.
How is it calculated?
Capital expenditure on replacement of assets (renewals) divided by depreciation expenditure.
Why is it important?
Assists in identifying Council’s asset base consumption and renewal levels and capacity to fund the level of investment needed over the long-term.
Target:
Greater than 90 per cent per annum (on average over the long-term).
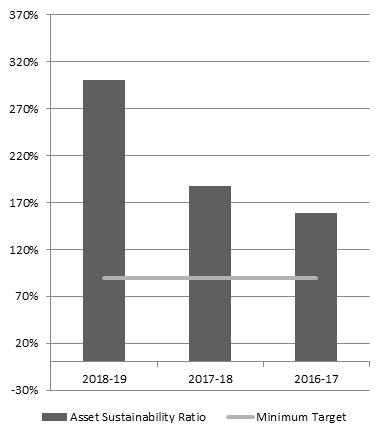
Council’s asset sustainability ratio for 2018-19 was 301 per cent. This means that Council is likely to be sufficiently maintaining, replacing or renewing existing infrastructure assets as they reach the end of their useful life. The result continues to be high due to the impacts of flood restoration works undertaken as part of the Natural Disaster Relief and Recovery Arrangements (NDRRA).
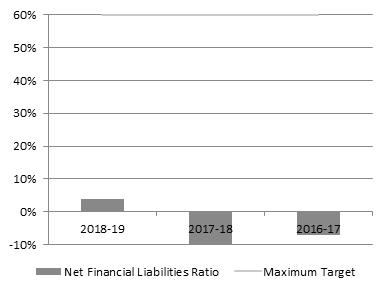
NET FINANCIAL LIABILITIES RATIO Definition:
An indicator of the extent to which the net financial liabilities of Council can be serviced by its operating revenues.
How is it calculated?
Total liabilities less current assets divided by total operating revenue (excluding capital items).
Why is it important?
Assists in identifying Council’s financial capacity and the ability to fund ongoing operations over the long-term.
Target:
Less than 60 per cent per annum (on average over the long-term). Council’s net financial liabilities ratio for 2018-19 was four per cent. This means that Council has the capacity to comfortably fund its liabilities. A negative indicator means that current assets exceed total liabilities and that Council has the capacity to increase loan borrowings if required.
OPERATING SURPLUS RATIO Definition:
An indicator of the extent to which revenue raised covers operational expenses only or are available for capital funding purposes or other purposes.
How is it calculated?
Net result (excluding capital items) divided by total operating revenue (excluding capital items).
Why is it important?
Assists in identifying Council’s financial capacity and the ability to fund ongoing operations over the long-term.
Target:
Between zero per cent and 10 per cent per annum (on average
over the long-term).
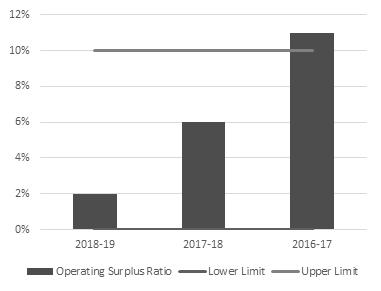
Council’s operating surplus ratio for 2018-19 was two per cent. Council was forecasting an operating surplus ratio of 1.8 per cent for 2018-19 and the slight improvement in the result relates to total recurrent revenue being higher than the forecast and total recurrent expenditure being lower than the forecast at the end of the financial year. This means that Council is expecting to generate healthy levels of revenues that can be used to fund proposed capital expenditure and debt repayments, and is less likely to
compromise the levels of service expected by ratepayers.
