10 minute read
Chapter 6: Application of Generative Design in Architecture
CHAPTER 6:
Application of Generative Design in Architecture and related fields
Advertisement
35
CHAPTER 6: APPLICATION OF GENERATIVE DESIGN
6.1: Autodesk University Exhibit Hall
Designed by: The Living
An Autodesk Studio which applies research to architectural practice.
This project is chosen becauseits documentation available onlinewas published by its designers and it clearly highlights their workflow. Therefore, this project will prove to be instrumental in studying the practical application of Generative Design to design problems.
PRE GD-OPERATIONS
6.1.1 Data collection for design requirements
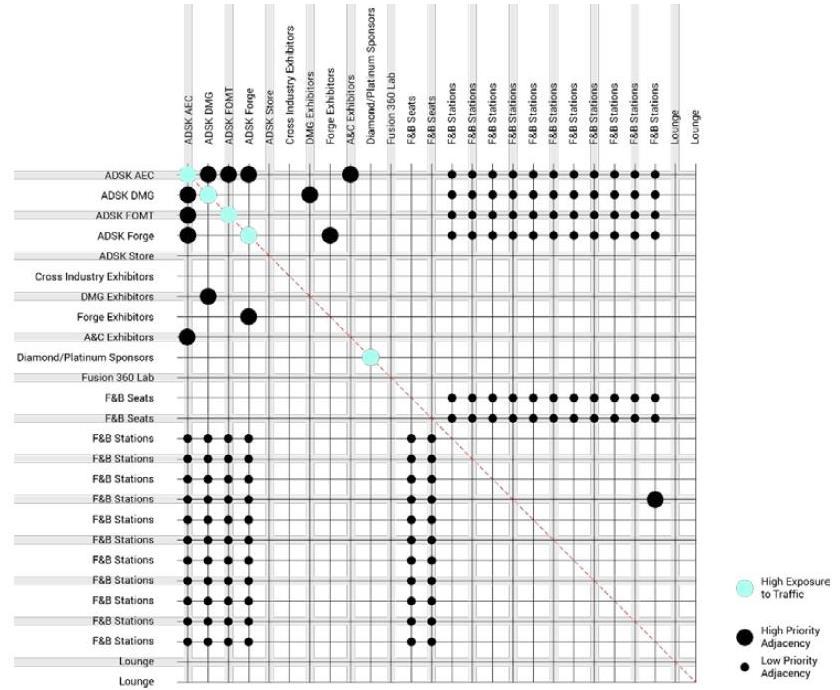
Design requirements of the pavilion, adjacency preferences and preferred locations of different stalls is gathered and a matrix defining these relationships was prepared by the designers for better understanding.
Figure 20: AU booths and pavillons adjacence matrix. (Nagy & Villaggi, Generative Design for Architectural Space Planning, 2018)
36
6.1.2 Classification and identification of constraints in design space
1. Design Constraints: Placement of all booths with respect to access points in the design space and the main hall. 2. Pre-Existing Constraints: Defining design space boundaries, columns, egress areas and restrooms. 3. Access Constraints: Fixed access points in the design space. (Nagy & Villaggi, Generative Design for Architectural Space Planning, 2018)
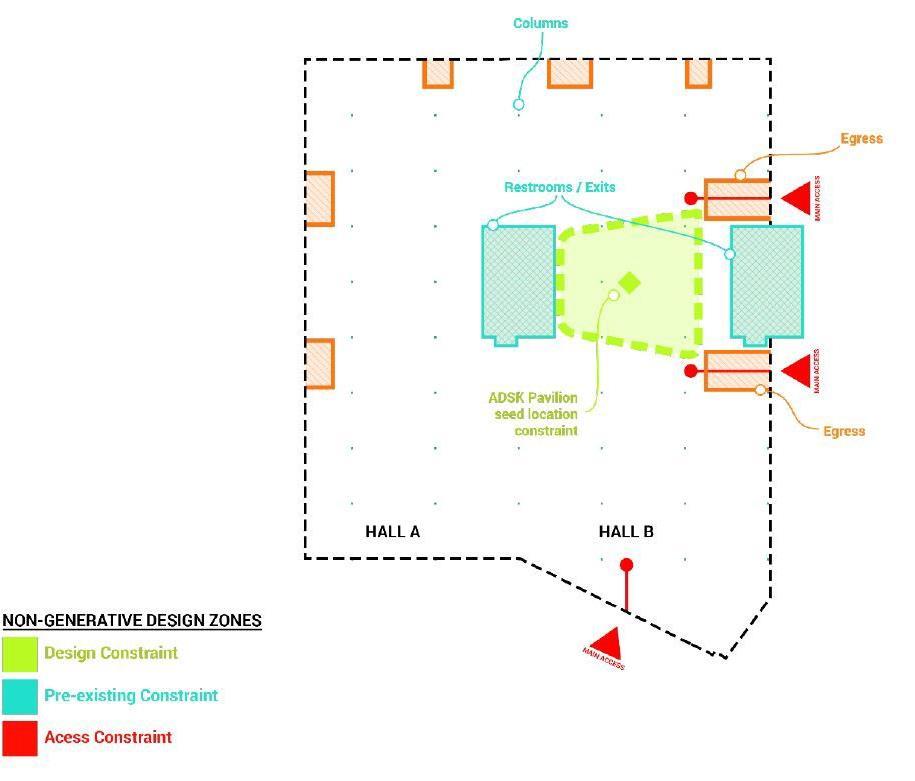
Figure 21: AU Exhibit Hall Site Constraints (Nagy & Villaggi, Generative Design for Architectural Space Planning, 2018)
6.1.3 Formulation Design Objectives
With discussion, the designers and stake holders came to the conclusion that the design required mapping and distribution of high activity zones to manage traffic in the pavilion. Secondly, the design had to evaluate the required proximity of booths to high activity zones (Nagy & Villaggi, Generative Design for Architectural Space Planning, 2018)
37
6.1.4 Design Space parametrization
After setting constraints and formulating goals for the design space, parametricism of the design space is required.
a. b.
c. d
e. f.
g.
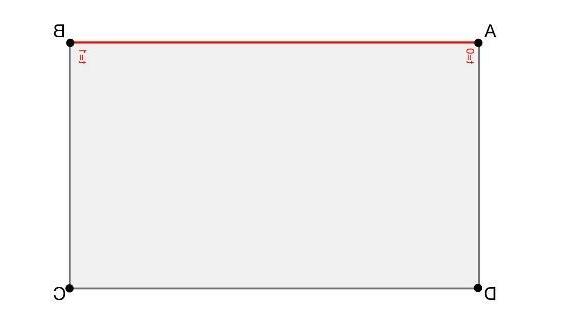
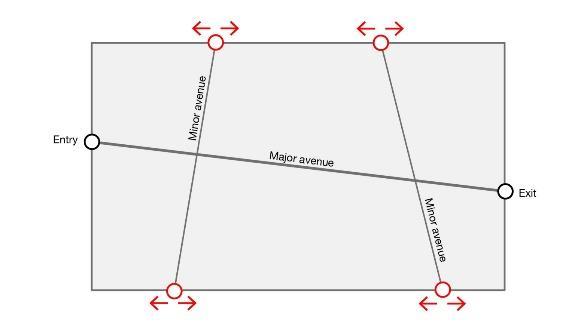
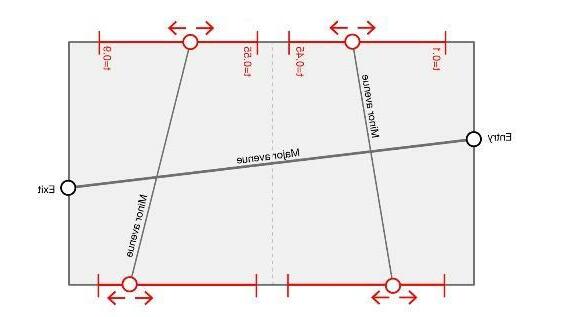
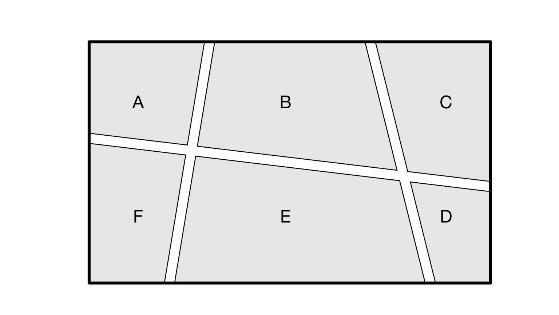
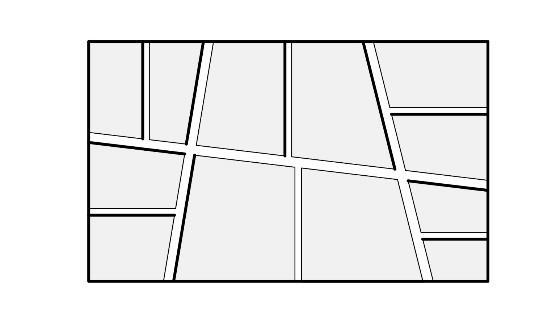
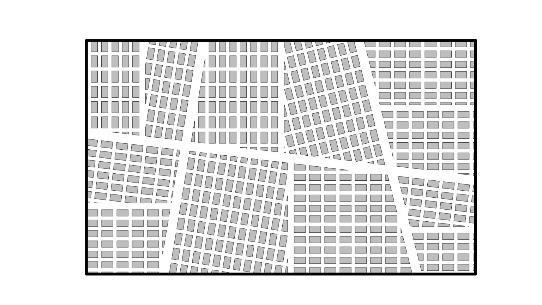
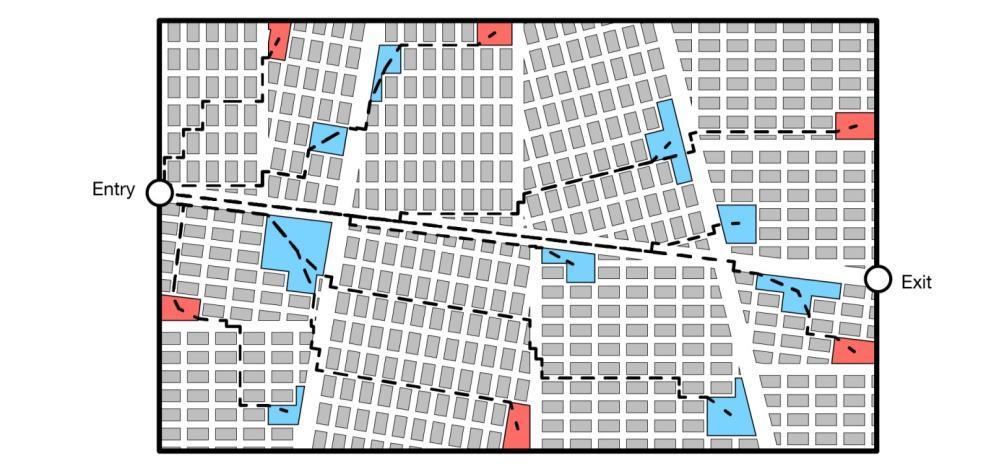
Figure 22(a-g): Step by Step parametrization of design space (Wintour, 2021)
38
For understanding, the shape of Exhibition Hall is assumed to be a rectangle as shown in Fig 8: (a-g). The design proceeded as indicated in the steps below.
a. Defining the boundary of the exhibition hall. Thus, setting extents of the project from t=0 to t=1 (where it is the name of parameter). The boundaries are assigned as reference parameters for defining positions of other paramters with respect to it. b. Using existing access points (entry and exit) to determine the placement of the main circulation route in the exhibition hall. The major avenue is subdivided into minor avenues as required. c. Parametric range is set for the points of minor avenue to move along the boundary, to find the best arrangement and subdivision of hall.
The range for set of points belonging to the first partition is from t=0.1 to t=0.45. Similarly for second minor avenue the range is from t=0.55 to t=0.9 (Wintour, 2021)
The information in design space is guided by two types of parameters. Steps a and b above are carried out using the initial three paramters stated in the beginning (Fig 3). The second set of 22 paramters are used for the subdivision and placement of the major expo programs along the circulation routes (Nagy, Villaggi, Zhao, & Benjamin, 2017)
d. After finding the most optimum placement for minor avenues, the floor plan is subdivided further into sections, A, B, D, E, F.
e. These macro regions are divided into micro regions on the basis of the following principles (as outlined in (Nagy, Villaggi, Zhao, &
Benjamin, 2017):
“1. Identify macro-regions that share at least one edge with the exhibit hall boundary.
2. For each of these macro-regions identify the longest edge that is shared with the exhibit hall boundary and locate the midpoint of the edge.
39
3. Draw a secondary avenue line perpendicular from this midpoint to the opposite edge of the macro-region.”
(Nagy, Villaggi, Zhao, & Benjamin, 2017)
f. Fixed grids of 40’ x 20’ are used to further subdivide the micro regions in cells for space allocation of booths in the pavilion.
The division of space was optimized using algorithms. On the proposed space, allocation ofspaces hadto bedoneto meet thegoals formulated in the pre- GD stage.
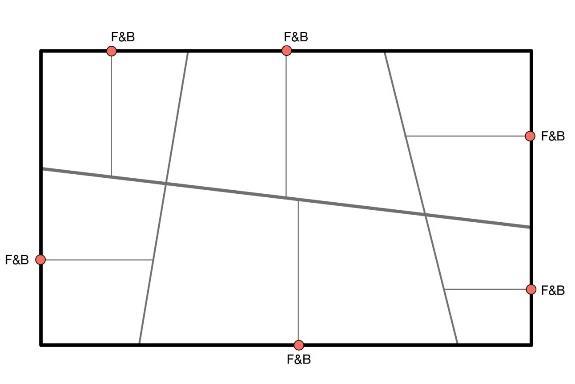
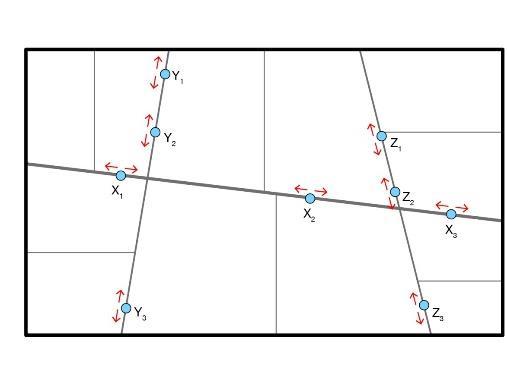
Figure 23: Placement of F&B and major events in the Au Exhibit hall
• Allocation of F&B zones was done first to ensure that it was evenly distributed and easily accessible to the visitors that pass by and to the ones attending the exhibition. “This strategy distributes the F&B programs around the floor plan, avoids dead ends, and minimizes congestion while creating attractions that draw people further into the space” (Nagy, Villaggi, Zhao, & Benjamin, 2017)
• 11 Major program locations were pinpointed in the space. These are
known as “seed points”.
• The cells around seed point are evaluated. The program searches for a combination of neighboring cells which can be merged to fulfil the area requirements of the event. Only the cells which have a common edge with the cell with seed point are considered. The adjacency matrix prepared in the data collection stage proved to be useful in this stage.
“The dual steps of subdivision and merging create a complex design space capable of creating a very large variety of design options that are guaranteed to accommodate the
40
programmatic needs of the event” (Nagy, Villaggi, Zhao, & Benjamin, 2017)
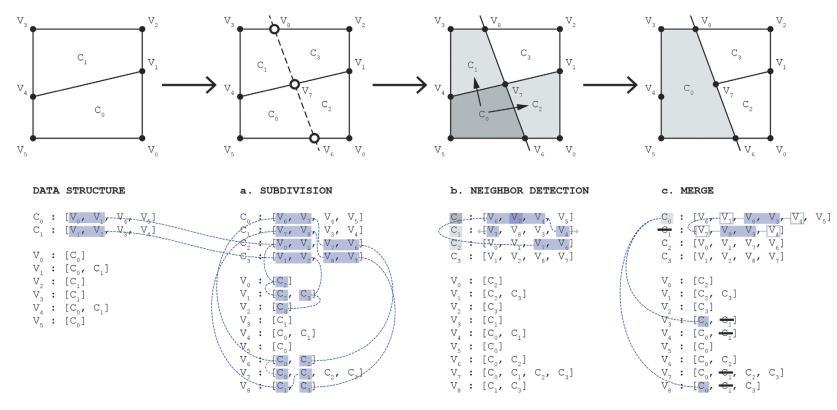
Fig 10: Primary operations carried out by the program for merging cells to fulfill the area requirements.
g. After allocation of events, shortest path was calculated to the major events and Food and Beverage zones. (F&B: red; Events: blue)
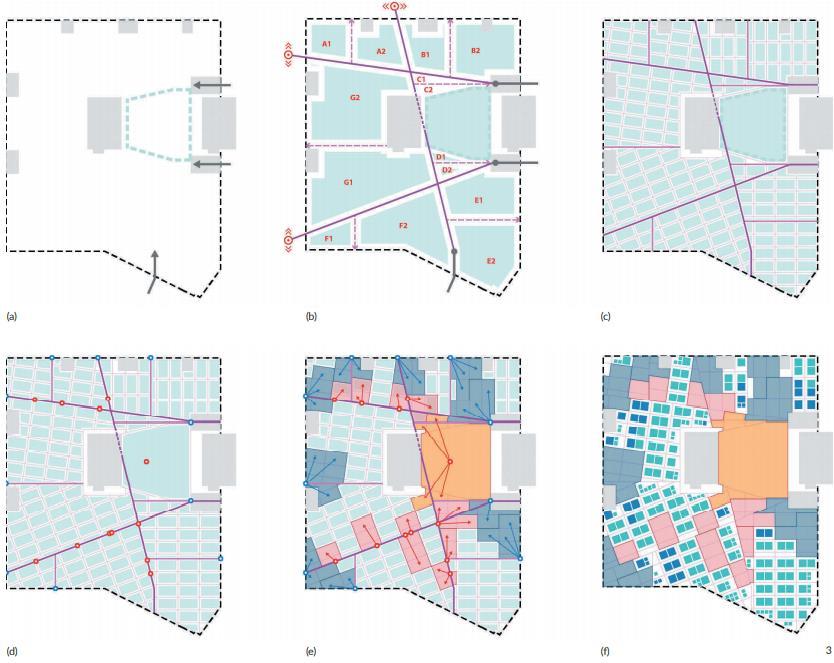
Figure 24: (a-f): Parametrization representation of actual project (Nagy, Villaggi, Zhao, & Benjamin, 2017)
41
GD - OPERATIONS
6.1.5 Generating options based on primary goals- Buzz and Exposure (input parameters)
The main objective of the design was to evenly distribute crowd. While high activity can be activating to attract visitors, from experience, it was agreed upon by the stakeholders that often congestion around F&B zones and amenities proves to be an inconvenience and causes disruption in the event. Measures were developed to efficiently map Buzz and exposure on the basis of past events.” Both metrics were calculated using a novel static graph-based simulation method.” (Nagy, Villaggi, Zhao, & Benjamin, 2017) The following images highlight how foot traffic was evenly distributed by buzz and exposure mapping. (Nagy, Villaggi, Zhao, & Benjamin, 2017)
42
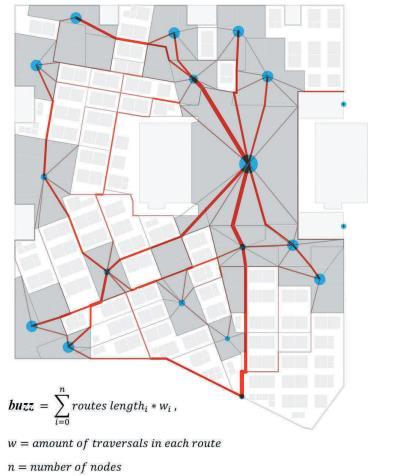
Figure 25:Buzz parameter considers the spatial distribution of high traffic areas in the plan (Nagy, Villaggi, Zhao, & Benjamin, 2017)
43
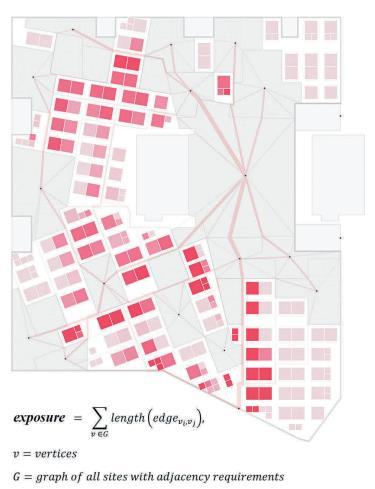
Figure 26:exposure parameter accounts for average foot traffic around each booth (Nagy, Villaggi, Zhao, & Benjamin, 2017)
After defining input parameters, guidelines need to be established to ensure that the algorithm yields good results. Without setting guidelines, there is no way to know that optimal designs are being generated by generative algorithm.
44
6.1.6 Evaluation of options-ensuring quality in quantity
The designers set two guidelines to ensure that algorithm produced desired results. These two guidelines were more like trade-offs between two extreme conditions. They believed that a good design lies somewhere between the extremes. (Nagy, Villaggi, Zhao, & Benjamin, 2017) 1. Bias versus variance
This guideline accounts for the scope of design. Any model which ispartialtowardsaparticularsolutiondefeatsthepurposeofiterative design approach and will end up giving too similar alternatives. Similarly, any model with a high variance produces meaningless designs which differ to the extent that same parameters cannot be used to judge the optimization in iterations. Thus, randomness in a model needs to be controlled as a good design will have characteristics of both- it will generate different options but the scope would be limited. Design options generated therefore have to different but should seem belonging to the same species. (Nagy, Villaggi, Zhao, & Benjamin, 2017)
2. Complexity vs. Continuity
This deals with the interaction of internal spaces and also compares input paramters to output design space metrics. Any generative algorithm should produce designs which are unpredictable, innovative and unconventional. But on the other hand, too much complexity can lead to inconsistency. Hence, design needs to accommodate unpredictability but maintain consistency in internal
spaces.
To achieve these, the designers used a low-resolution sampling model to run simulations for the placement of spaces with respect to each other. This was first done for the initial set of 3 parameters and then carried on with the second set for 22 parameters. The design spaces were ranked in terms of buzz. The simulation and plotting of spaces revealed that high and low scores were gradual in some zones
45
and abrupt in others. Thus, proved that the outcomes were produced complexities locally but maintained continuity as a whole.
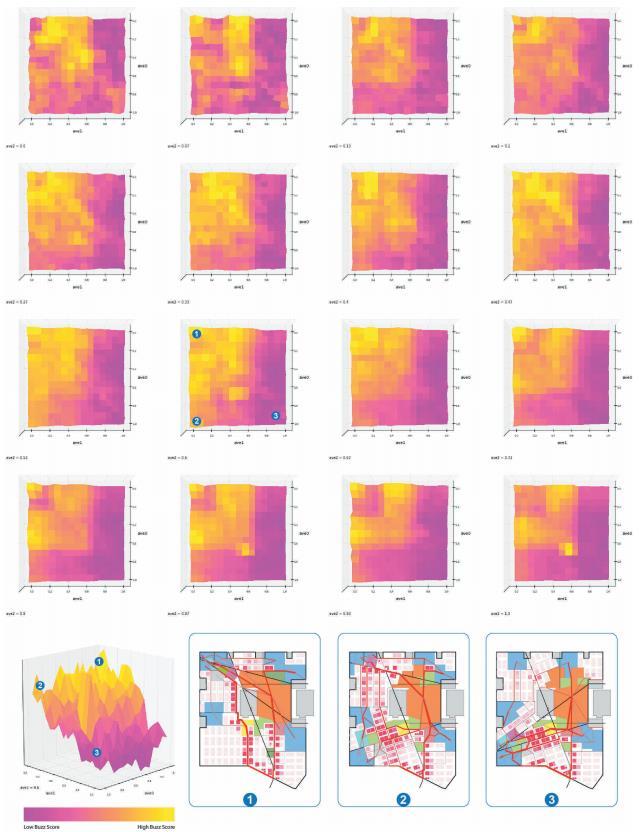
Figure 27:x and y axis represent buzz values; z axis shows their corresponding exposure models (Nagy, Villaggi, Zhao, & Benjamin, 2017)
46
POST GD OPERTIONS
6.1.7 Design Optimization- Ranking outcomes to understand the choice
This step involves using Generative Algorithm (GA) for finding optimal solutions. The computer generates random simulations initially and asks the user to rank them in order to understand the user’s preferences. On the basis of these preferences, the algorithm is run to discover suitable mutations.
Genetic algorithm, NSGA-II, was used with, second generation, 320 highest performing designs from the earlier stage. This gave an edge to the program and prevents it from wasting power on non-viable options. (Nagy, Villaggi, Zhao, & Benjamin, 2017) 20,480 designs were produced during analysis stage (represented in gray). It was narrowed down to 32,000 in the optimization stage (represented in cyan). During optimization, the algorithm improved on its results by crossing over different combinations of high functioning design options (represented in magenta). (Nagy, Villaggi, Zhao, & Benjamin, 2017) Out of these 38 options were presented to stakeholders and clients. These were all high performing designs and fulfilled the objectives and operated within the tradeoff guidelines.
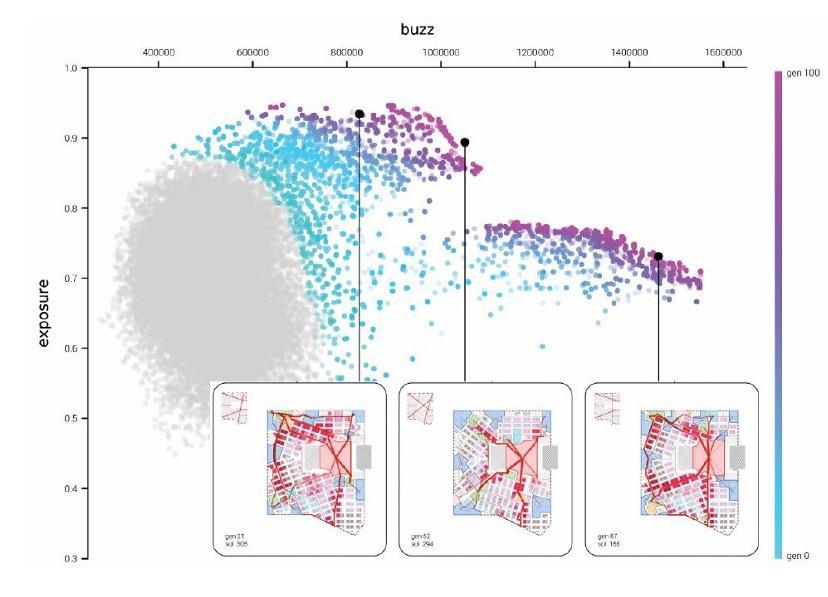
Fig 13: Design optimization and selection.
47
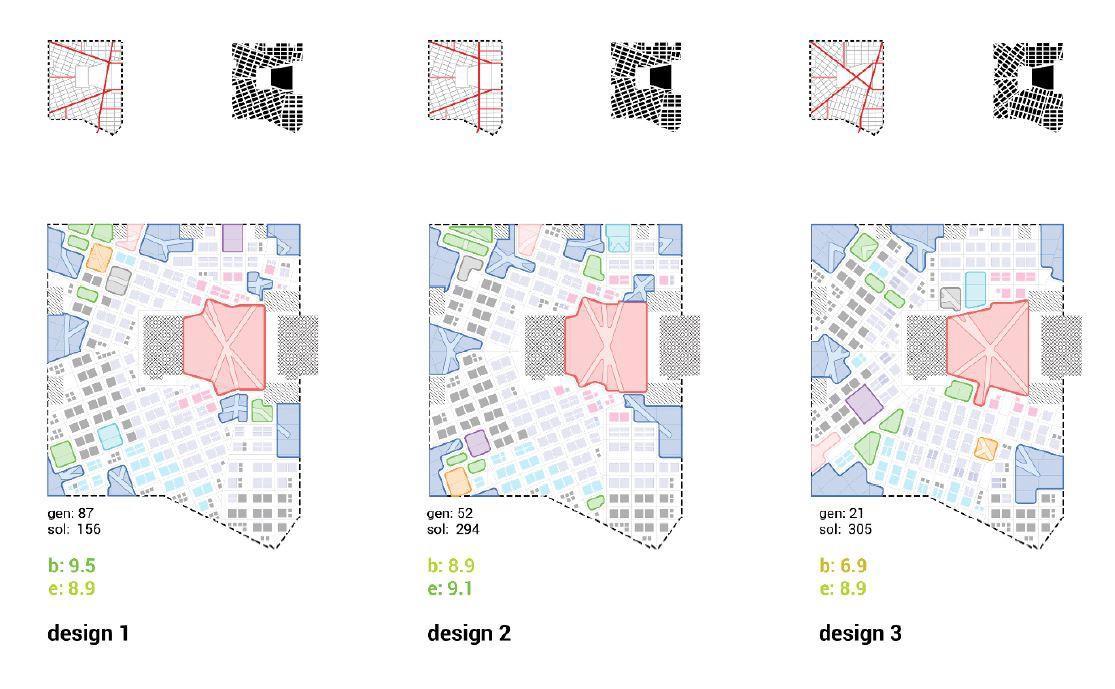
Figure 28:Three selected designs, refined manually to accommodate suggestions from stakeholders
6.1.8 Conclusion
Generative design served as a virtual assistant and helped complete months’ worth of work in a couple of weeks.
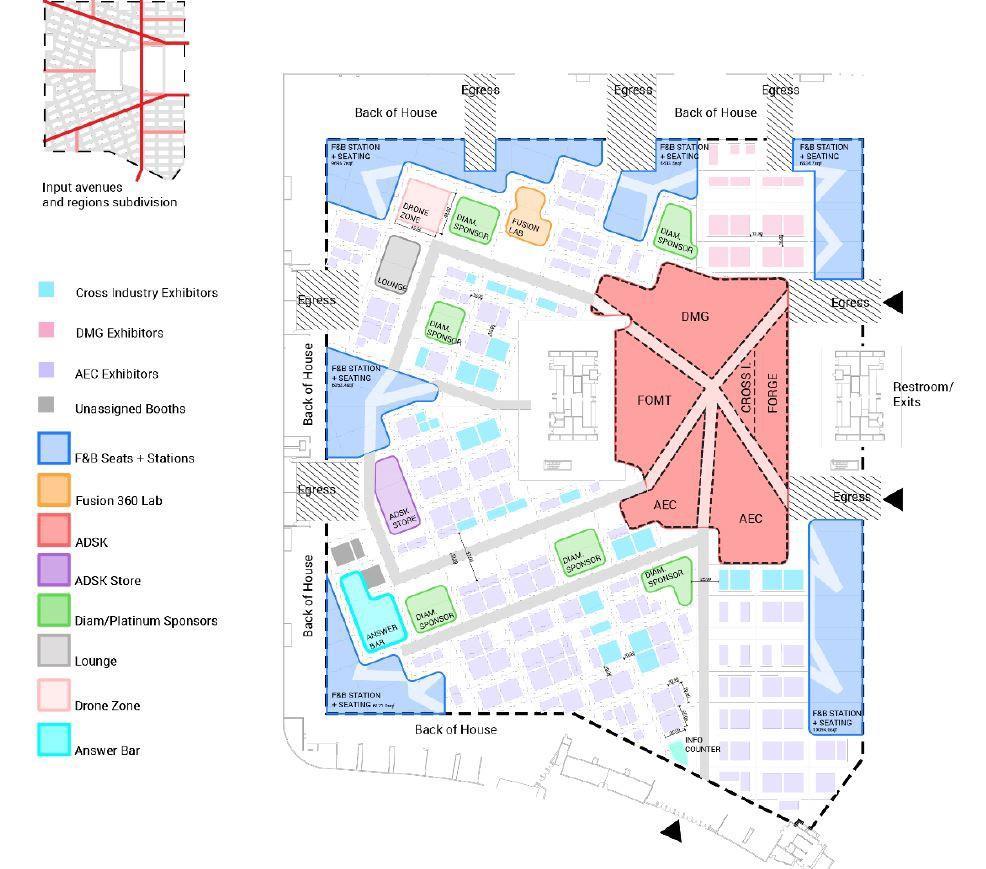
Figure 29:The finalized plan of the AU Exhibit Hall 2017
48
6.2 Autodesk MaRS Office, Toronto
Designed by: The Living
Autodesk used Project Discovery, a generative design tool, to design MaRS Office in Toronto. The project is a conglomeration of human and machine learning. The project is 60,000 sq feet in area which is distributed over three floors. (Archistar, n.d.) A similar process of Generate, Evaluate, Evolve and Refine has been used in this project as well.
Themainintentionofcitingthiscasestudyistoprovideself-explanatoryvisuals which outline the generative design process over the course of the project.
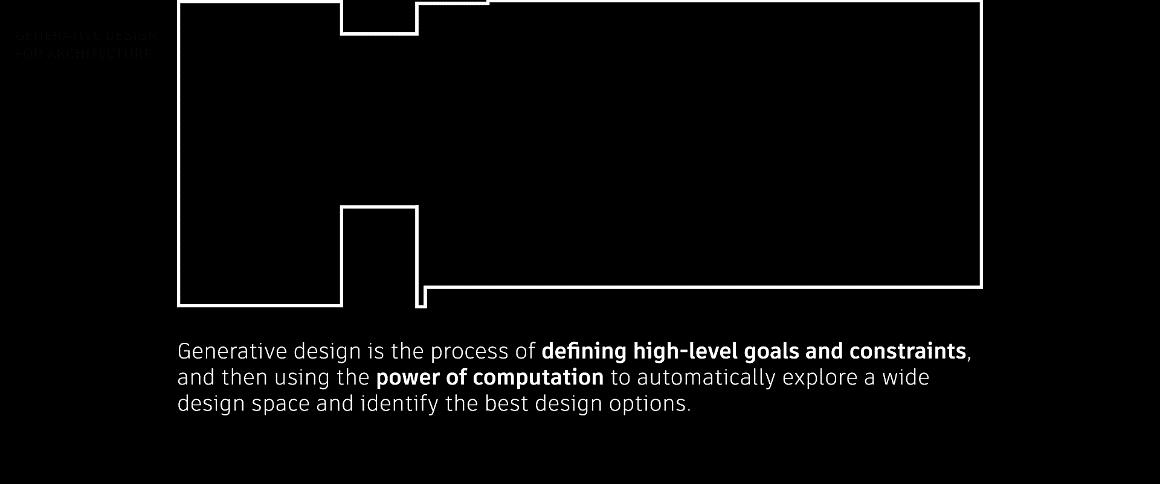
Figure 30:Defining the boundaries of design space (The Living, 2018)
The above picture highlights the first step in any GD process, i.e., defining the extents of a project or highlighting its boundary.
49
6.2.1 Data Collection and Analysis Stage
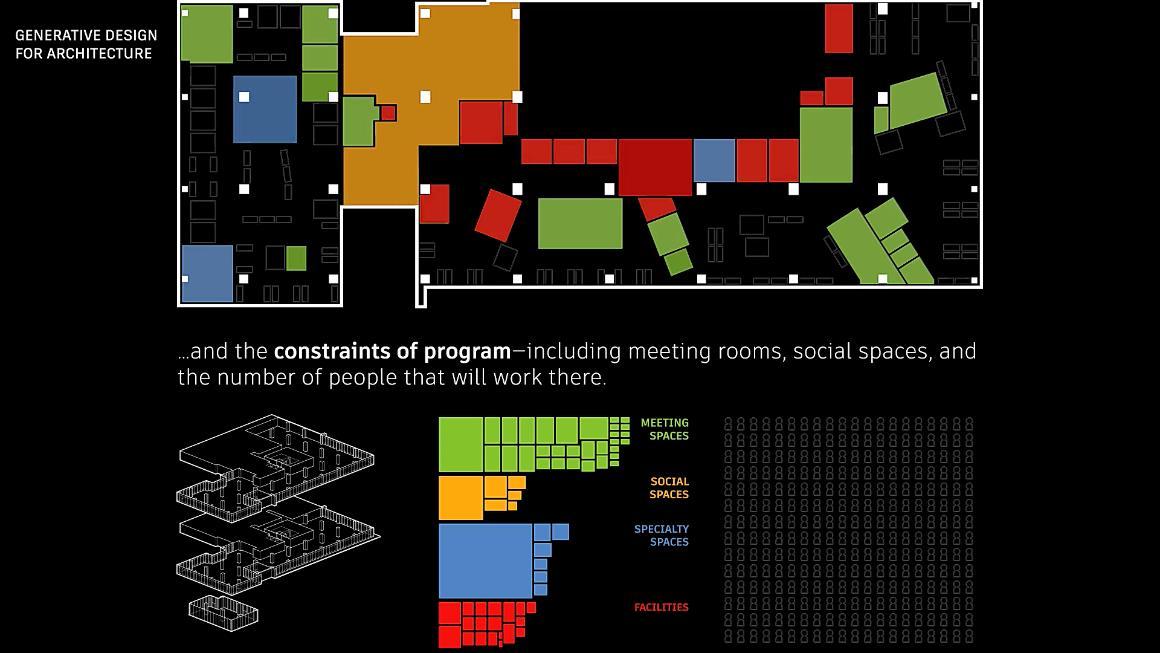
Figure 31:Identification and classification of design space requirements (The Living, 2018)
Data Collection was done to identify the type of spaces and compile an area analysis for the same.
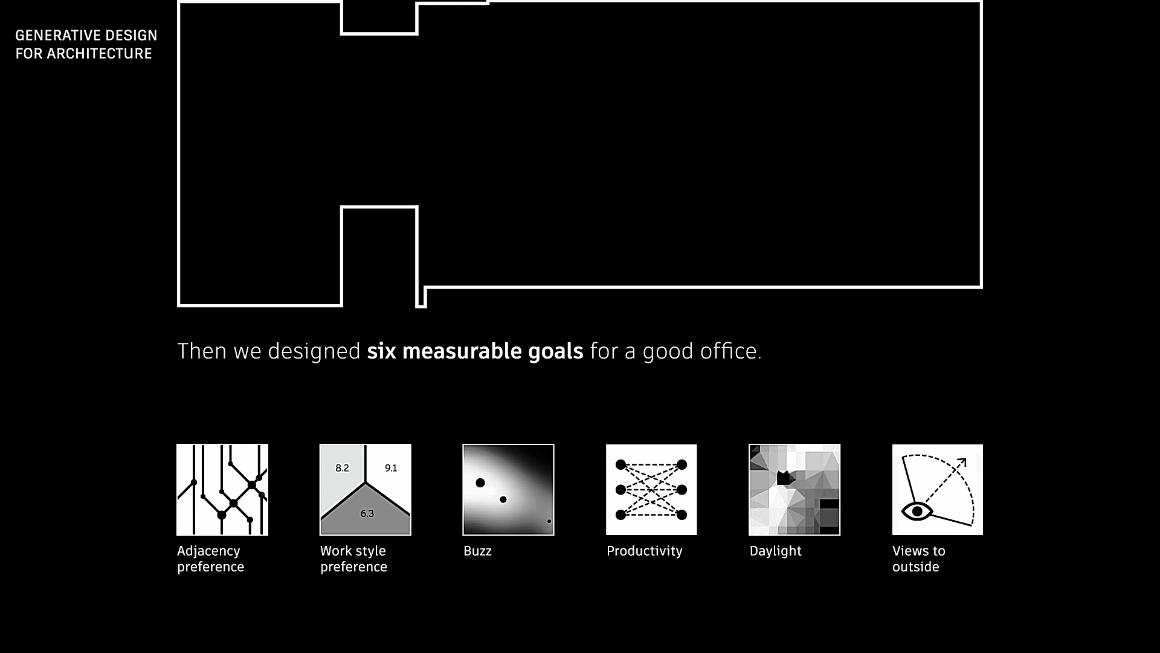
Figure 32:Goal formulation on the basis of parameters (The Living, 2018)
The designers took a survey of about 250 employees to derive the input paramters and objectives of the design problem.
50
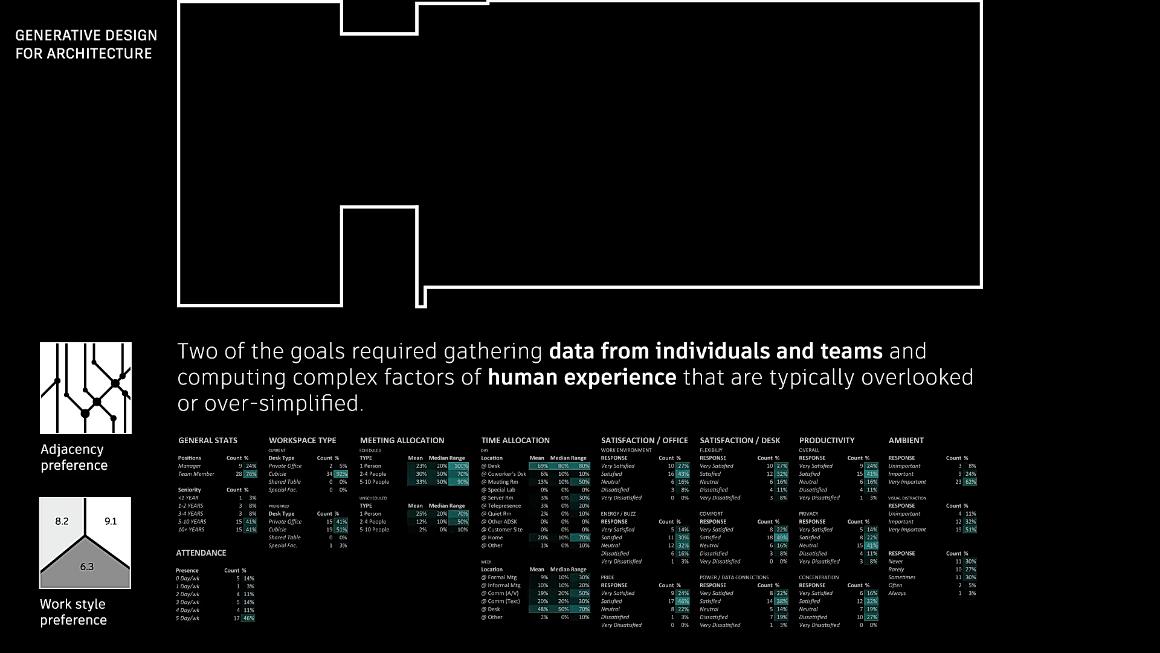
Figure 33:Prioritization of objectives. Setting up base objectives for running simulations. (The Living, 2018)
Among the six goals, two were prioritized over the rest. These two will be the part of the first set of algorithms used to run the simulation. The other set of algorithms will be used for design optimization and refining. The first set of algorithms were Adjacency preference and work style preference.
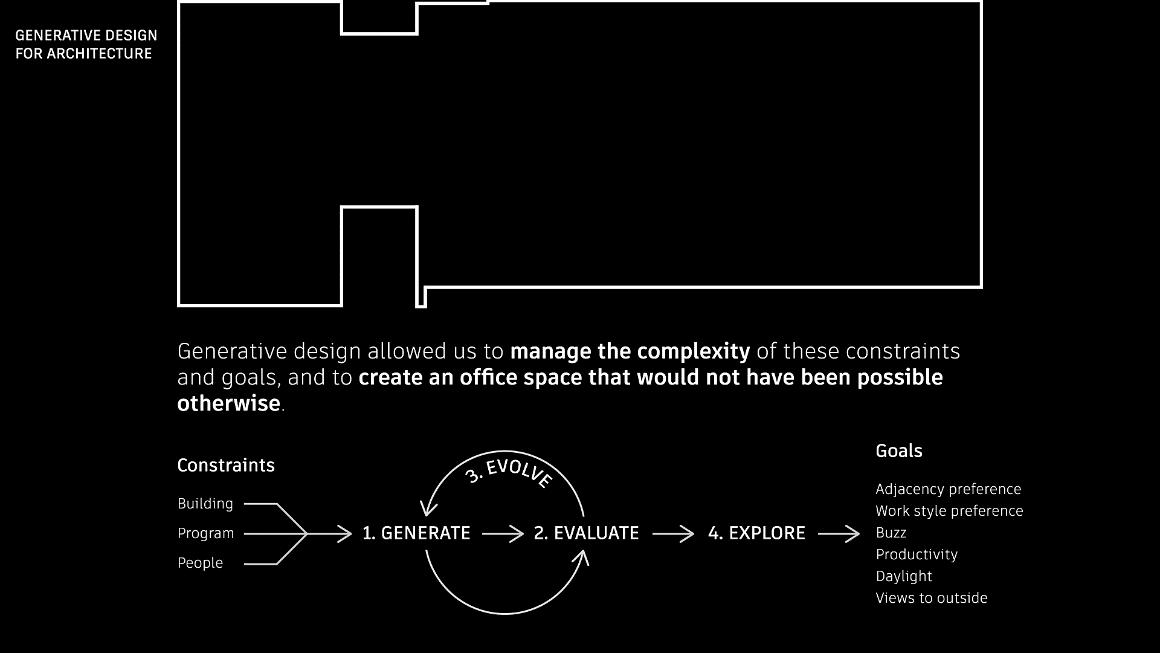
Figure 34:Flowchart of Generative Design Stages (The Living, 2018)
51


