Shamone Anglin
Word Count: 3,248
Business Analytics 22477327 L5 fashion Business & Management

This report analyses external factors that impact Barefoot’s financial and non-financial indicators. The conflict in Palestine can cause disruptions in the supply chain, the UK is also going through a cost-of-living crisis with inflation rates affecting consumer spending power (Edser, 2024) and the ignorance of politics at the Met Gala (Bramley, 2024). The porters five forces analysed the current jewellery market, and it is highly competitive with Pandora being a leading brand in the UK (Statista, 2024).
Analysis of the financial indicators demonstrates that Barefoot’s highest selling year is 2015 and their highest number of sales is £3,227,343. Charm bracelets are Barefoot’s highest selling product, but it costs them the most to sell, in addition to that, designer sunglasses had the highest profit margin. People that identify as female are Barefoot’s main consumer base accounting for 58% of their sales, but there are 10% unknown. Genderless jewellery is a growing trend and preferred by the current consumer base (Maguire, 2021). The most used channel to purchase is the Barefoot website at 54%. Debit/credit cards are the most used form of payment on Barefoot’s website; however, instalment payments and digital wallets are very popular (De Best, 2024).
The analysis of non-financial indicators highlights that Barefoot gained more than double customers from 2014-2016 using the RFM model and by 2019 more customers were spending more than £500. Customer churn shows that Barefoot has a high churn rate and only 8% continuing to make purchases with the brand from 2011 to 2019. The customer lifetime value identified that 377 customers bring the company a negative customer lifetime value.
The recommendations for Barefoot discuss customer retention strategies to improve their CRM through developing a loyalty program as well as improving their e-commerce strategy to adapt to the changing customer habits.
This report will analyse Barefoot’s data from 2011 to 2019, in sections of financial indicators and non-financial indicators. The financial indicators will focus on sales by year, sales by gender, sales by product, sales by channels and sales by payment method. The non-financial indicators will focus on RFM, customer churn and customer lifetime value. After the analysis of the dataset, there will be recommendations stated for Barefoot to increase their profits and customer retention. The jewellery market is highly competitive worldwide as it made a strong recovery after covid (Statista, 2023c), however consumers want genderless fashion (Maguire, 2021). Improving Barefoot’s CRM is vital as it encourages customers to shop with the brand more through rewarding them incentives (Linkedin, 2023), which is discussed further in the recommendations.
The ongoing genocide in Palestine has Rafah’s medical facilities overwhelmed (Gritten, 2024) with Israel’s attack on the safe zone of the Gaza strip. More than a million people sheltering in Rafah are at risk of being deprived healthcare as the Israeli advance has cut off access to a nearby European Gaza Hospital (Gritten, 2024). The closure of the Rafah crossing with Egypt has caused patients that need to be sent abroad for medical treatment to be stranded (Gritten, 2024). The WHO (World Health Organization) has stated that all hospitals in Rafah will have to halt services soon unless they receive deliveries of fuel in the next few days (Gritten, 2024). The conflict between Israel and Palestine can impact the fashion industry’s supply chain.
According to Edser (2024), the UK has emerged from being in recession with an economy growth of 0.6% between January and March, which is the fastest rate for two years. The growth earlier in the year was led by services such as hospitality, arts, and entertainment as well as the early easter in March (Edser, 2024). However, interest rates are at their highest for 16 years and mortgage rates are rising in the recent weeks, so people are paying more to borrow money. Additionally, many people may not feel any better due to inflation rates, therefore the growth per head is still 0.7% lower than a year ago (Edser, 2024). The recession was partly caused by people spending less due to the inflated cost of living as well as higher interest rates pushing up mortgage costs, but the UK is expected to see steady growth throughout the year (Edser, 2024).
Inflation has decreased since 2021 with prices in the UK increased by 3.2% as of March 2024, however it is above the Bank of England’s target of 2% (BBC, 2024). The reason inflation rates in March was due to a drop in price for food items like meat, crumpets and chocolate biscuits (BBC, 2024) as the basket of goods is updated regularly to reflect current shopping trends (BBC, 2024). Furthermore, the overall cause of the UK’s recent high inflation is due to the soaring food and energy bills especially after the Covid pandemic oil and gas were in greater demand (BBC, 2024). The bank of England stated that within a few months’ inflation will fall close to their target level and the first-rate cut will be determined by upcoming employment and inflation figures (Edser, 2024). Inflation has remained high because of worker shortages have made it more expensive for companies to find and keep staff as well as wage growth is rising faster than the rising prices but pay is not (BBC, 2024). Regarding inflation pay has gone up by 1.9% in 2024 (BBC, 2024).
There have been many protests going on across the world addressing a variety of political and social issues, however the most important protest currently is calling for a ceasefire in Palestine. The Met Gala is one of the biggest events in the fashion industry, however this year it felt dystopian (Bramley, 2024) amongst viewers due to its ignorance of the conflict in Gaza. There were pro-Palestinian protests a few blocks away from the venue and with many celebrities and fashion houses attending the event there were no political statement to be seen (Bramley, 2024). However, previous Met Galas have not been devoid of politics, because in 2021 the Congresswoman Alexendria Ocasio-Cortez wore a dress that said, ‘Tax the Rich’ and in 2018, Lena Waithe wore a rainbow cape (Bramley, 2024). Considering the fashion industry and culture is inherently political, the Met Gala is an event that celebrates the art of fashion, and it is a missed opportunity for no statement about Gaza to be made (Bramley, 2024). An event that is apolitical being the Met Gala feels out of touch in the social media age (Bramley, 2024) and has eerily similar atmosphere to the Hunger Games series.
The threat of substitution for Barefoot is high because within the jewellery industry consumers will substitute a brand based on whether they are purchasing artificial or stone jewellery; additionally, if the jewellery is not aesthetically pleasing to the consumer they will substitute for another brand.
Barefoot is a valued brand alongside their competitors Pandora and Chanel, therefore the buyer had a medium amount of power to demand certain styles or artisanry. In addition to that, the buyer has low power in the jewellery industry because the products are made to fit the company’s aesthetic, budget, and suppliers, so not many brands will adhere to consumer demands.
Within the jewellery industry, suppliers have low power because they have less control over the price of manufacturing, and they have weak negotiating power. This is likely due to the type of materials used to make the products, therefore depending on what type of material is used they do not pose a threat to Barefoot.
The Jewellery market is highly competitive with a mix of luxury and high-street retailers gaining market share. Pandora is the leading jewellery brand in the UK based on brand awareness at 90% (Statista, 2024) and garnering 28,136 million Danish kroner worldwide in revenue in 2023 (Statista, 2023c), which is approximately 3.243 billion British Pounds (XE, 2024). The second leading brand in the UK is Chanel at 89% (Statista, 2024). In 2022, the Richemont group had the highest market share in the luxury watches and jewellery market at 27% (Statista Market Insights, 2023).
There is a high threat of entrants because e-commerce growth is so rapid, there are online brands being launched every day. In 2024, the fashion e-commerce market worldwide is predicted to grow to 907 billion USD (Statista, 2023b). The accessories sector is forecasted to reach 195,503.64 million USD and since 2023 the online fashion retail change has been increasing past 0% nearing 13% for 2024 (Statista, 2023b).
Source: (Author, 2024)
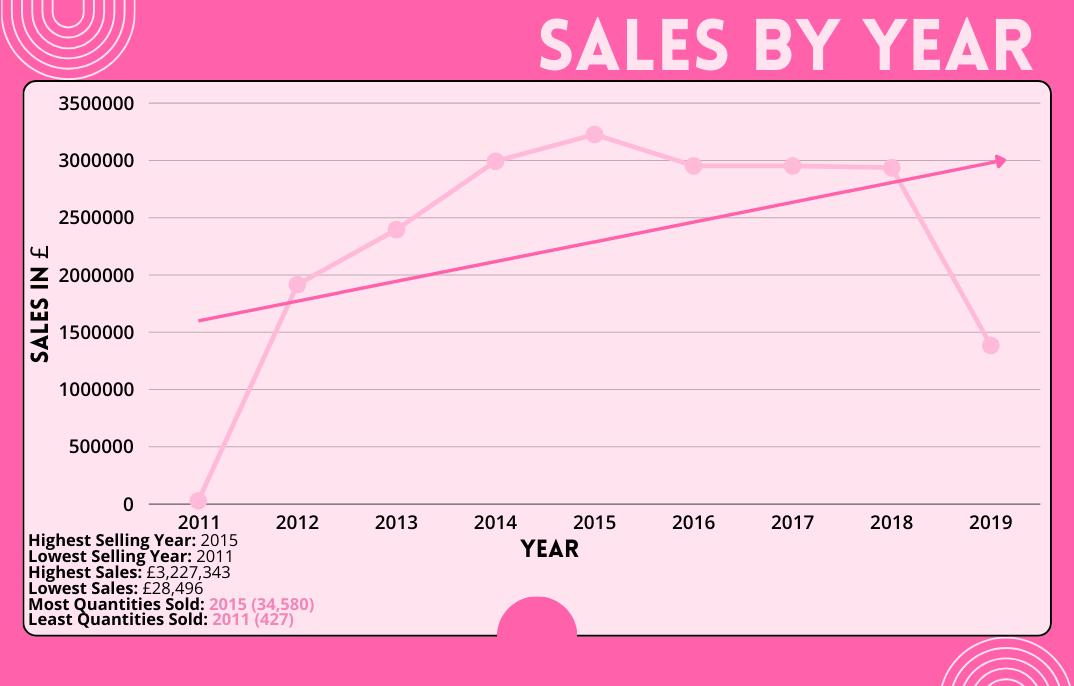
Figure 2.1 shows that Barefoot experienced a large initial growth whilst the company was starting out between 2011 and 2012, with sales growing from £28,496 to £1,916,534 in a span of a year. In addition to that, their quantities went from 427 in 2011 to 23,631 in 2012. Having a successful first year in sales, is beneficial to Barefoot because it proves to their investors and potential investors that their business model is effective, and they can put the money back into their business to grow further. Barefoot’s sales reached its peak in 2015 with their highest revenue at £3,227,343 million and in 2019 they had a huge decline to £1,384,774. This rapid decline is likely because of the Covid-19 pandemic as this was a major external factor that affected all businesses worldwide, the fashion segment made a revenue of 0.54 trillion USD (Statista, 2023b), due to consumers’ household spending falling to 22.2% in early 2020 (Lee et al., 2022). In addition to that, Barefoot’s dataset has limitations because it ends in 2019, therefore it cannot be analysed if the company recovered after the pandemic. The jewellery industry took a big hit from covid with their revenue decreasing from 281.16 billion USD in 2019 to 251.7 billion USD in 2020 (Statista, 2023c), however the industry is currently garnering a revenue of 310.88 billion USD (Statista, 2023c). With the jewellery industry at a steady growth and full recovery from the pandemic, Barefoot can tap into this to achieve sales as high as 2015 in figure 2.1.
In figure 3.1 it shows Barefoot’s sales by gender in percentages as well as the number of sales, the quantity of products purchased and the highest selling product category. Barefoot’s consumers are mostly female as they contribute 58% to the company’s sales making them £12,038,090 from 2011 to 2019. Female consumers shopped more online in 2021 with 68.2% shopping for bags & accessories compared to males at 31.8% (Statista Market Insights, 2021), this comparison shows that Barefoot’s sales share by gender is on track. However, this data does not include consumers that do not identify as male or female or consumers that do not want to disclose their gender, therefore Barefoot’s remaining 42% that do not identify as female is larger than the 31.8% of UK shoppers (Statista Market Insights, 2021). Genderless jewellery and fashion are a growing trend and market in the industry, as Gen Z are becoming the largest group of consumers and about 25% of them expect their gender identity to change during their lifetime (Maguire, 2021). In addition to that, customer shopping habits have shifted since the pandemic that brands need to adapt (Maguire, 2021) and 31% of British consumers already purchasing outside of their gender identity (James, 2023). Therefore, it is important that Barefoot cater to these consumers for future launches as they may become their most predominant shoppers.
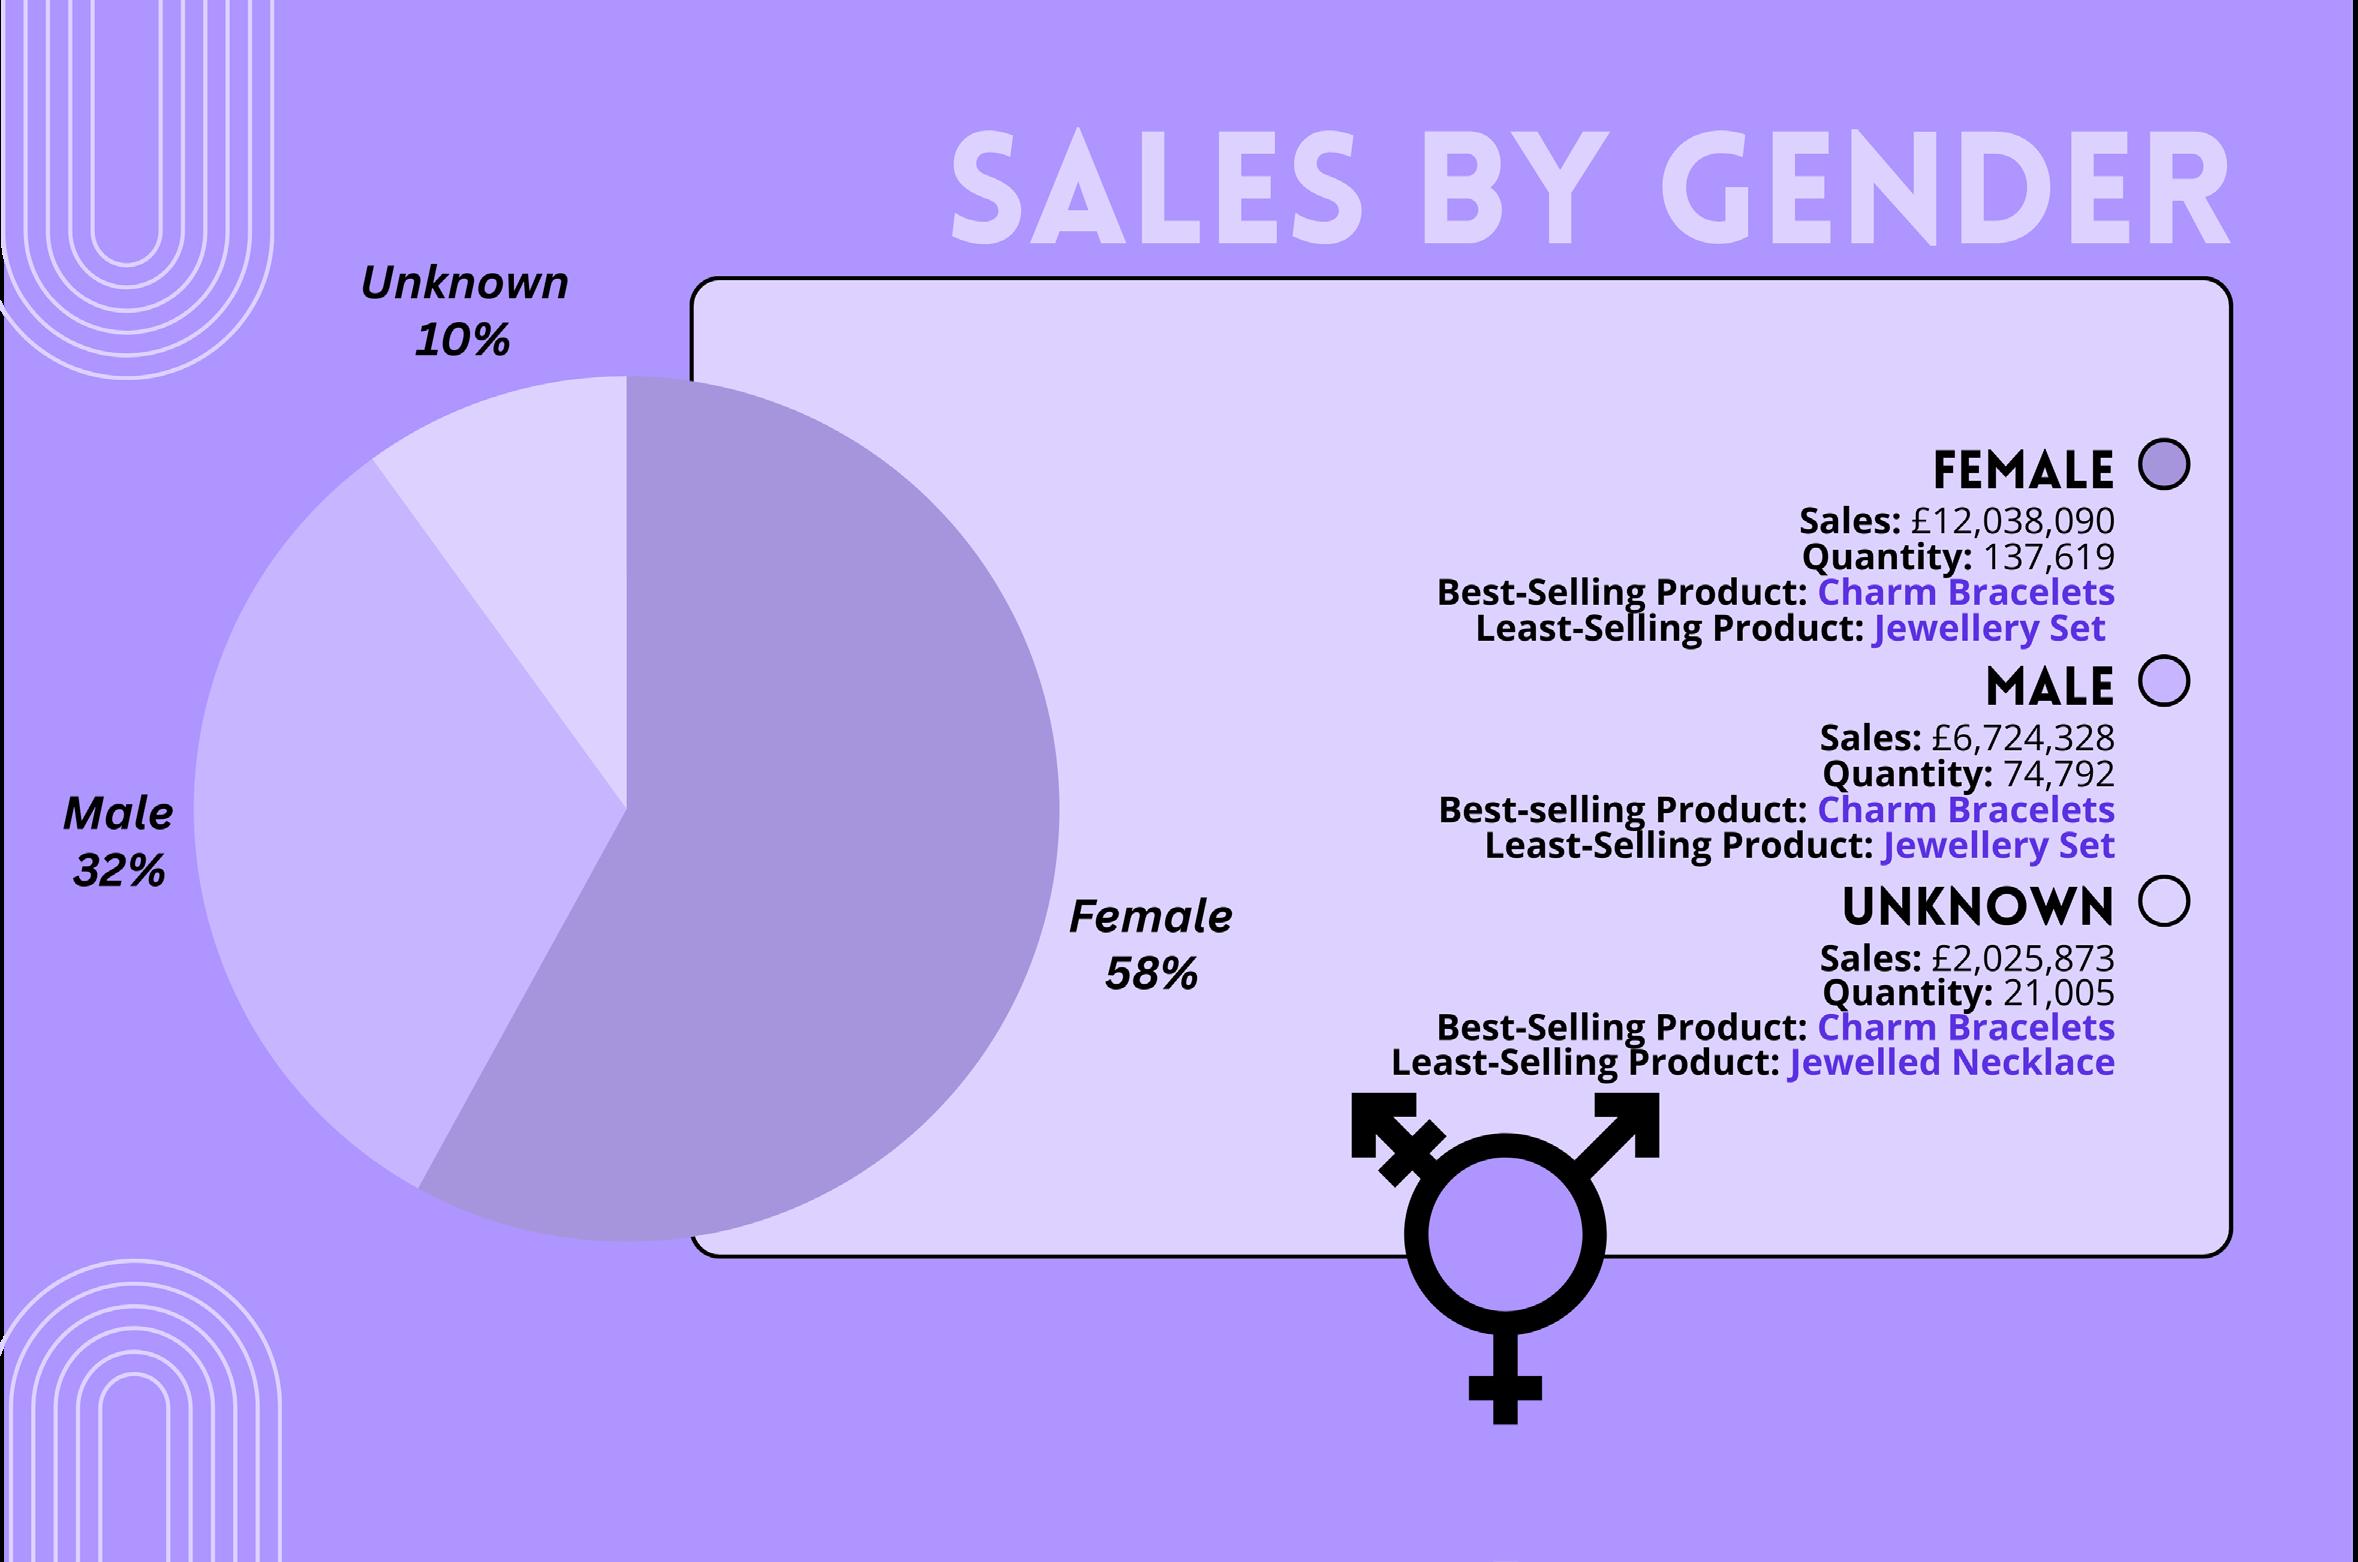 Figure 2.1: Sales By Year Line Graph Analysis
Source: (Author, 2024)
Figure 3.1: Sales By Gender Pie Chart Analysis
Source: (Author, 2024)
Figure 2.1: Sales By Year Line Graph Analysis
Source: (Author, 2024)
Figure 3.1: Sales By Gender Pie Chart Analysis
Source: (Author, 2024)
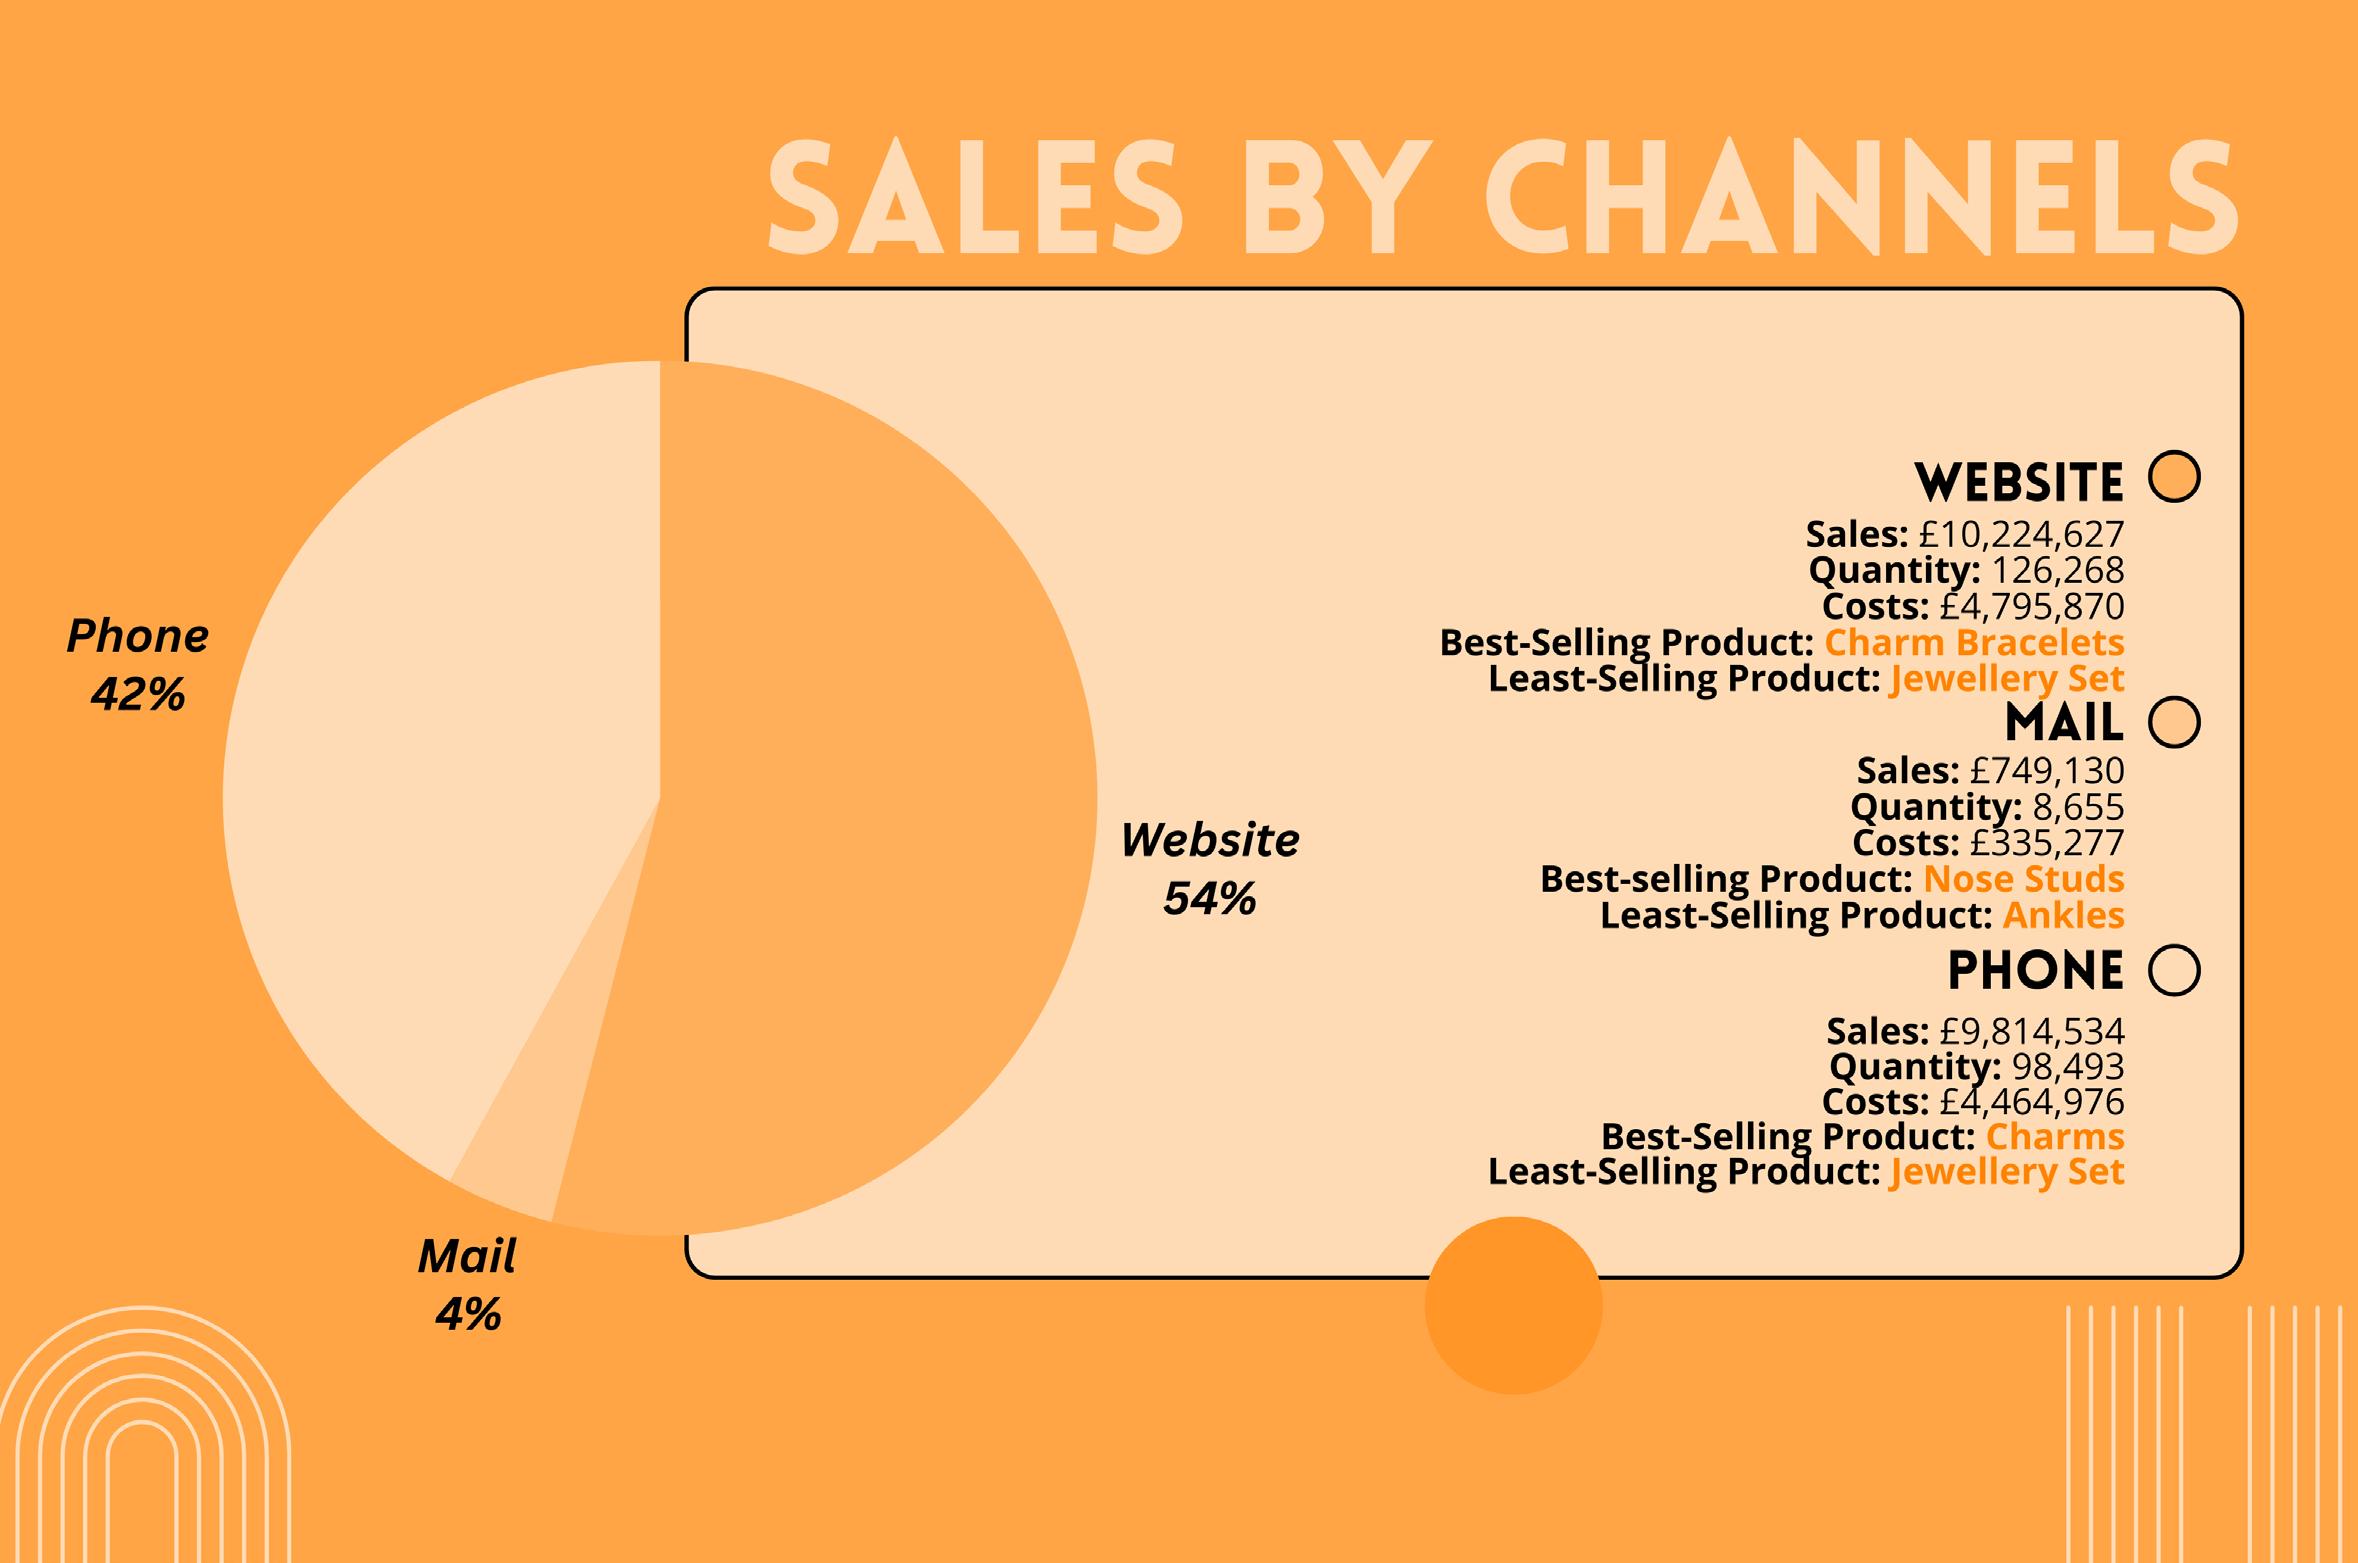
Figure 4.1 demonstrates that majority of Barefoot’s consumers complete their purchase through their website making up 54% of their sales at £10.22 million GBP from this channel alone over the years. Furthermore, Barefoot have made profit as they made approximately £6 million more than the costs; in addition to that, through their website channel they have had 126,268 purchases. However, consumers are purchasing majority of their jewellery offline with only 34.1% completing their purchase through e-commerce (Statista Market Insights, 2024). This figure is predicted to grow over the years to 45.4% by 2029 (Statista Market Insights, 2024), therefore Barefoot should invest in developing their e-commerce strategy further by ensuring all its online capabilities are used to grow with the changing consumer habits rather than investing further into the mail channel.
Mobile purchases had the second most purchases making up 42% of their sales and bringing in £9.8 million GBP. In 2024, 62.1% of users that shop for jewellery online do so through their mobiles and in comparison, to desktop users they are rapidly growing (Statista Market Insights, 2024). Barefoot can capitalise on these channels to generate more revenue through creating a mobile app for their brand to make it more accessible for their consumers to shop and continue to generate revenue.
Source: (Author, 2024)
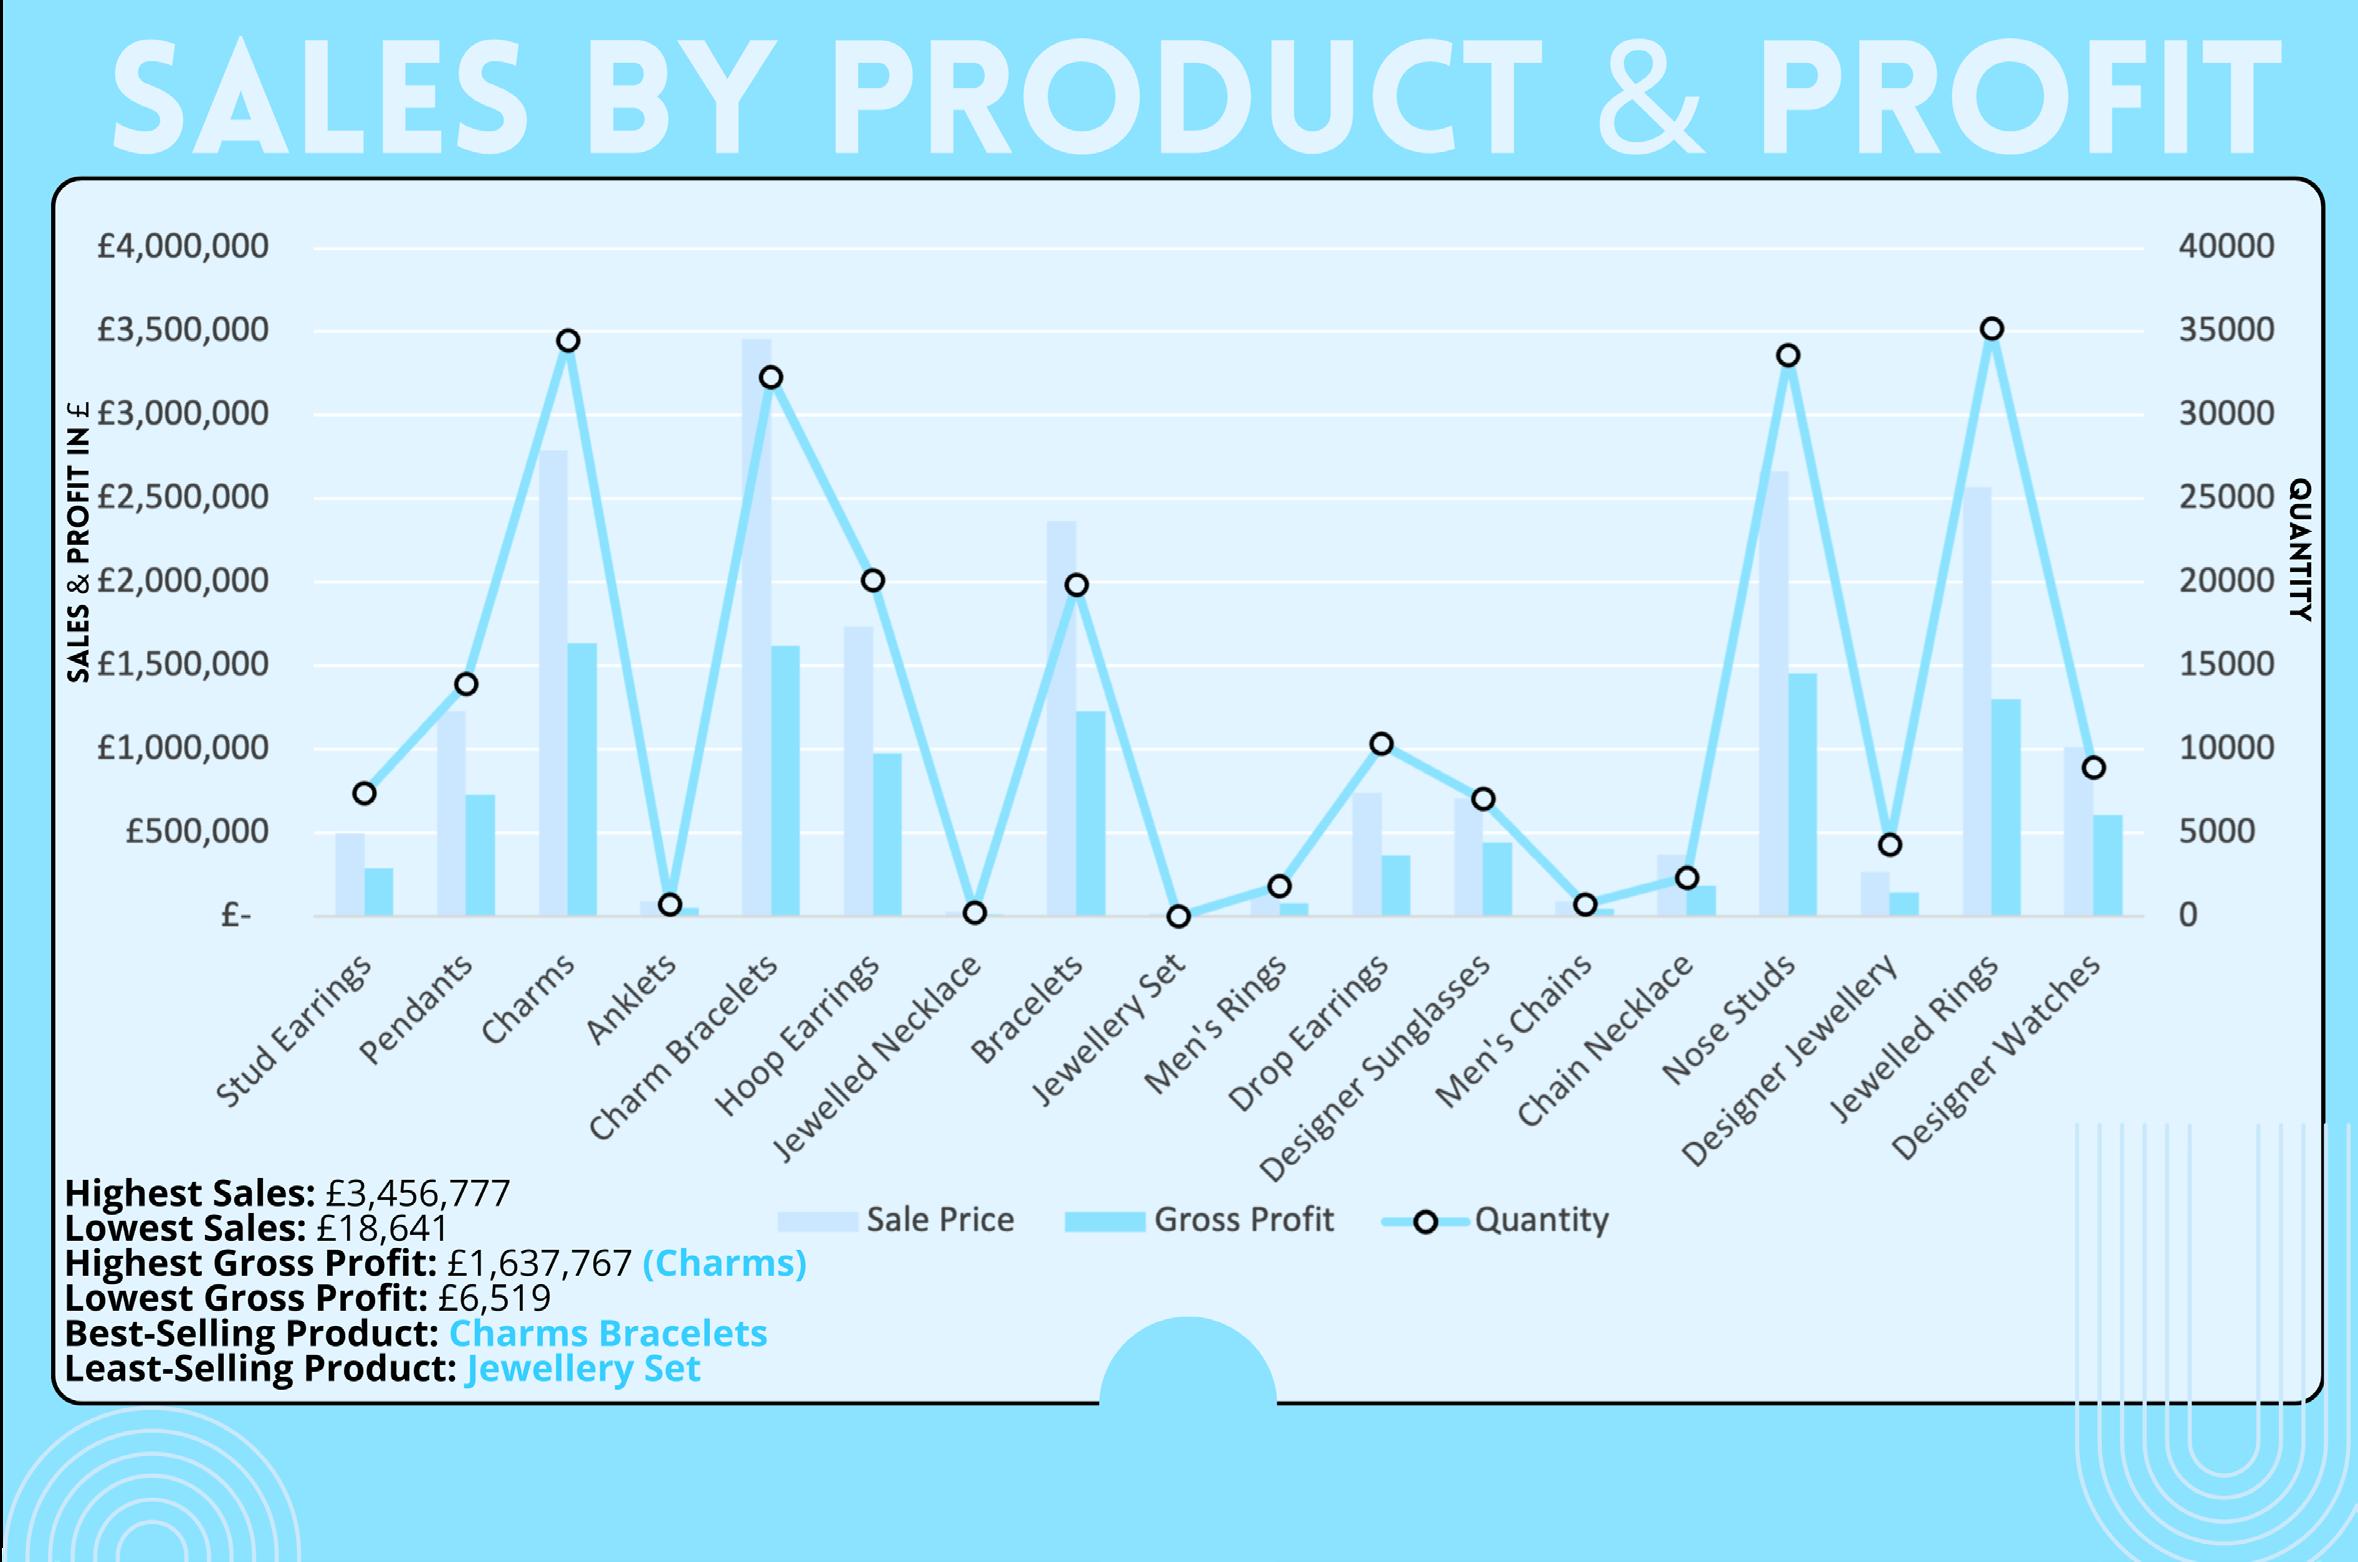
In figure 5.1 the best-selling products are charms, chain necklaces and charm bracelets and they had the highest gross profit, but charm bracelets garnered the most sales with £3.45 million GBP making it the best-selling product form Barefoot. The least selling product is the jewellery set garnering only £6,519 sales and costing the brand £12,122. The average selling price for this item £1,243 and it has the lowest profit margin of 35%, Barefoot should adjust the pricing of this item or invest in a cheaper alternative. The overall cost value of charm bracelets is £1,839,627 and for Barefoot to purchase one charm bracelet it costs them £56.94, however the average selling price is £107, therefore the company is making £50.06 per product. This gives their best-selling product one of the lowest profit margins at 47%. It is recommended that Barefoot increase the selling price of this product to increase its profit margin.
The product with the highest profit margin is designer sunglasses at 63% which costs the brand £37.18 and Barefoot sells them for £100 making them £705,991 in sales overall. Luxury eyewear market is projected to reach £1.71 billion in 2024 and by 2029 it will reach £2.29 billion (Statista Market Forecast, 2024); therefore, it is beneficial for Barefoot to invest in this market to increase their profit margins and revenue further. In addition to that, Barefoot should consider discontinuing their lowest selling products such as jewellery sets and jewelled necklaces to create more budget for better product investments.
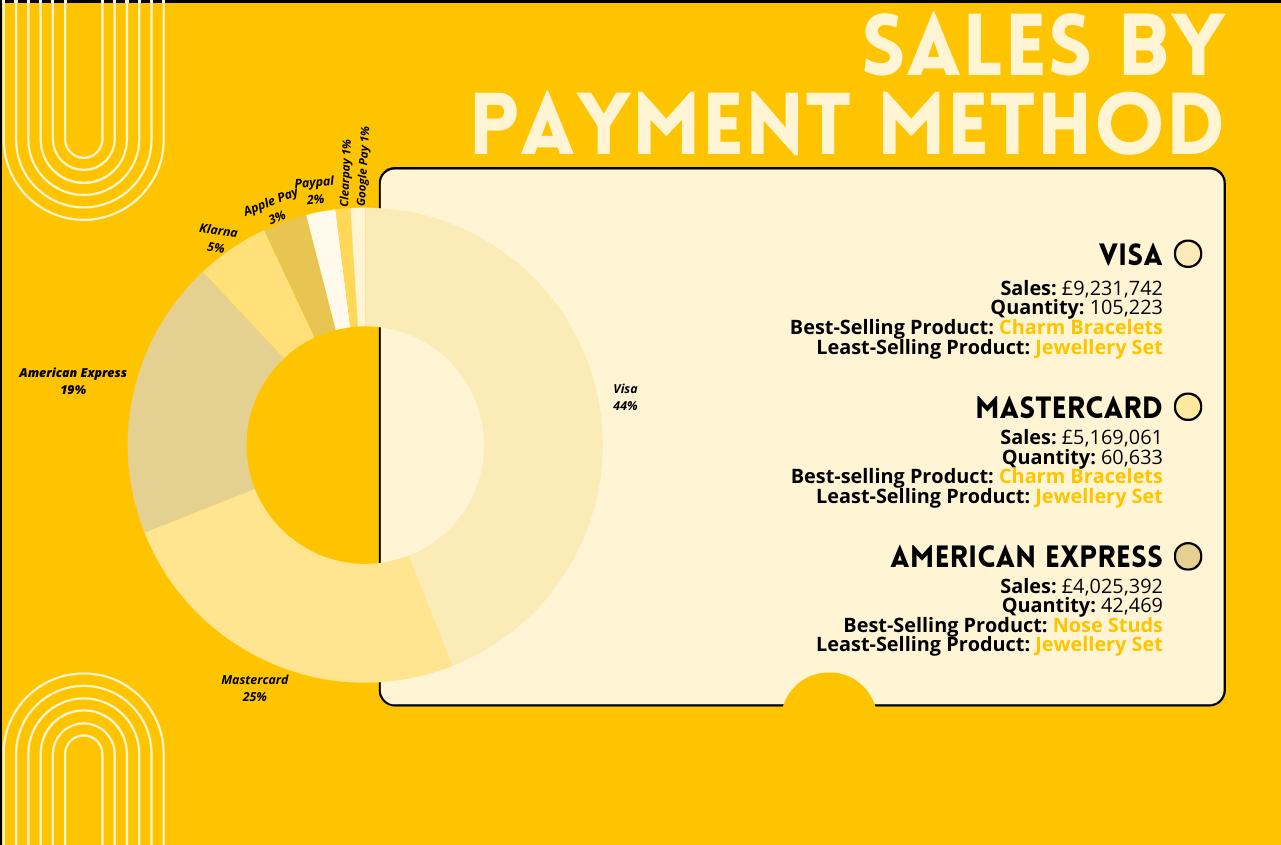
Figure 4.1: Sales By Channel Pie Chart Analysis Figure 5.1: Sales By Product & Profit Coloumn Chart AnalysisThe most used payment method from Barefoot’s consumers is Visa payment as it generated 44% of the company’s revenue over the years making them £9,231,742. The best-selling product was purchased mostly using the Visa card payment method with £1.5 million of its sales generated and the least-selling product majorly sold £7,150 using a Visa card. The least used payment method was Google Pay at less than 1%, generating only £74,942 over the years and the products that were purchased the least using this payment were jewelled necklaces and jewellery set with zero purchases. The top three payment methods were from credit/bank cards from the consumers’ current bank as of 2023, this payment method is 22% of transactions generated within e-commerce and digital wallets such as apple pay or google pay are the most common use of payment accounting for 50% of transactions globally (De Best, 2024). Barefoot should improve their purchase stage for consumers to ensure that they are making it accessible for customers to use digital wallets to make their purchases as this makes the checkout process speedier and more efficient.
Source: (Author, 2024)
A growing payment method Barefoot’s consumers are using is Klarna, which generated 5% of their sales and bought in £1,047,513 over the years. Klarna was founded in 2005 (Klarna, 2023) is used to allow customers flexibility to make purchases in three instalments every 30-days or pay the amount within 30 days and still receive their orders as per usual (Klarna UK, 2024). In addition to this type of payment method, Clearpay has a similar service, but you pay the money back in four instalments over six weeks compared to Klarna’s flexibility and they weren’t as well-known as they were founded in 2017 (CBInsights, 2024) causing them to only generate 1% of Barefoot’s sales. Moreover, Klarna was used mostly to purchase charm bracelets, which is one of Barefoot’s most expensive items generating £164,681.
 Figure 6.1: Sales By Payment Method Pie Chart Analysis
Figure 7.1: RFM Model of Barefoot’s Dataset from 2011-2019
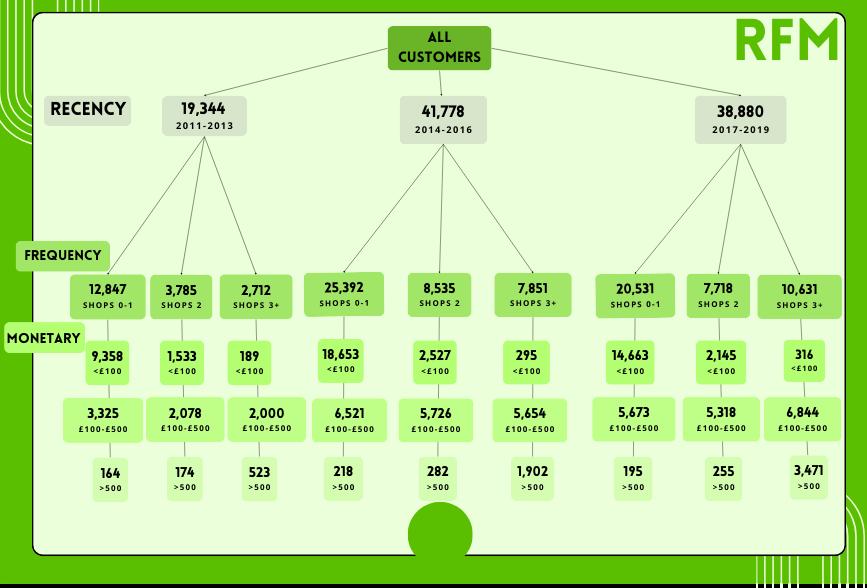
The RFM model on all Barefoot’s customers ranging from 2011-2019, analysis the customers purchasing behaviours and habits (Murp hy, 2022). This will help Barefoot to identify which customers are high-monetary value and to prioritise them in future strategies.
The recency in figure 7.1 demonstrates that in 2011-2013, when the brand was starting up, they had 19,344 customers and then they experienced a sudden growth. The company was reaching their peak sales during the period of 2014-2016 as they gained more than double their consumers, but this declined by almost 3,000 customers from 2017-2019. It can be interpreted that Barefoot started to gain a loyal consumer base by 2019, as the frequency in purchases became larger and more c ustomers were purchasing more than £500. For an example, in 2011 recency they had 2,712 customers shop with their brand 3 or more times and of those customers at the monetary level only 523 bought items that were £500 or more compared to the 2019 recency, where 3,471 customers are spending more than £500. Therefore, Barefoot should target these consumers when marketing products and to generate sales through a loyalty program.
However, Barefoot still have many customers that shop with them once 20,531 to be exact, even though this is gradually declining as of 2019, it is still an issue for the company to consider when investing in their outreach and marketing strategies. This is because majority of them spent less than £100 and it would b e a waste of Barefoot’s budget to frequently target these consumers rather than investing more in their loyal shoppers.
Source: (Author, 2024)
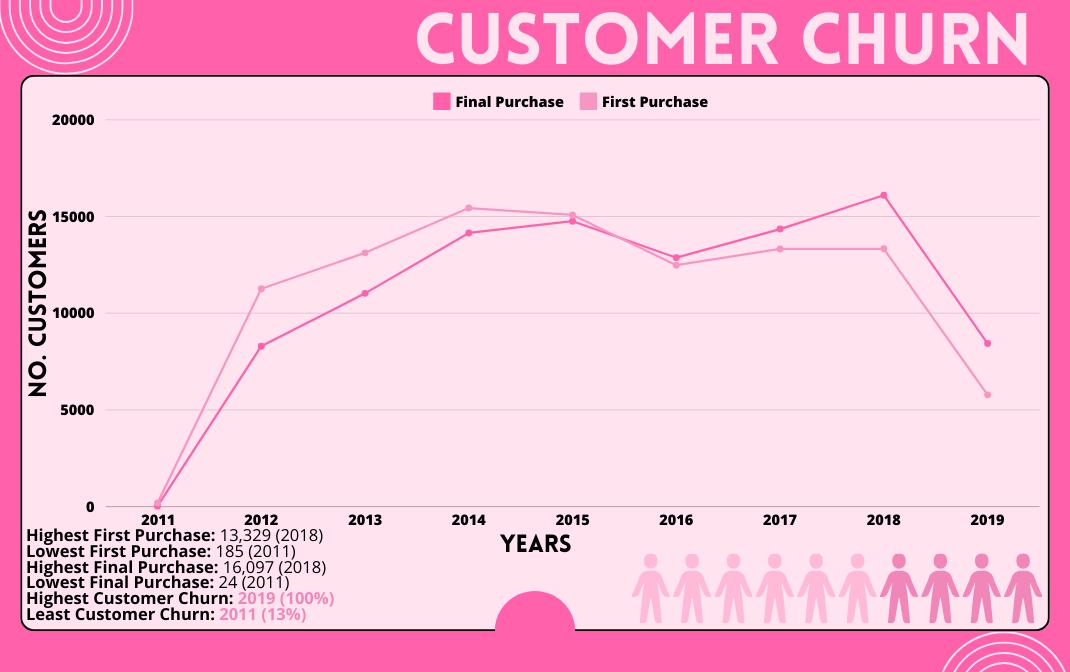
Barefoot’s customer churn suggests that they start the year with a high number of customers, because in 2012 they started with 73% of customers, this suggests that when the company started out in 2011, they had a successful business model and strategy to acquire new customers at the start of every year up until 2019. However, this strategy isn’t maintained or effective throughout the year, because Barefoot quickly lose their customers on year-on-year basis. The churn rate highlights that only 8% of customers have been retained by the end of the year. Nevertheless, this continues to shrink to 2% between 2012-2015 with a gradual increase to 6% by 2018. Furthermore, as shown in figure 8.2, Barefoot has a high churn rate from 2012 onwards as they lost 94% of their customers in 2018 and only 6% continuing to purchase with the brand in 2019. This demonstrates that Barefoot needs to improve their customer retention strategy and lower their churn rate to increase their sales. Additionally, figure 8.1 shows that Barefoot acquired the most customers in 2018 as they had the highest first purchases of 13,329 and in combination with the RFM in figure 7.1, these customers likely shopped once with the brand because the highest final purchase is also in 2018.
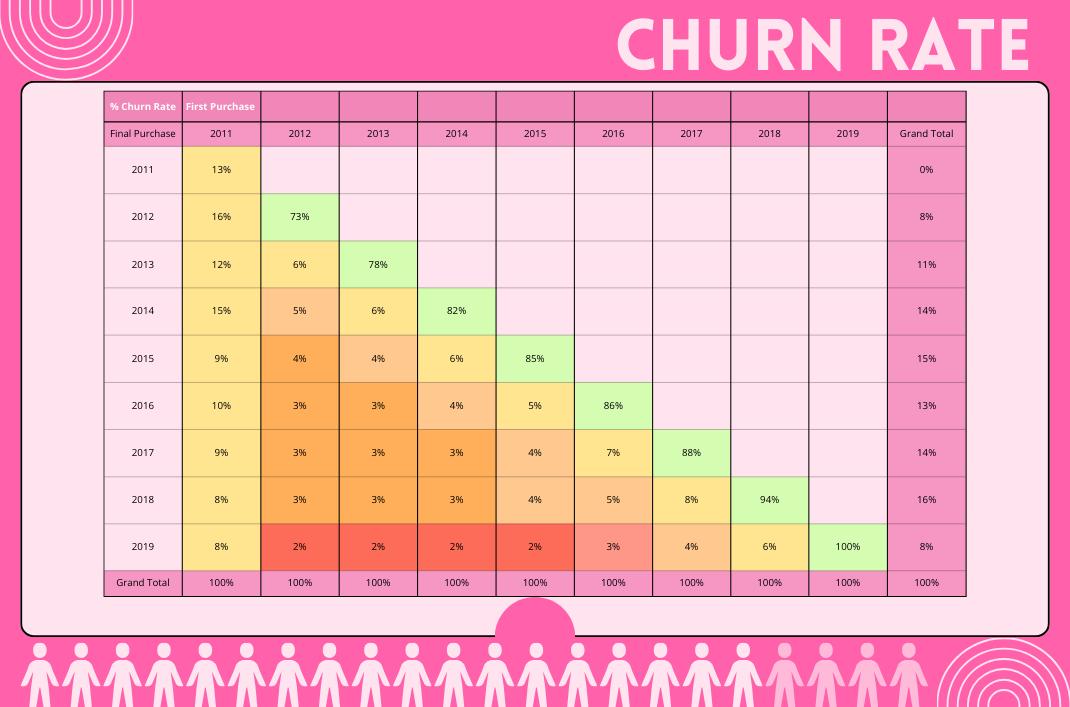

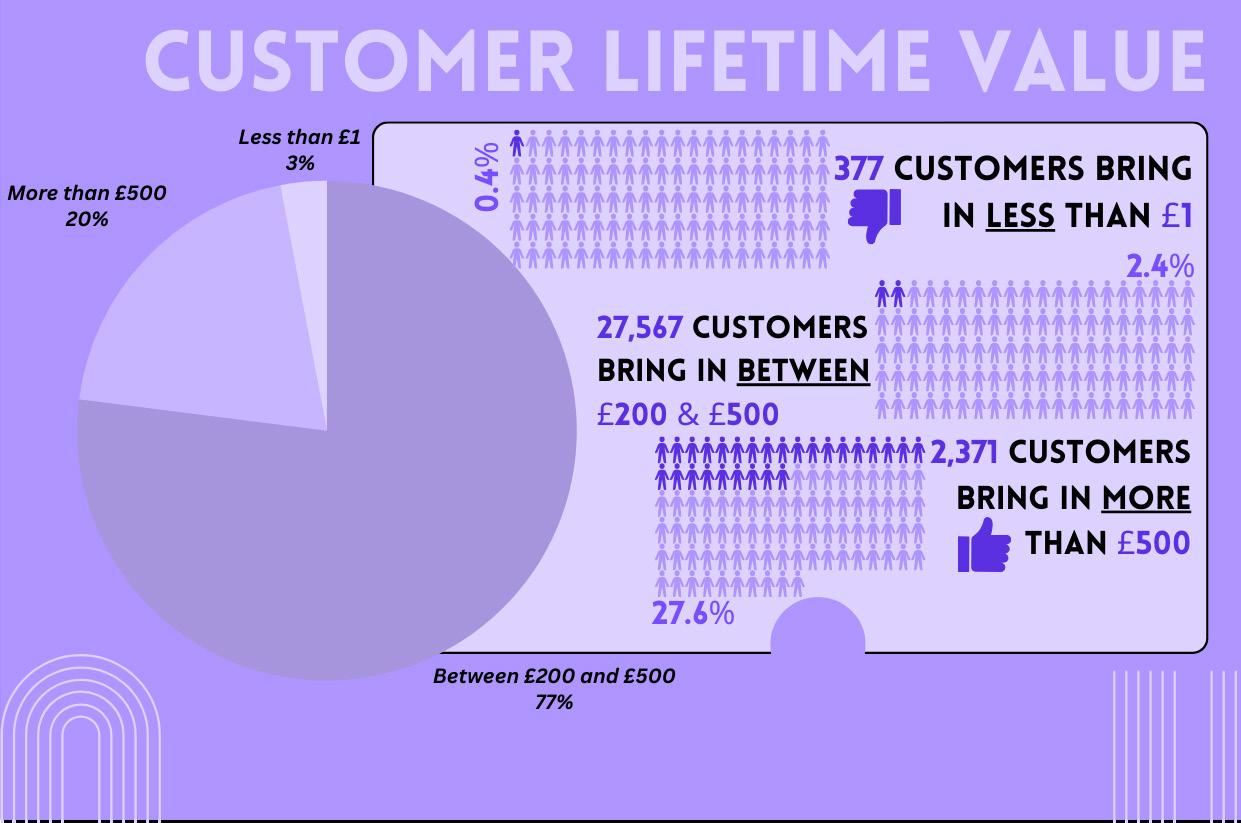
Figure 9.1 depicts that 377 customers bring in less than £1 and this brings the company negative customer lifetime value, because these customers are non-profitable, making up 2.7% of their consumer base. Therefore, Barefoot are selling products for less than what they purchased them for to these consumers, it is recommend that the company provides a general marketing strategy to non-profitable consumers rather than personalised and direct.
Figure 9.1: Customer Lifetime Value Pie Graph & InfographicIt is recommended that Barefoot take on a customer retention strategy to decrease their major problem of customer churn and to reduce the chances of any negative customer lifetime value to occur in the future. The company can do so by developing tiered marketing strategies, so their high spending and loyal consumers can receive premium offers. Through this marketing strategy Barefoot, should create a loyalty program to increase customer retention that reward consumers for their repeated purchases this will be targeted to the customers that shop more than once and those that spend more than £100 with the company. Loyalty programs can increase customer lifetime value because it can help to improve CRM for the brand as it encourages Barefoot’s customers to shop with them more to gain new incentives (Linkedin, 2023). Additionally, Barefoot should invest in improving their e-commerce strategy, so customers can use digital wallets as a payment method as well as ensuring all its online capabilities are used to adapt to their changing customers.
To conclude this report demonstrated a variety of recommendations for Barefoot throughout for the company to improve their sales and customer retention. Although the dataset has limitations such as ending in 2019, the recommendations provided are based on current research and the report also explores how the covid-19 pandemic impacted the company’s sales. Furthermore, it is highly recommended that Barefoot improve their customer churn, therefore loyalty schemes with incentives and rewards are very effective in retaining consumers (Linkedin, 2023). Loyalty programs provide customers a sense of belonging and appreciation from the company (Linkedin, 2023). This improves customer lifetime value because through offering perks and rewards, customers will spend more per transaction and more frequently (Linkedin, 2023).
BBC (2024) ‘What Is the UK’s Inflation Rate and Why Is the Cost of Living Going up?’, BBC News, 23 March. Available at: https://www.bbc.co.uk/news/business-12196322 (Accessed: 12 May 2024).
Bramley, E.V. (2024) ‘“Really dystopian”: Why Was There No Mention of Gaza at the Met Gala?’, The Guardian, 10 May. Available at: https://www.theguardian.com/fashion/article/2024/may/10/reallydystopian-why-was-there-no-mention-of-gaza-at-the-met-gala (Accessed: 12 May 2024).
CBInsights (2024) ClearPay, CBInsights. Available at: https://www.cbinsights.com/company/ clearpay-1 (Accessed: 13 May 2024).
De Best, R. (2024) Global Payment Methods e-commerce Market Share 2024, Statista. Available at: https://www.statista.com/statistics/1111233/payment-method-usage-transaction-volume-shareworldwide/ (Accessed: 14 May 2024).
Edser, N. (2024) ‘UK Exits Recession with Fastest Growth in Two Years’, BBC News, 10 May. Available at: https://www.bbc.co.uk/news/business-68983741 (Accessed: 12 May 2024).
Gritten, D. (2024) ‘Israeli Operation Leaves Rafah’s Hospitals Overwhelmed’, BBC News, 10 May. Available at: https://www.bbc.co.uk/news/world-middle-east-68983445 (Accessed: 12 May 2024).
Harreis, H., Koullias, T., Roberts, R. and Te, K. (2023) Generative AI: Unlocking the Future of Fashion, McKinsey. McKinsey & Co. Available at: https://www.mckinsey.com/industries/retail/our-insights/ generative-ai-unlocking-the-future-of-fashion (Accessed: 12 May 2024).
James, H. (2023) Fashion Brands Need to Be Prepared for a gender-fluid Future, Marketing Week. Available at: https://www.marketingweek.com/helen-james-fashion-brands-gender-fluid-future/ (Accessed: 13 May 2024).
Klarna (2023) About Us | Klarna UK, Klarna.com. Available at: https://www.klarna.com/uk/about-us/ (Accessed: 13 May 2024).
Klarna UK (2024) What is Klarna - Klarna UK, www.klarna.com. Available at: https://www.klarna.com/ uk/how-klarna-works/ (Accessed: 13 May 2024).
Lee, T., Skipper, H., Kaliq, M. and Dey-Chowdhury, S. (2022) Coronavirus (COVID-19) and Its Effects on Household consumption, UK - Office for National Statistics, www. ons.gov.uk. Available at: https://www.ons.gov.uk/economy/nationalaccounts/ uksectoraccounts/articles/coronaviruscovid19anditseffectsonhouseholdconsumptionuk/ january2020todecember2021#:~:text=The%20effects%20of%20the%20coronavirus (Accessed: 12 May 2024).
Linkedin (2023) How Do Loyalty Programs Increase Customer Retention and Lifetime value?, Linkedin. Available at: https://www.linkedin.com/advice/0/how-do-loyalty-programs-increasecustomer-retention (Accessed: 14 May 2024).
Maguire, L. (2021) Genderless Jewellery Doesn’t Have to Be ‘neutral’, Vogue Business. Available at: https://www.voguebusiness.com/fashion/genderless-jewellery-doesnt-have-to-be-neutral (Accessed: 13 May 2024).
Miller, N. (2024) Data Protection - What to Expect in 2024?, Fox Williams. Available at: https://www.foxwilliams.com/2024/01/30/data-protection-what-to-expect-in-2024/ (Accessed: 12 May 2024).
Murphy, C. (2022) Inside Recency, Frequency, Monetary Value (RFM), Investopedia. Edited by M. James and S. Kvilhaug. Available at: https://www.investopedia.com/ terms/r/rfm-recency-frequency-monetary-value.asp (Accessed: 14 May 2024).
Rannard, G. (2024) European Court Rules Human Rights Violated by Climate Inaction, BBC News. BBC News. Available at: https://www.bbc.co.uk/news/scienceenvironment-68768598 (Accessed: 12 May 2024).
Statista (2023a) Fashion e-commerce in the United Kingdom (UK), Statista. Available at: https://www.statista.com/study/35821/fashion-e-commerce-in-the-united-kingdom/ (Accessed: 12 May 2024).
Statista (2023b) Fashion e-commerce Worldwide, Statista. Available at: https://www. statista.com/study/111688/fashion-e-commerce-worldwide/ (Accessed: 12 May 2024).
Statista (2023c) Jewelry Market Worldwide, Statista. Available at: https://www.statista. com/study/60384/jewelry-market-worldwide/ (Accessed: 12 May 2024).
Statista (2024) Jewelry in the UK, Statista. Available at: https://www.statista.com/ study/22846/jewellery-in-the-uk-statista-dossier/ (Accessed: 12 May 2024).
Statista Market Forecast (2024) Luxury Eyewear - Worldwide, Statista. Available at: https://www.statista.com/outlook/emo/luxury-goods/luxury-eyewear/ worldwide?currency=GBP (Accessed: 13 May 2024).
Statista Market Insights (2021) UK: Fashion e-commerce Users by Gender 2020, Statista. Available at: https://www.statista.com/forecasts/480950/clothes-and-accessories-ecommerce-users-by-age-and-gender-digital-market-outlook-uk (Accessed: 13 May 2024).
Statista Market Insights (2023) Luxury Watches & Jewelry: Market Data & Analysis, Statista. Available at: https://www.statista.com/study/56843/luxury-watches-andjewelry-market-data-and-analysis/ (Accessed: 12 May 2024).
Statista Market Insights (2024) Jewelry - Worldwide | Statista Market Forecast, Statista. Available at: https://www.statista.com/outlook/emo/fashion/accessories/watchesjewelry/jewelry/worldwide?currency=GBP (Accessed: 13 May 2024).
XE (2024) 28,136,000,000 DKK to GBP - Danish Kroner to British Pounds Exchange Rate, www.xe.com. Available at: https://www.xe.com/currencyconverter/ convert/?Amount=28136000000&From=DKK&To=GBP (Accessed: 12 May 2024).