1 minute read
Benchmarks | participating councils


CATALYSE® has conducted studies for close to 70 councils. When councils ask comparable questions, we publish the high and average scores to enable participating councils to recognise and learn from the industry leaders. In this report, the average and high scores are calculated from councils that have completed a MARKYT® accredited study within the past three years.
How to read MARKYT® performance dashboards
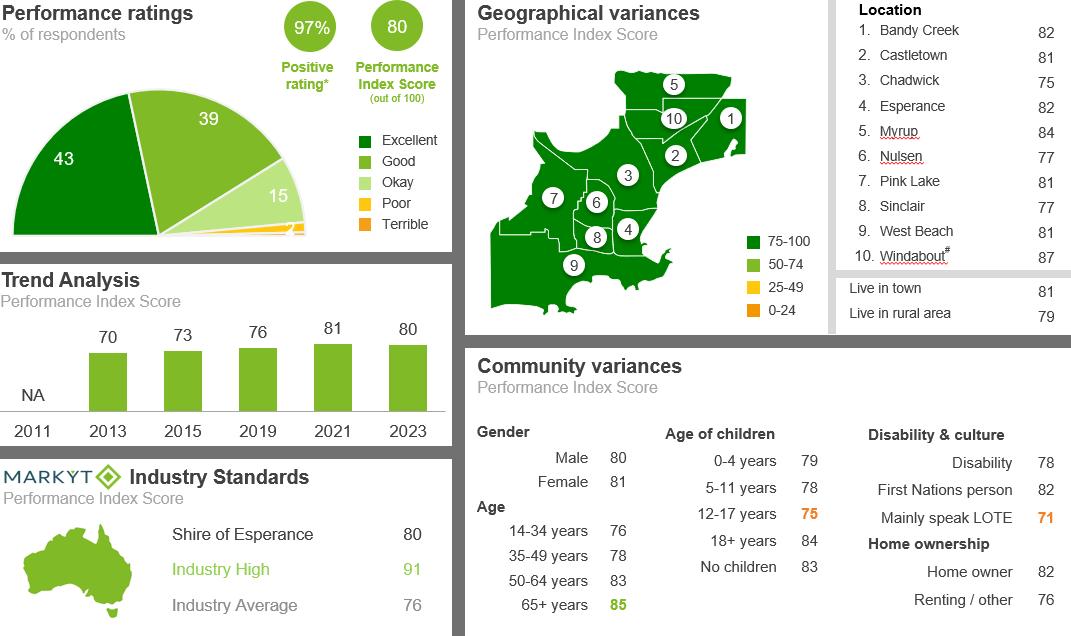
The Performance Index Score is a weighted score out of 100.
Performance Ratings
The chart shows community perceptions of performance on a five point scale from excellent to terrible.
Positive rating
Is the percentage of respondents who provided a rating of okay, good or excellent.
Geographical variances
Maps variances across the region by location.
Trend analysis shows how performance varies over time.
MARKYT® Industry Standards
Show Council performance compared to other councils.
Council Score is the Council’s performance index score.
Industry High is the highest score achieved by participating councils. Industry Average is the average score among participating.
Community variances
Shows how performance ratings vary across the community by key demographics.
Scores are highlighted when the index score varies by ±5 points of the Shire of Esperance’s overall score.

