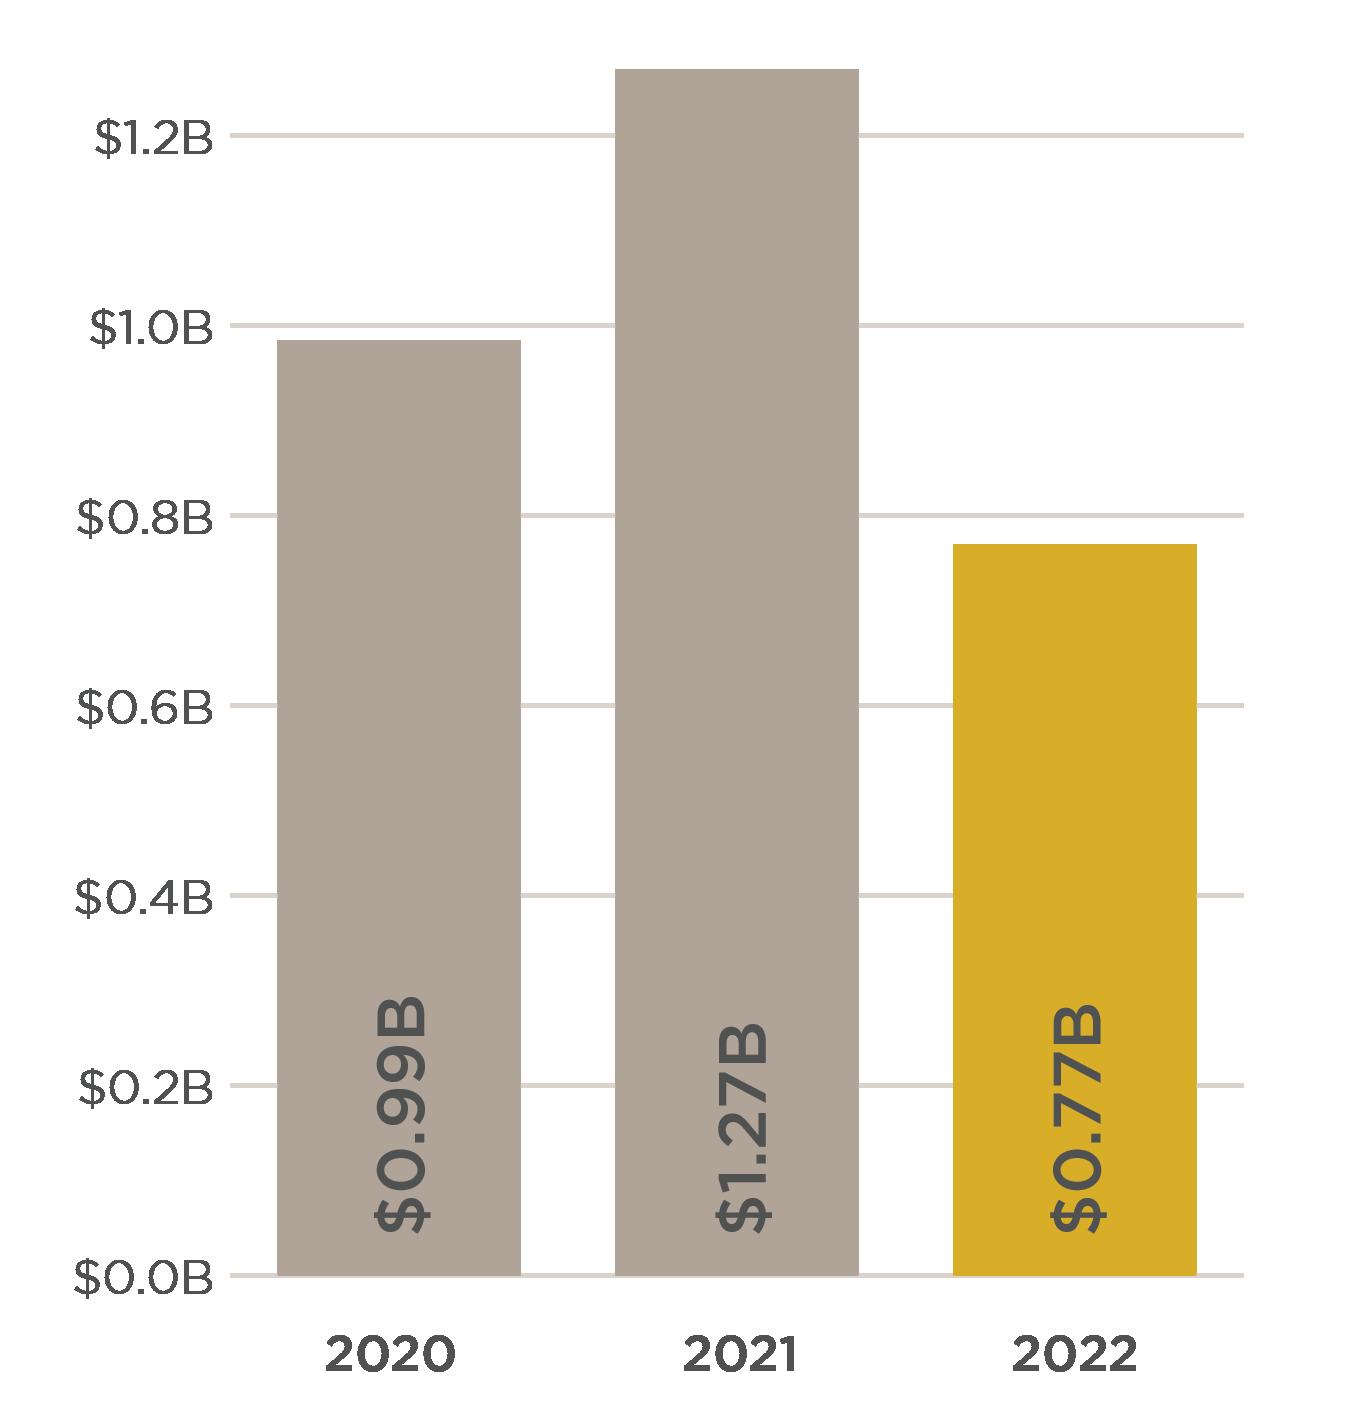
BRECKENRIDGE
SINGLE FAMILY & DUPLEX
SALES VOLUME NO OF SALES AVG DAYS ON MARKET AVG SALE MEDIAN SALE
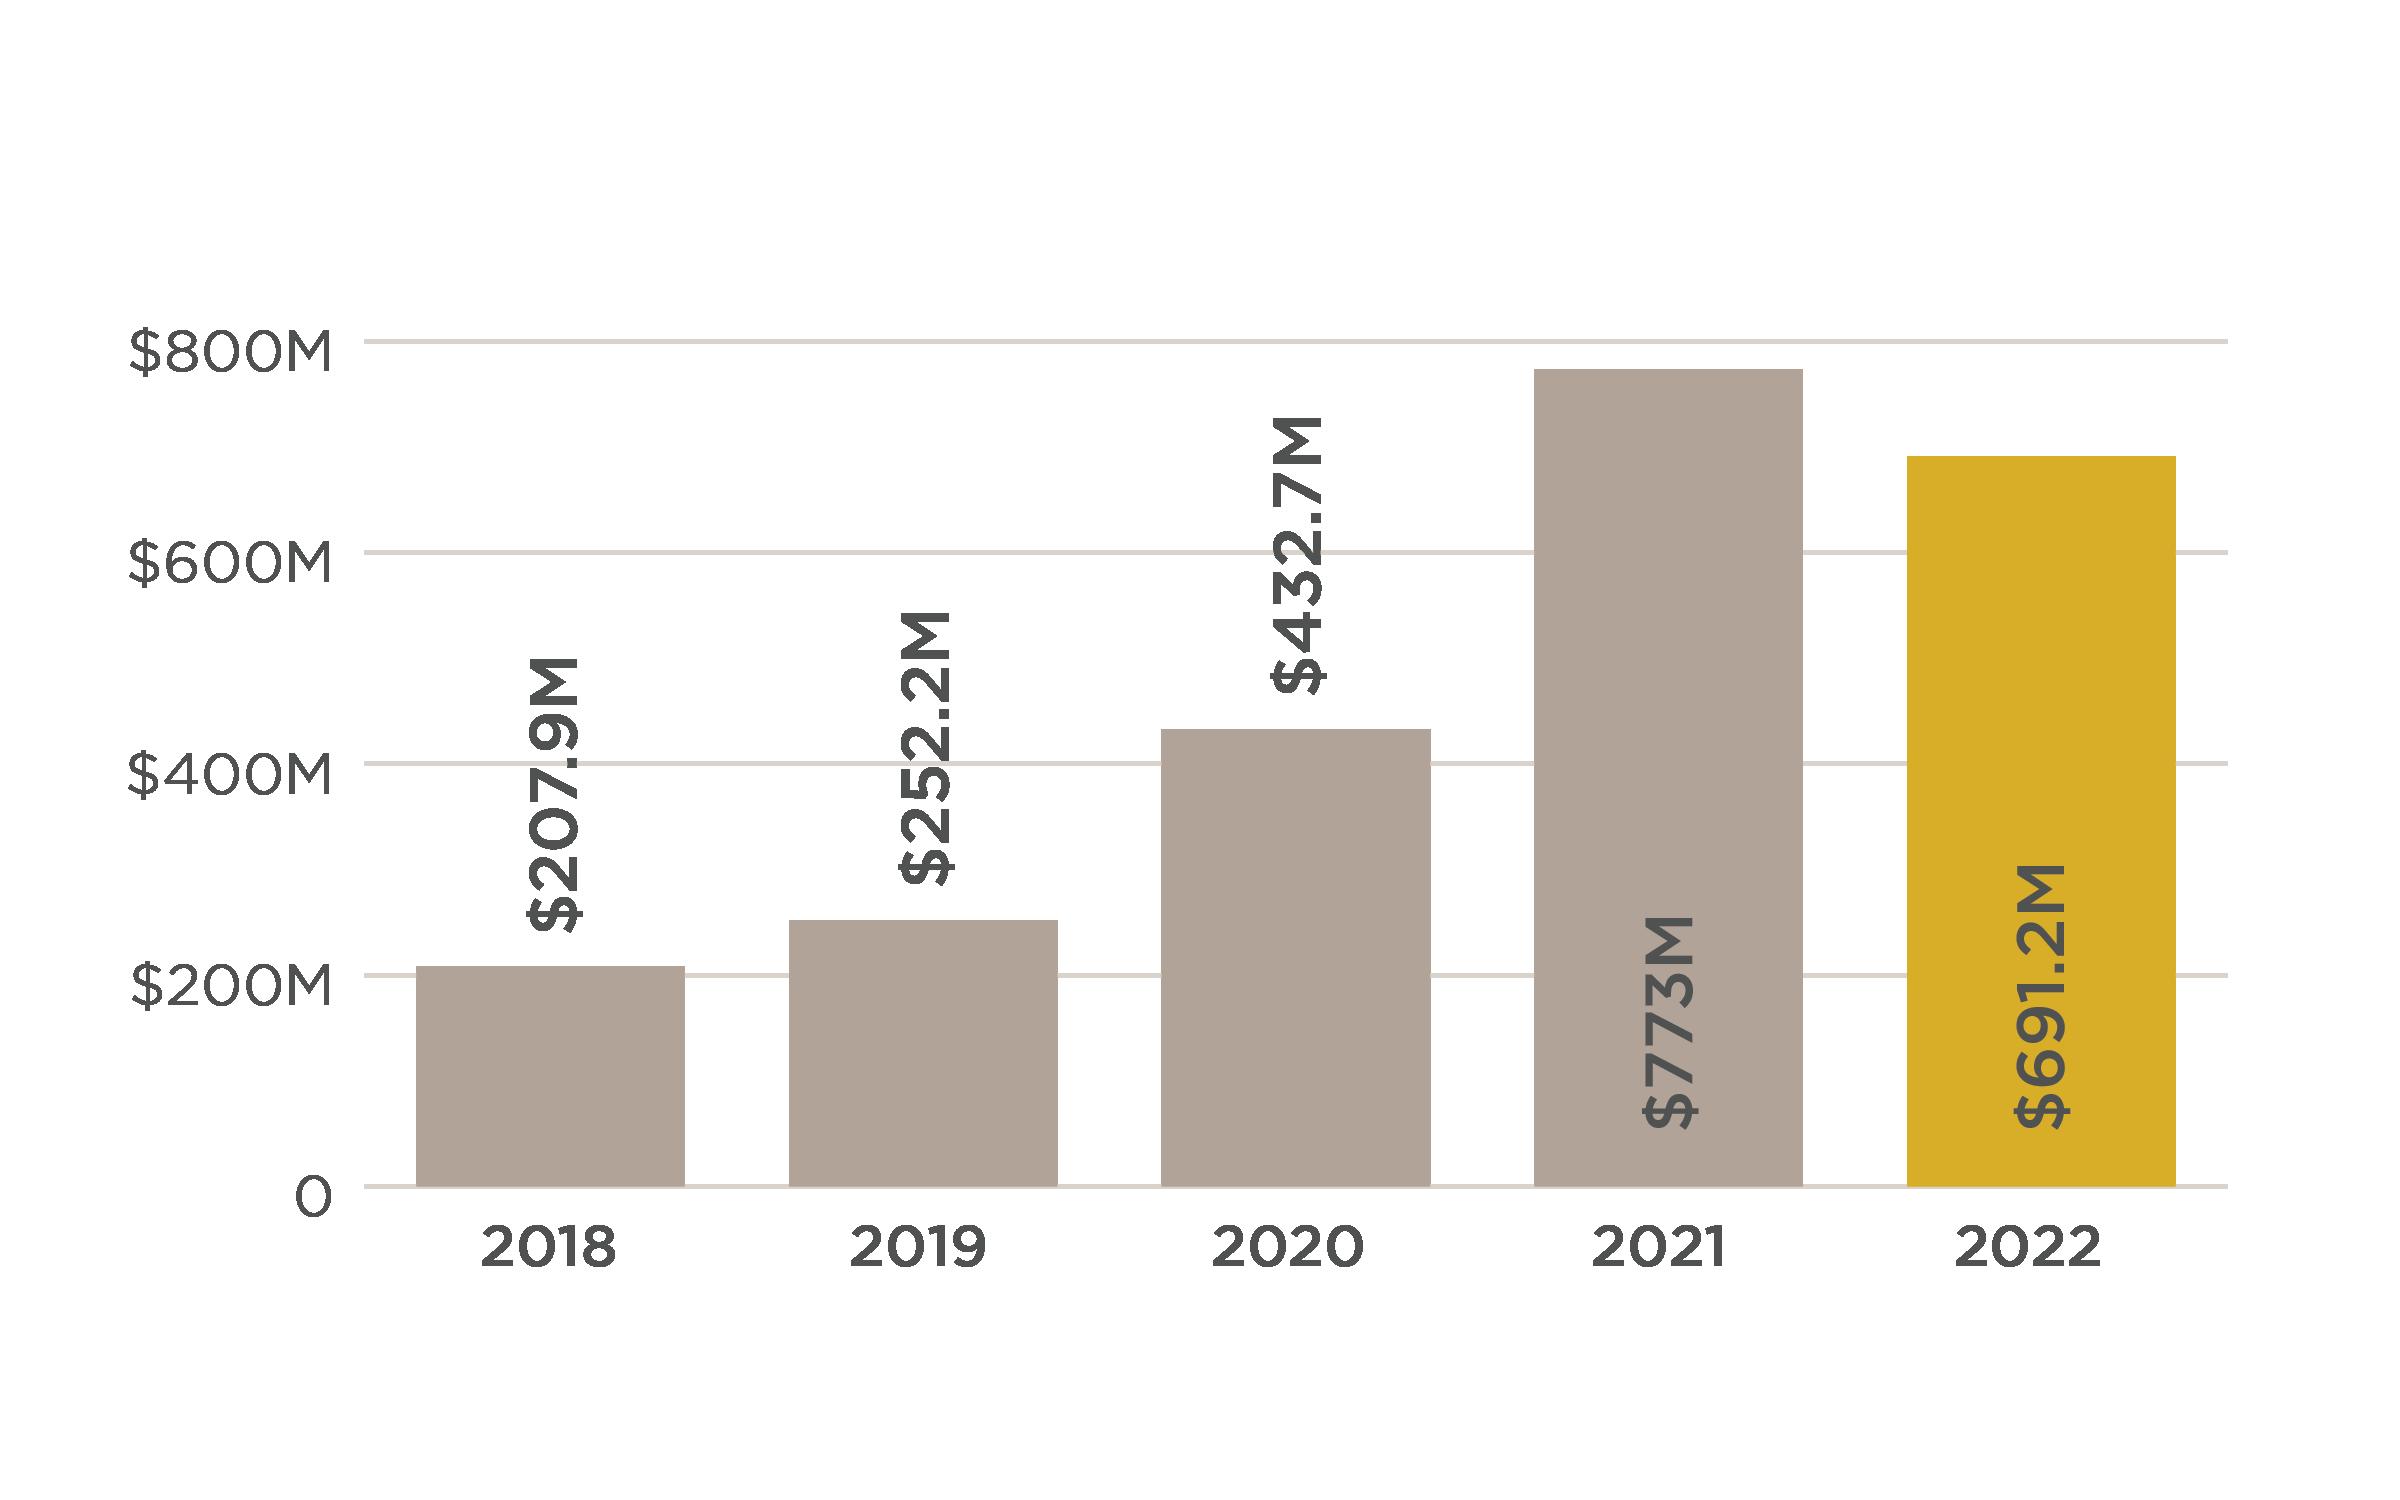
2018 $436,123,233 316 81 $1,380,137 $1,137,000 2019 $508,873,067 324 91 $1,570,596 $1,245,000 2020 $641,750,882 390 85 $1,645,515 $1,350,000 2021 $851,490,193 396 39 $2,150,228 $1,659,000 2022 $532,756,761 228 39 $2,336,652 $1,997,000
& TOW NHOME
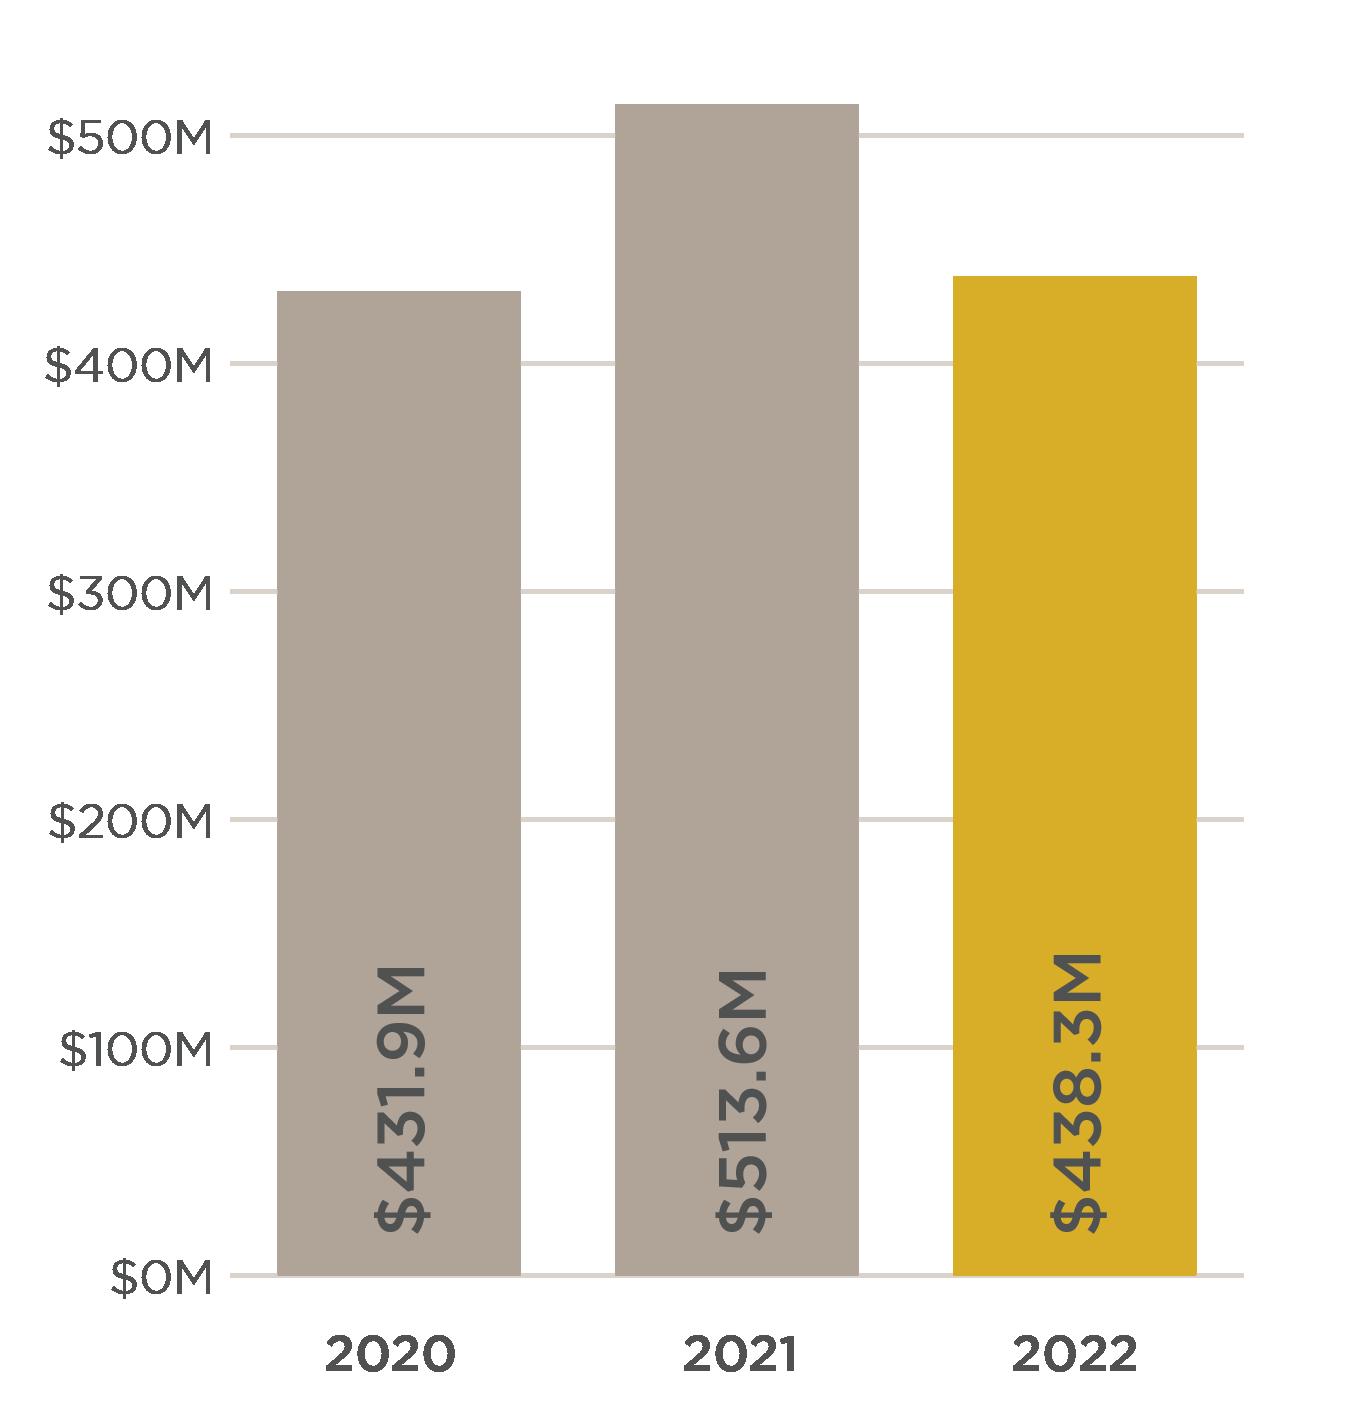
2018 $229,559,214 383 44 $599,371 $497,000 2019 $201,144,435 299 56 $672,724 $600,000 2020 $281,095,121 388 54 $724,472 $655,000 2021 $354,997,982 401 24 $885,282 $755,000 2022 $196,190,421 204 30 $961,718 $810,000
Slifer Smith & Frampton Real Estate | 12
CONDOMINIUM
SALES VOLUME NO OF SALES AVG DAYS ON MARKET AVG SALE MEDIAN SALE
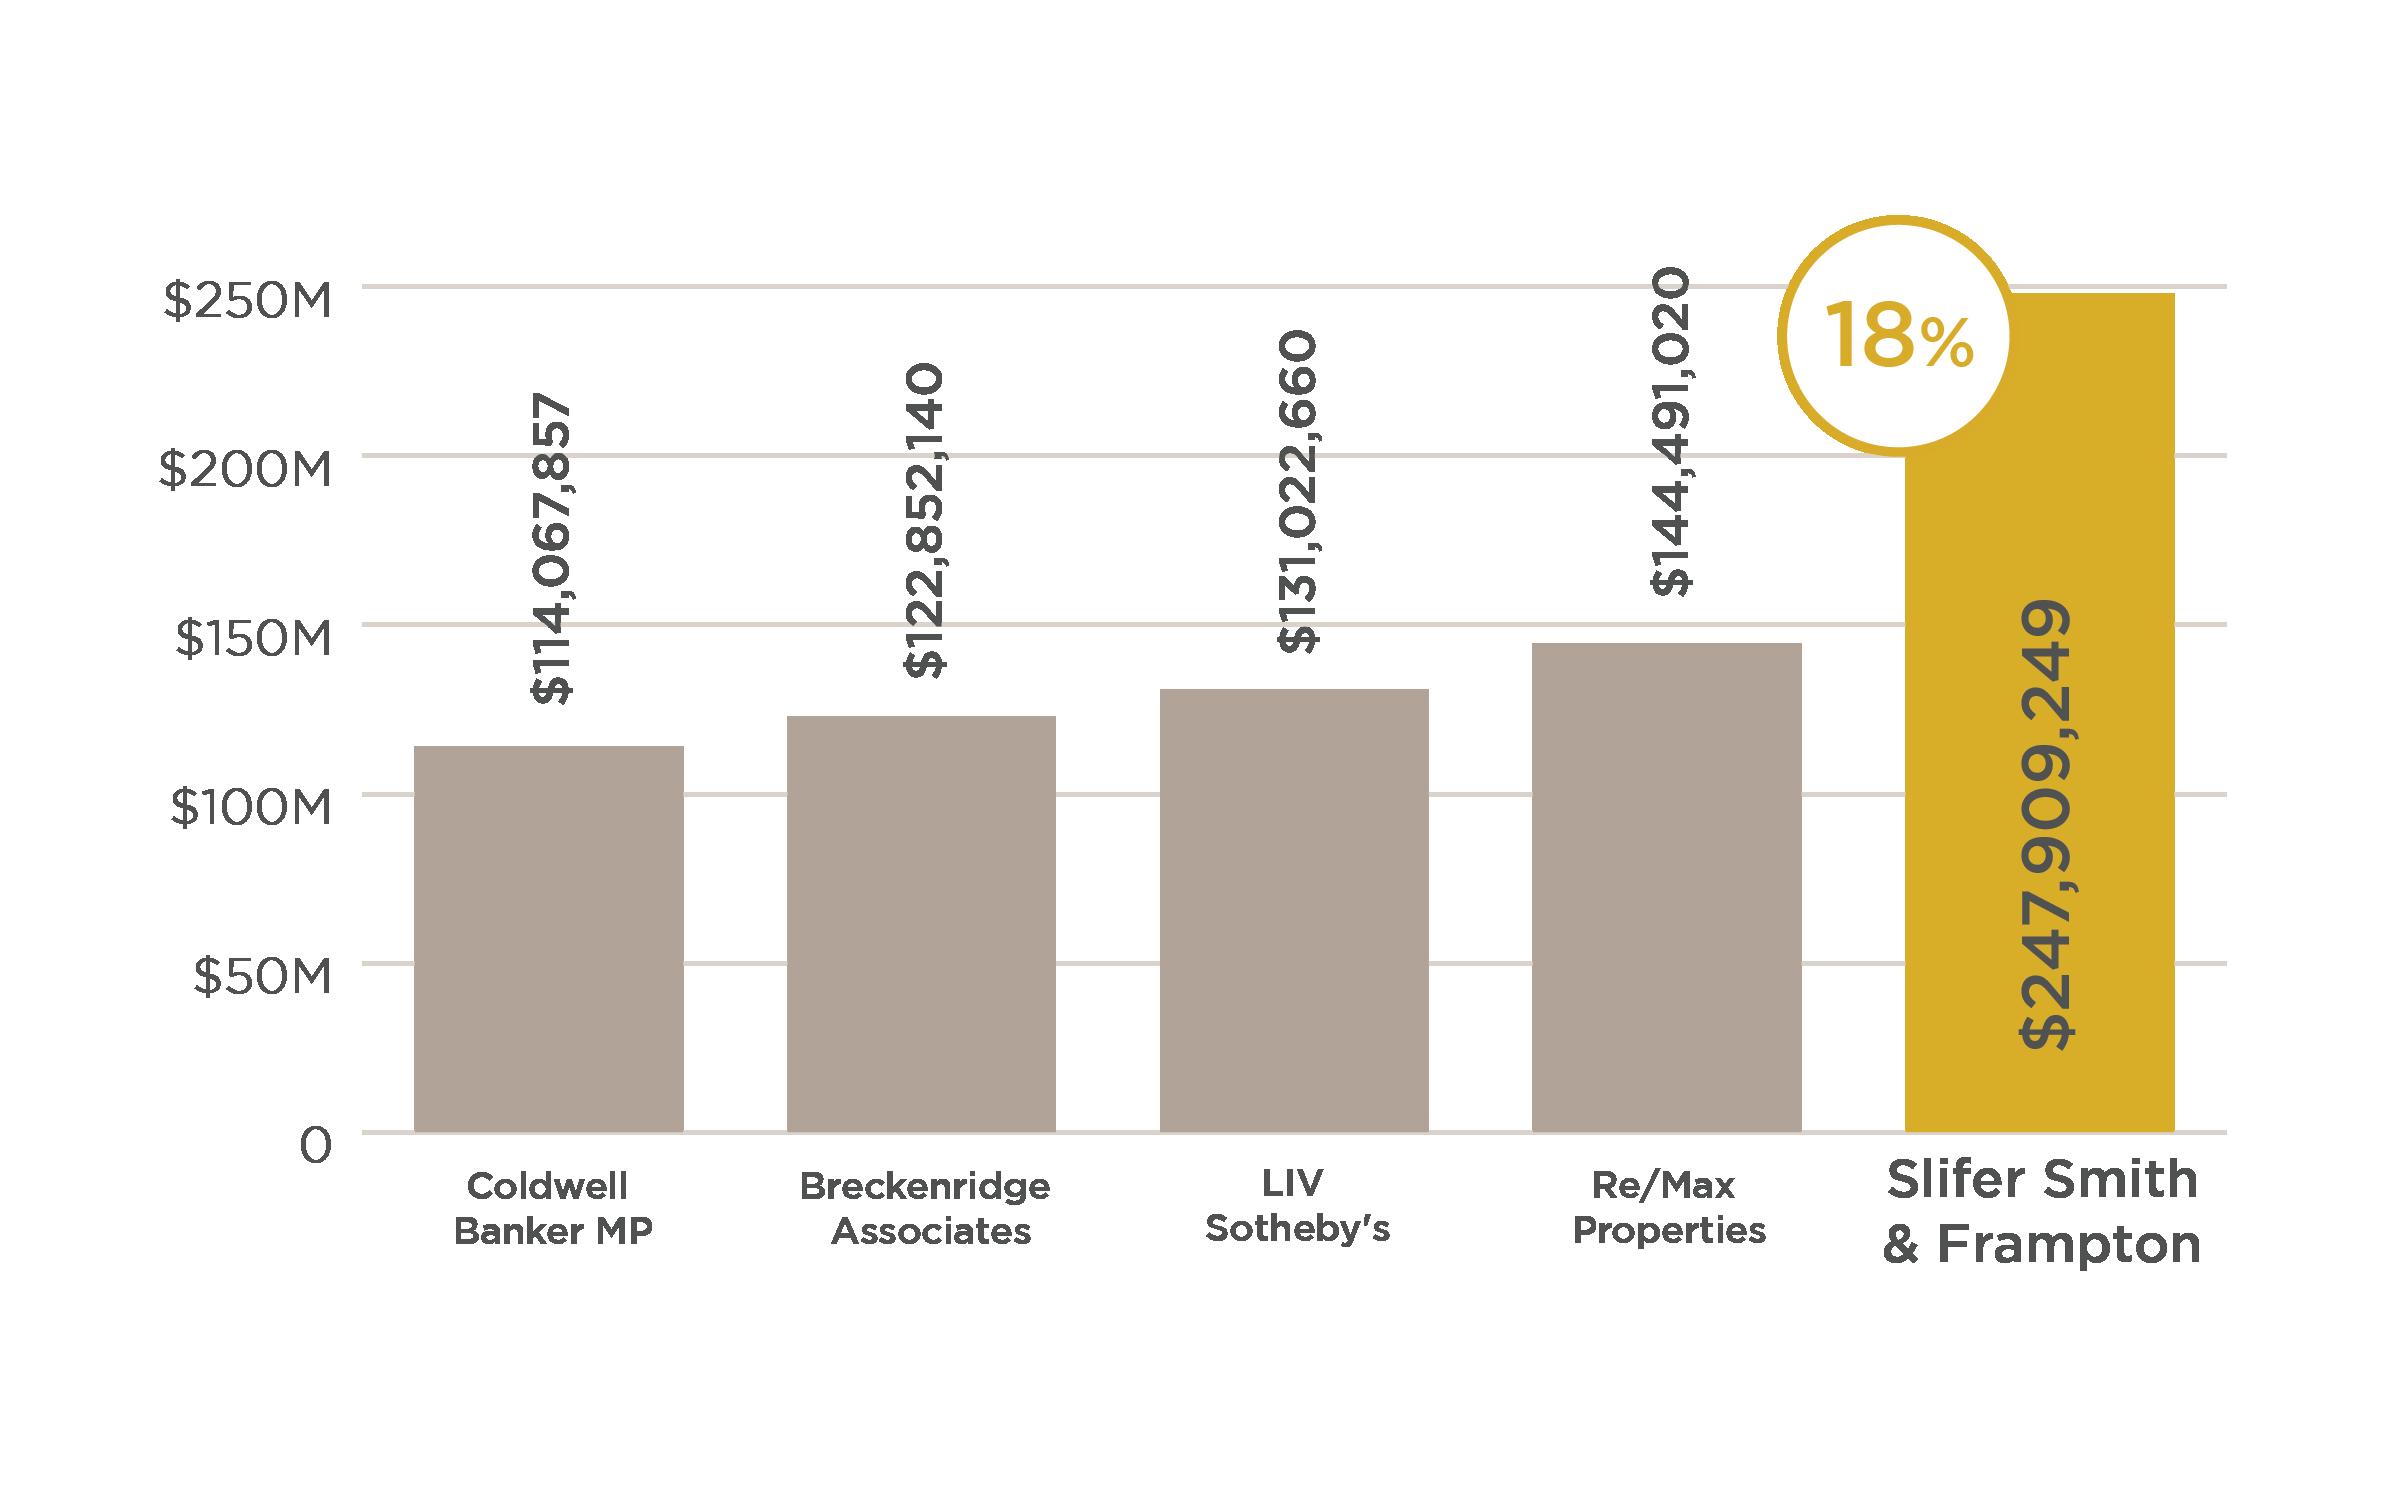
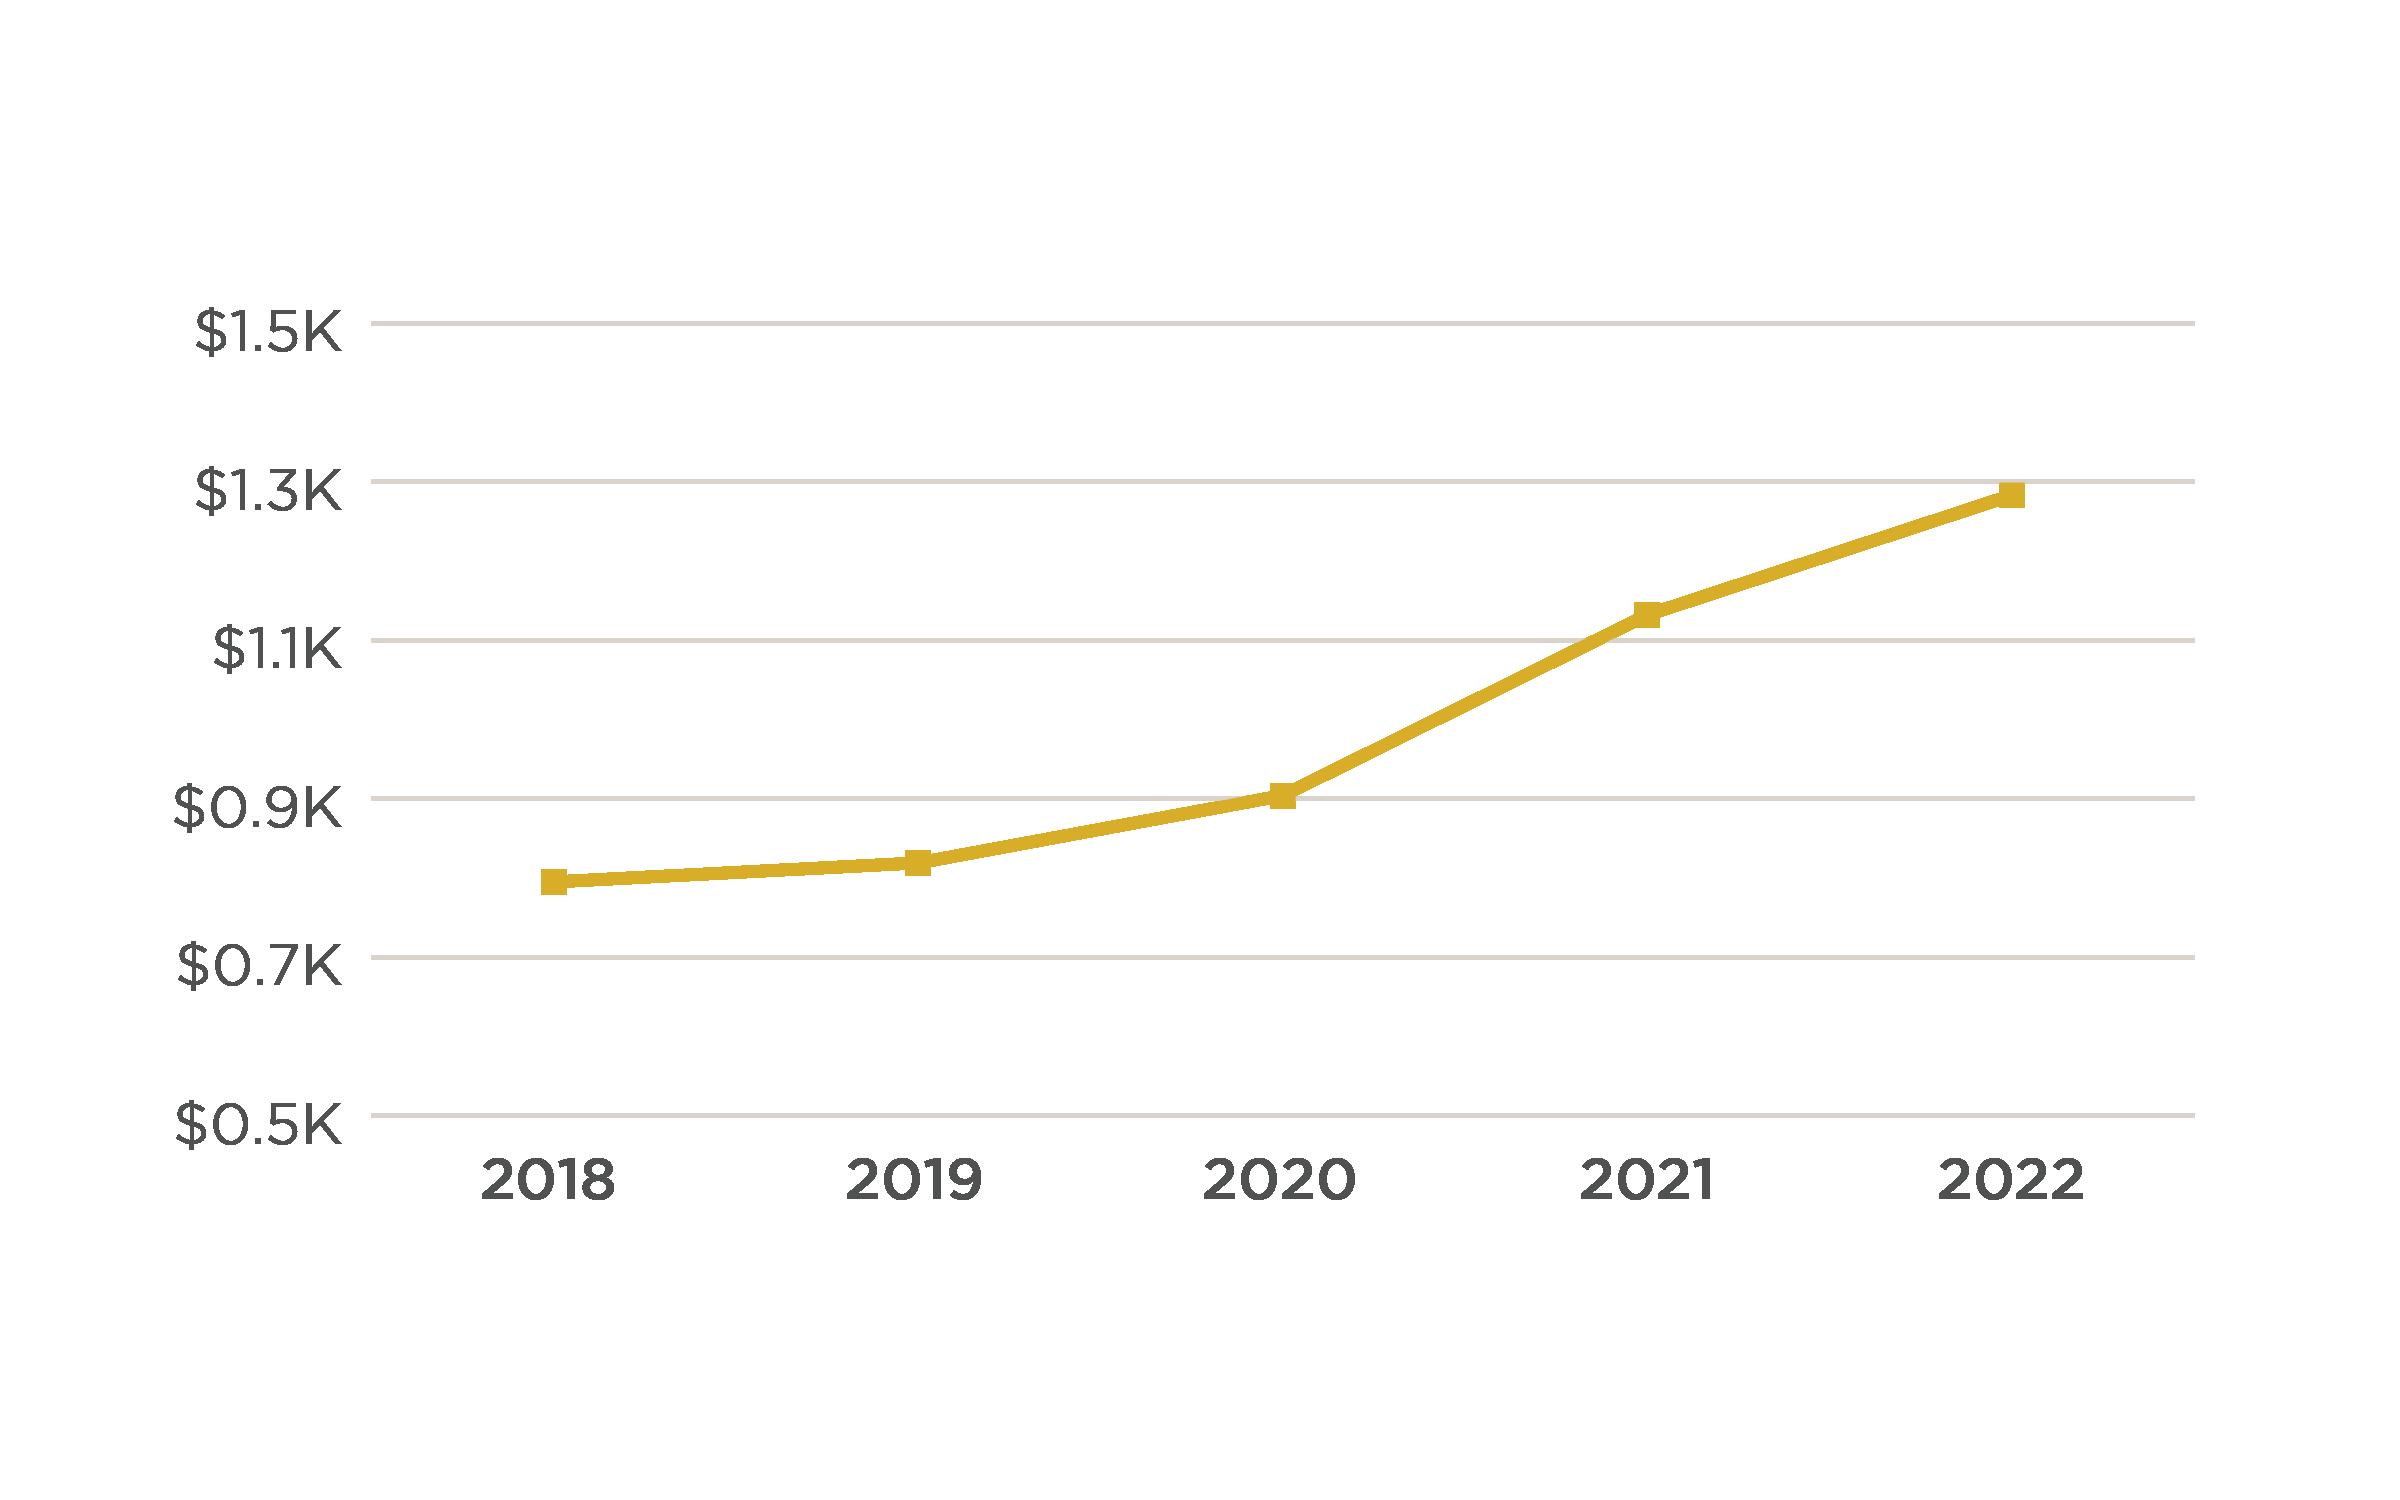
AREA highlights AVERAGE PRICE PER SQUARE FOOT SALE VS. LIST PRICE COMPARISON 2018 2019 2020 2021 2022 Single Family & Duplex $444 $484 $515 $668 $767 Condominium & Townhome $590 $659 $684 $867 $991 AVERAGE SALE / LAST LISTED PRICE Single Family & Duplex 98% Condominium & Townhome 99% SALES VOLUME COMPARISON VS2021 9% Increasein averagesoldprice -SF/Duplex 14% Increasein averageprice per Sq.Ft. -Condo/TH
SINGLE FAMILY & DUPLEX
SALES VOLUME NO OF SALES AVG DAYS ON MARKET AVG SALE MEDIAN SALE
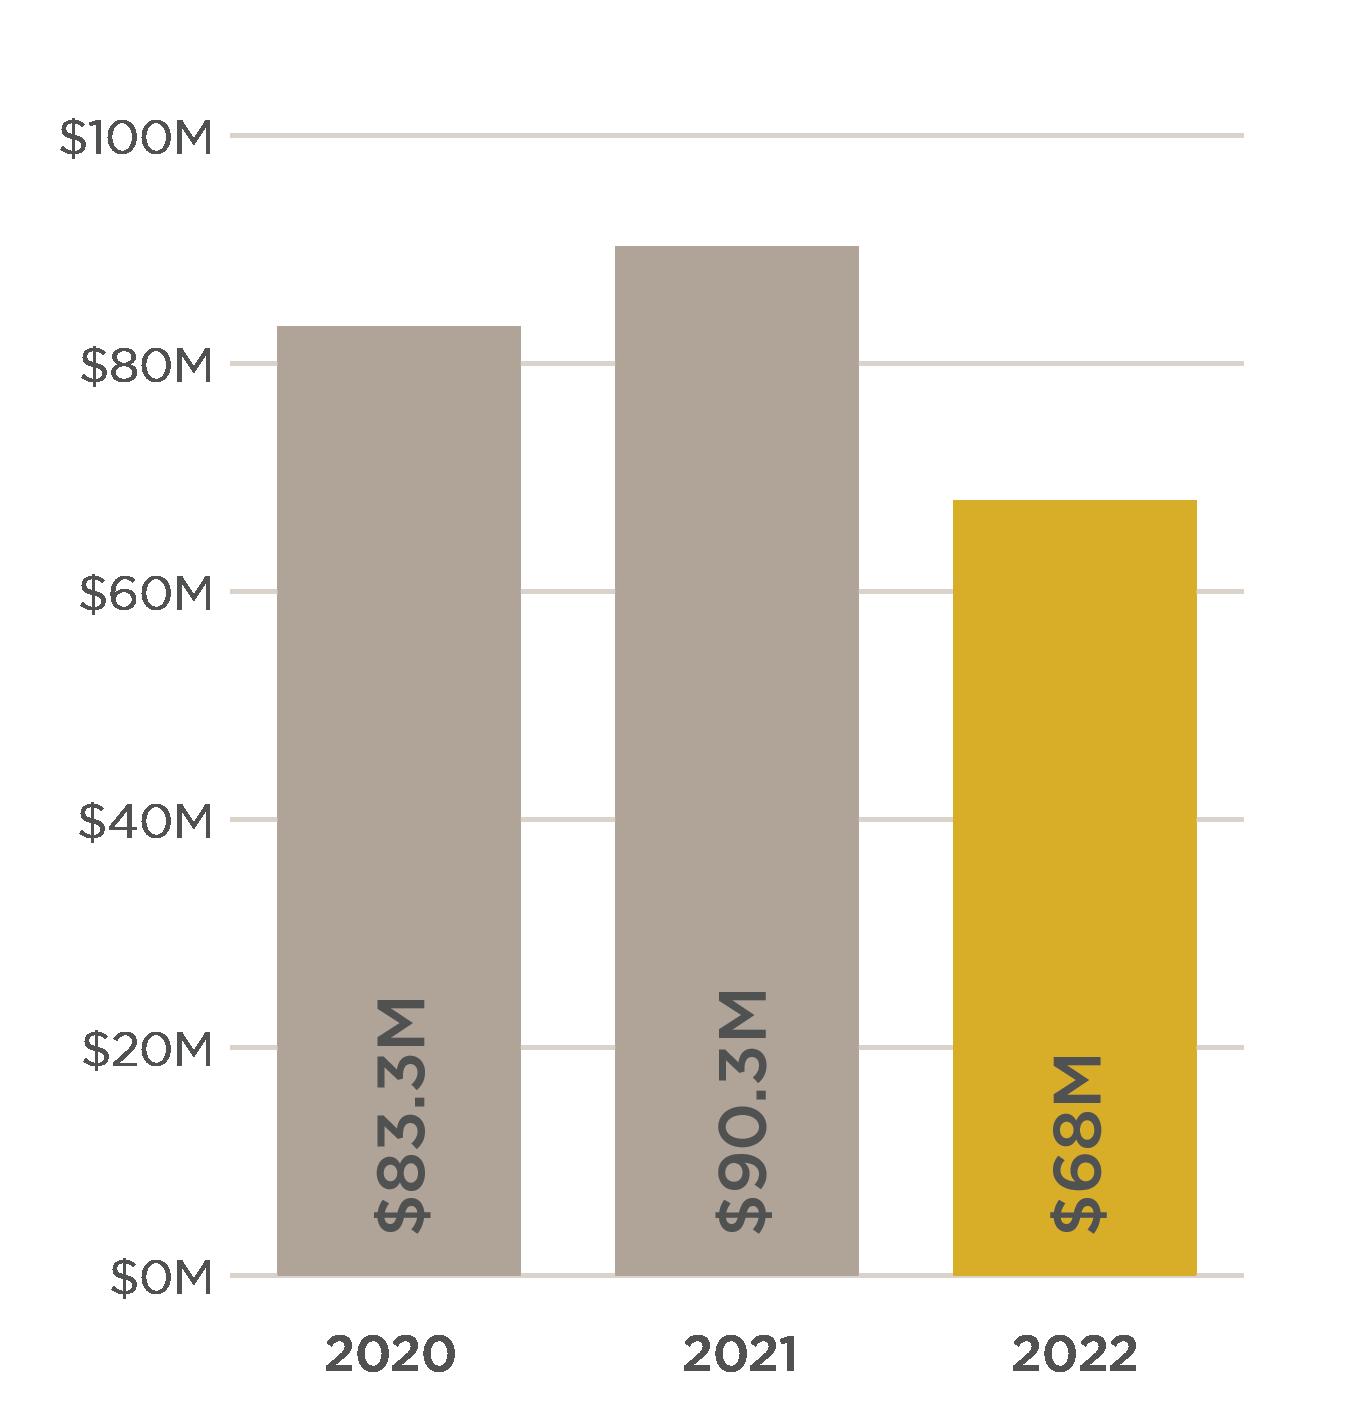
2018 $10,766,500 4 397 $2,691,625 $2,689,250 2019 $8,260,000 3 275 $2,753,333 $3,050,000
2020 $22,503,000 10 258 $2,250,300 $1,902,500 2021 $3,850,000 1 4 $3,850,000 $3,850,000 2022 $20,587,574 6 12 $3,431,262 $3,203,250
CONDOMINIUM & TOW NHOME
SALES VOLUME NO OF SALES AVG DAYS ON MARKET AVG SALE MEDIAN SALE
2018 $42,392,919 87 55 $487,275 $475,000 2019 $32,318,489 58 67 $557,215 $515,000 2020 $59,010,570 101 68 $584,263 $555,000 2021 $76,669,522 105 14 $730,186 $730,000 2022 $43,928,862 54 17 $813,497 $737,000
The Slifer Report 2023 | 13 COPPER
AVERAGE PRICE PER SQUARE FOOT SALE VS. LIST PRICE COMPARISON 2018 2019 2020 2021 2022 Single Family & Duplex $540 $535 $554 $605 $803 Condominium & Townhome $551 $580 $614 $730 $888 AVERAGE SALE / LAST LISTED PRICE Single Family & Duplex 97% Condominium & Townhome 99% SALES VOLUME COMPARISON AREA highlights VS2021 11% Increasein averagesales price -Condo/TH 33% Increasein averageprice per Sq.Ft. -SF/Duplex
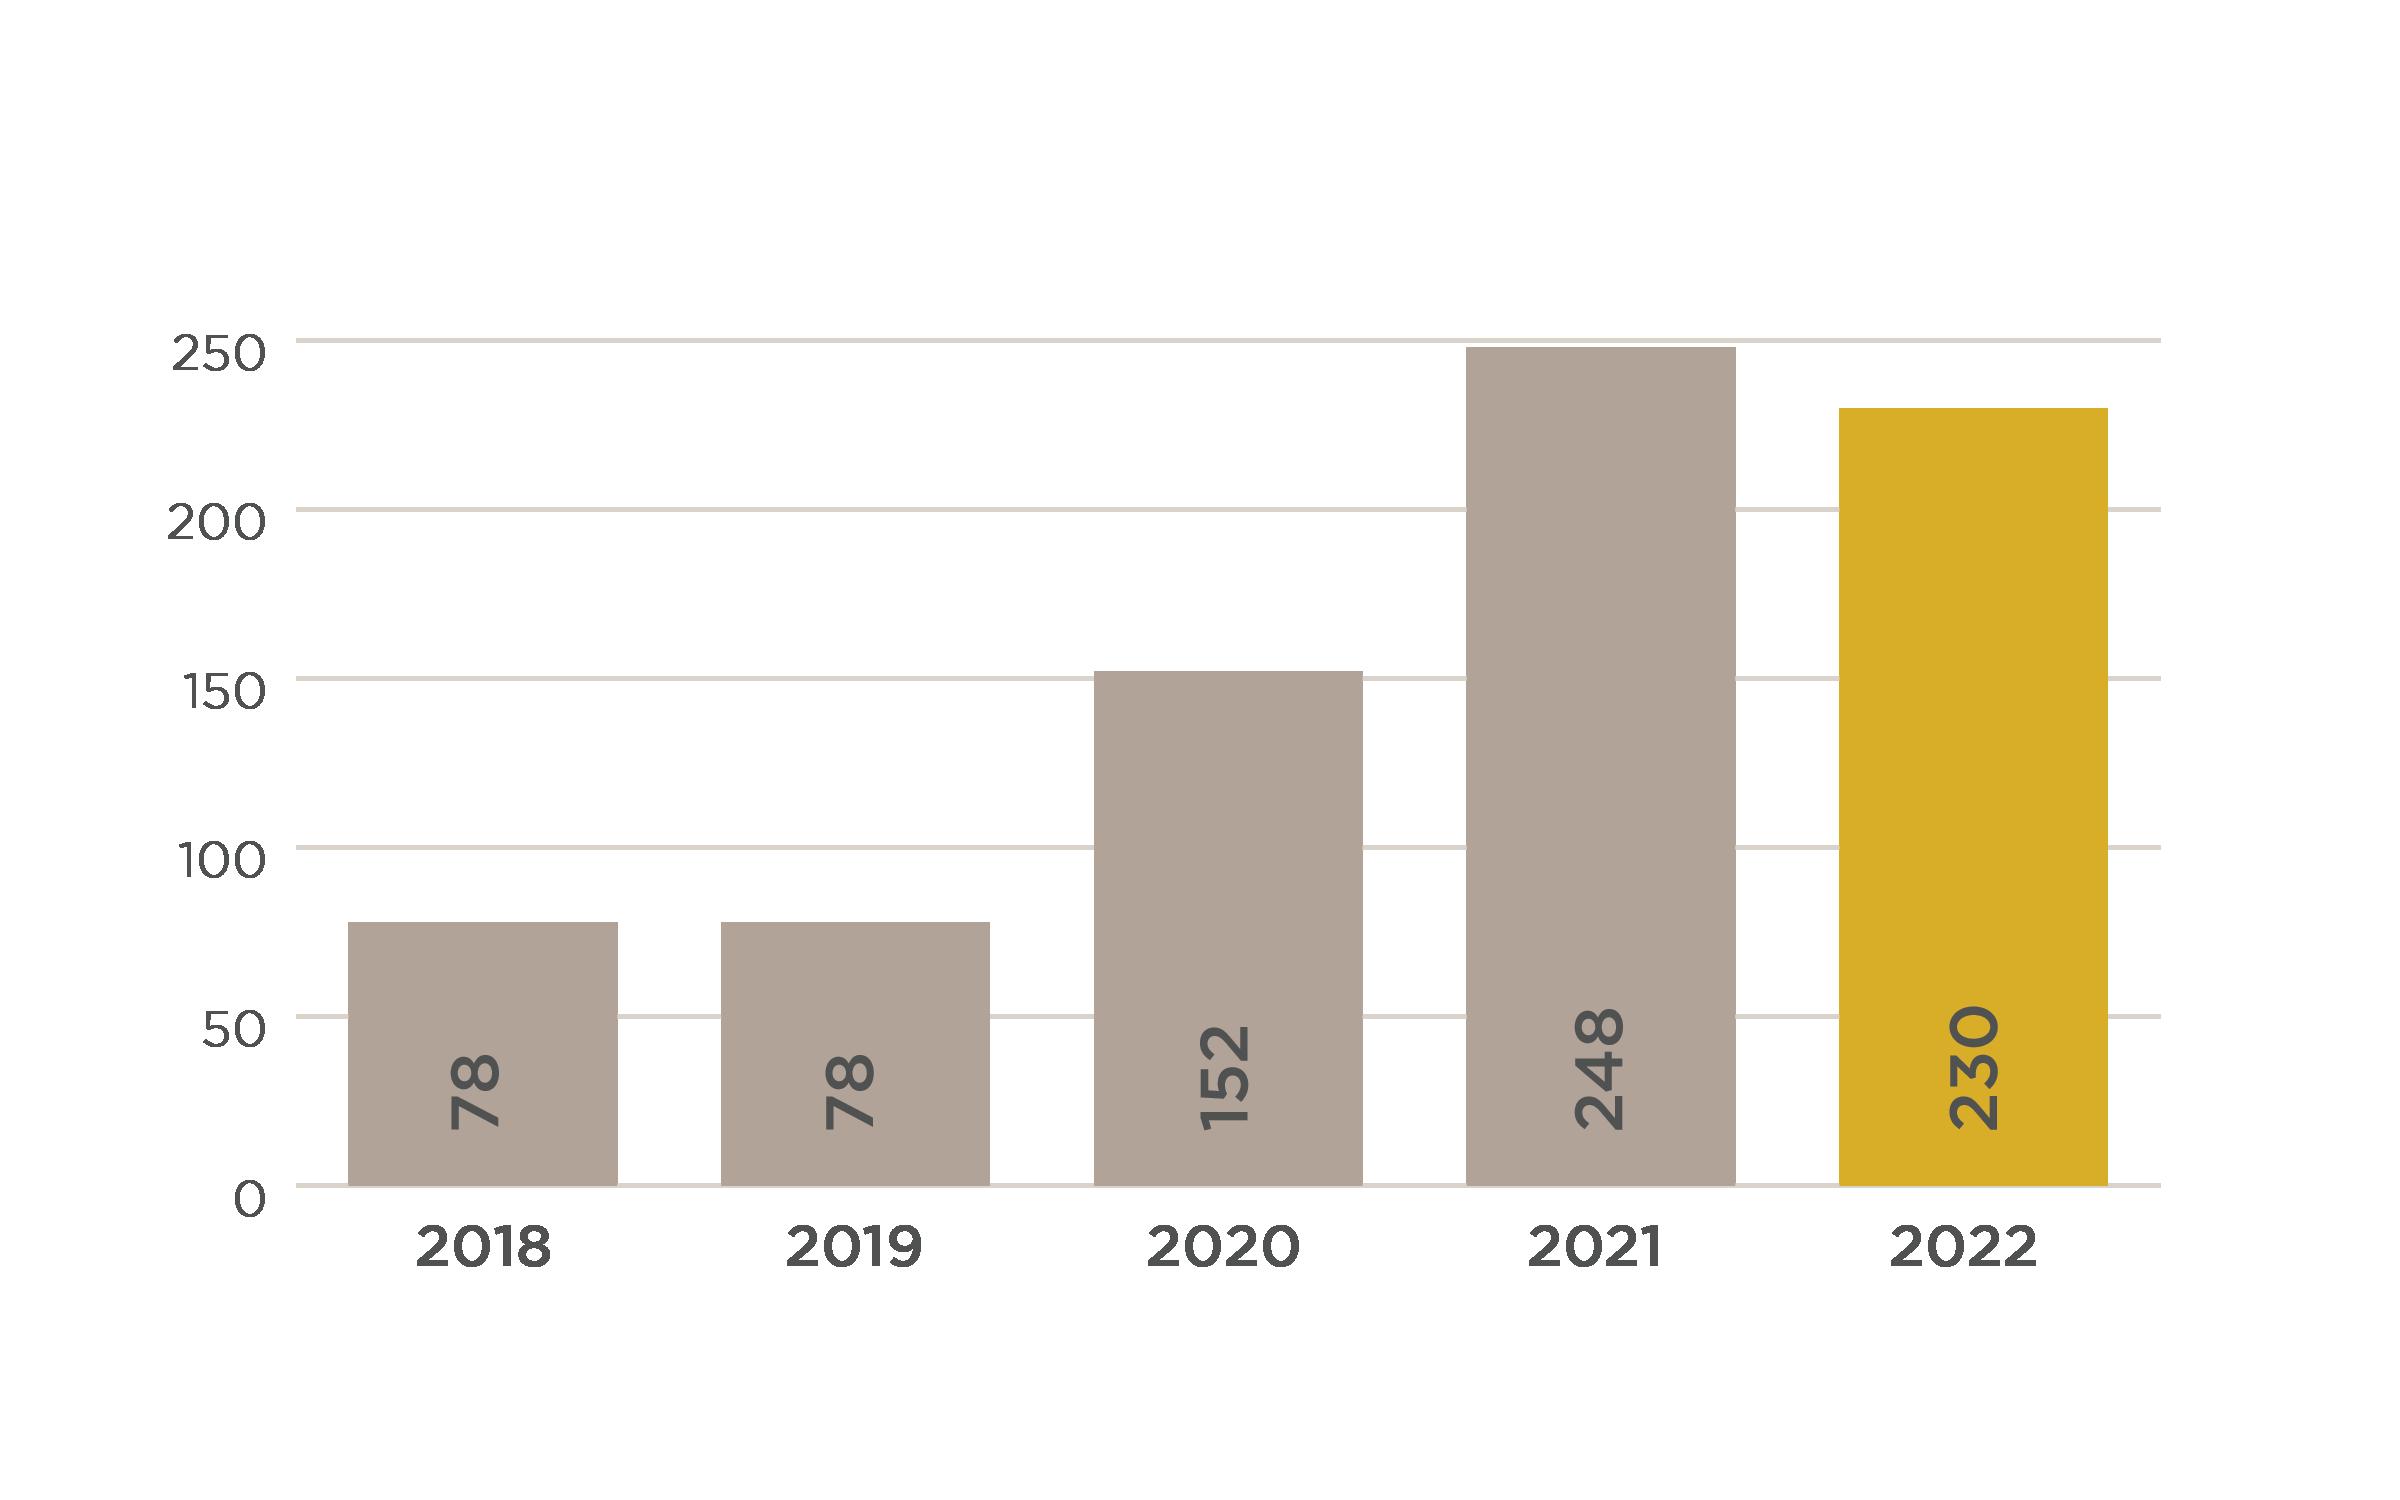
SINGLE FAMILY & DUPLEX
SALES VOLUME NO OF SALES AVG DAYS ON MARKET AVG SALE MEDIAN SALE
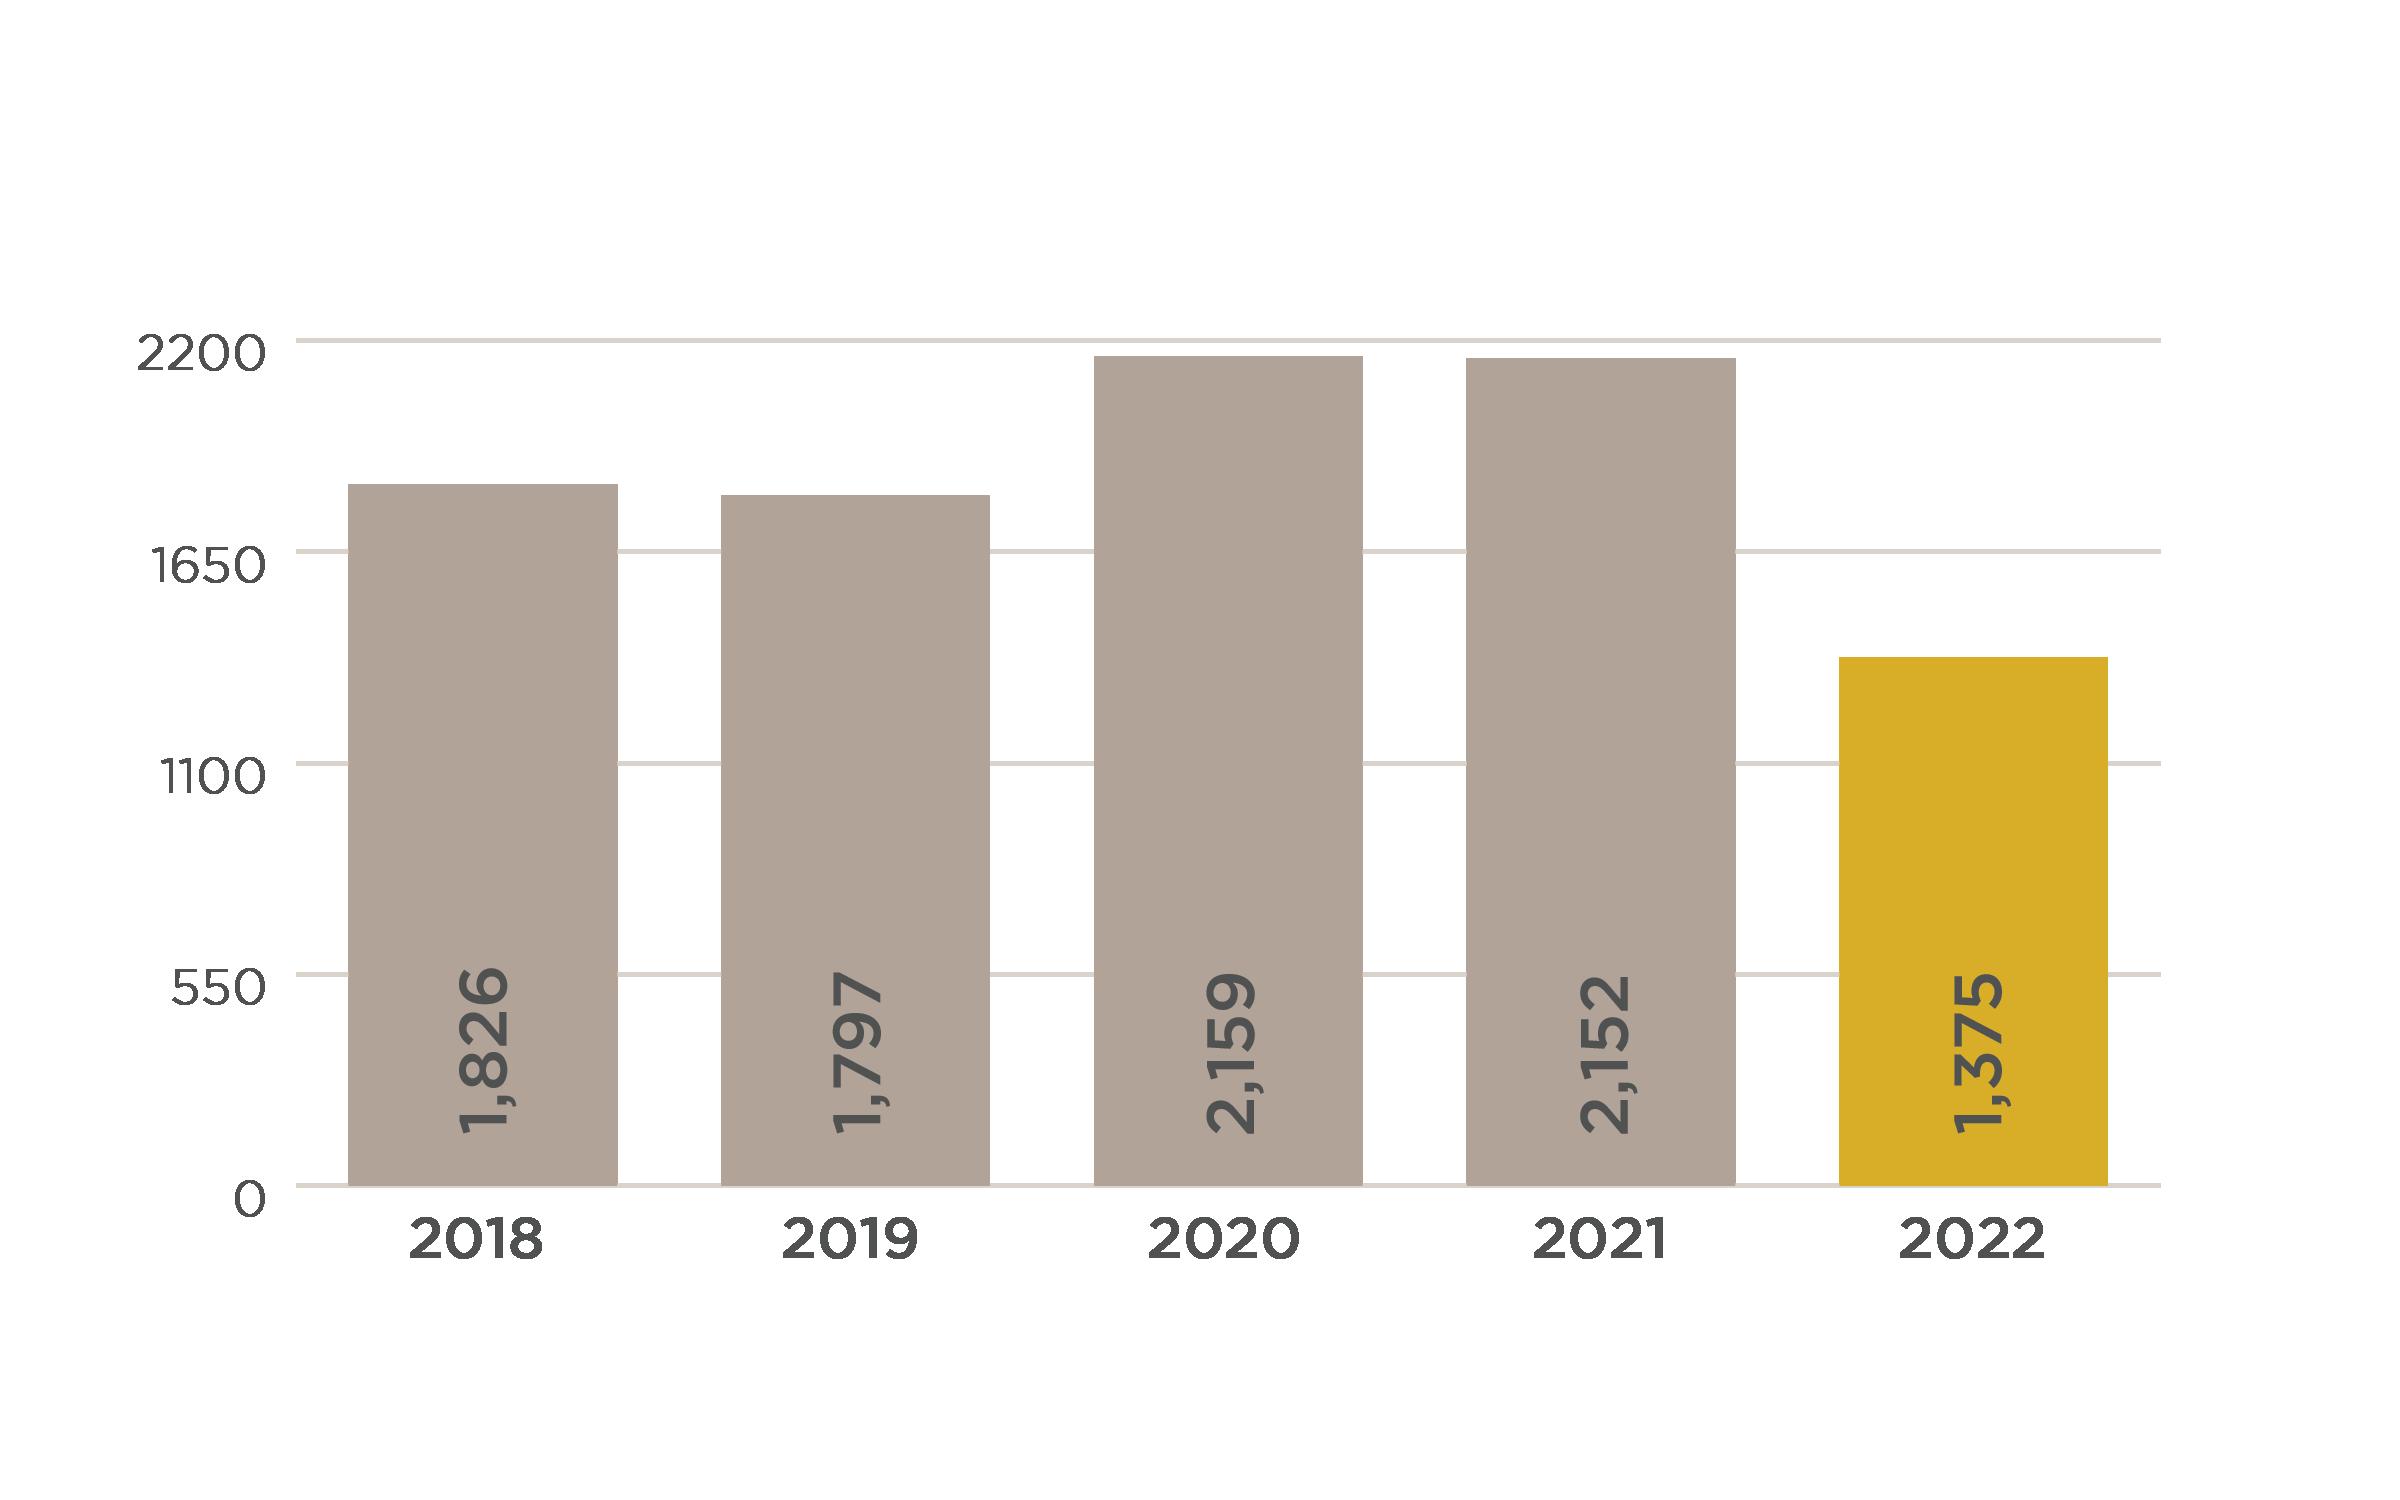
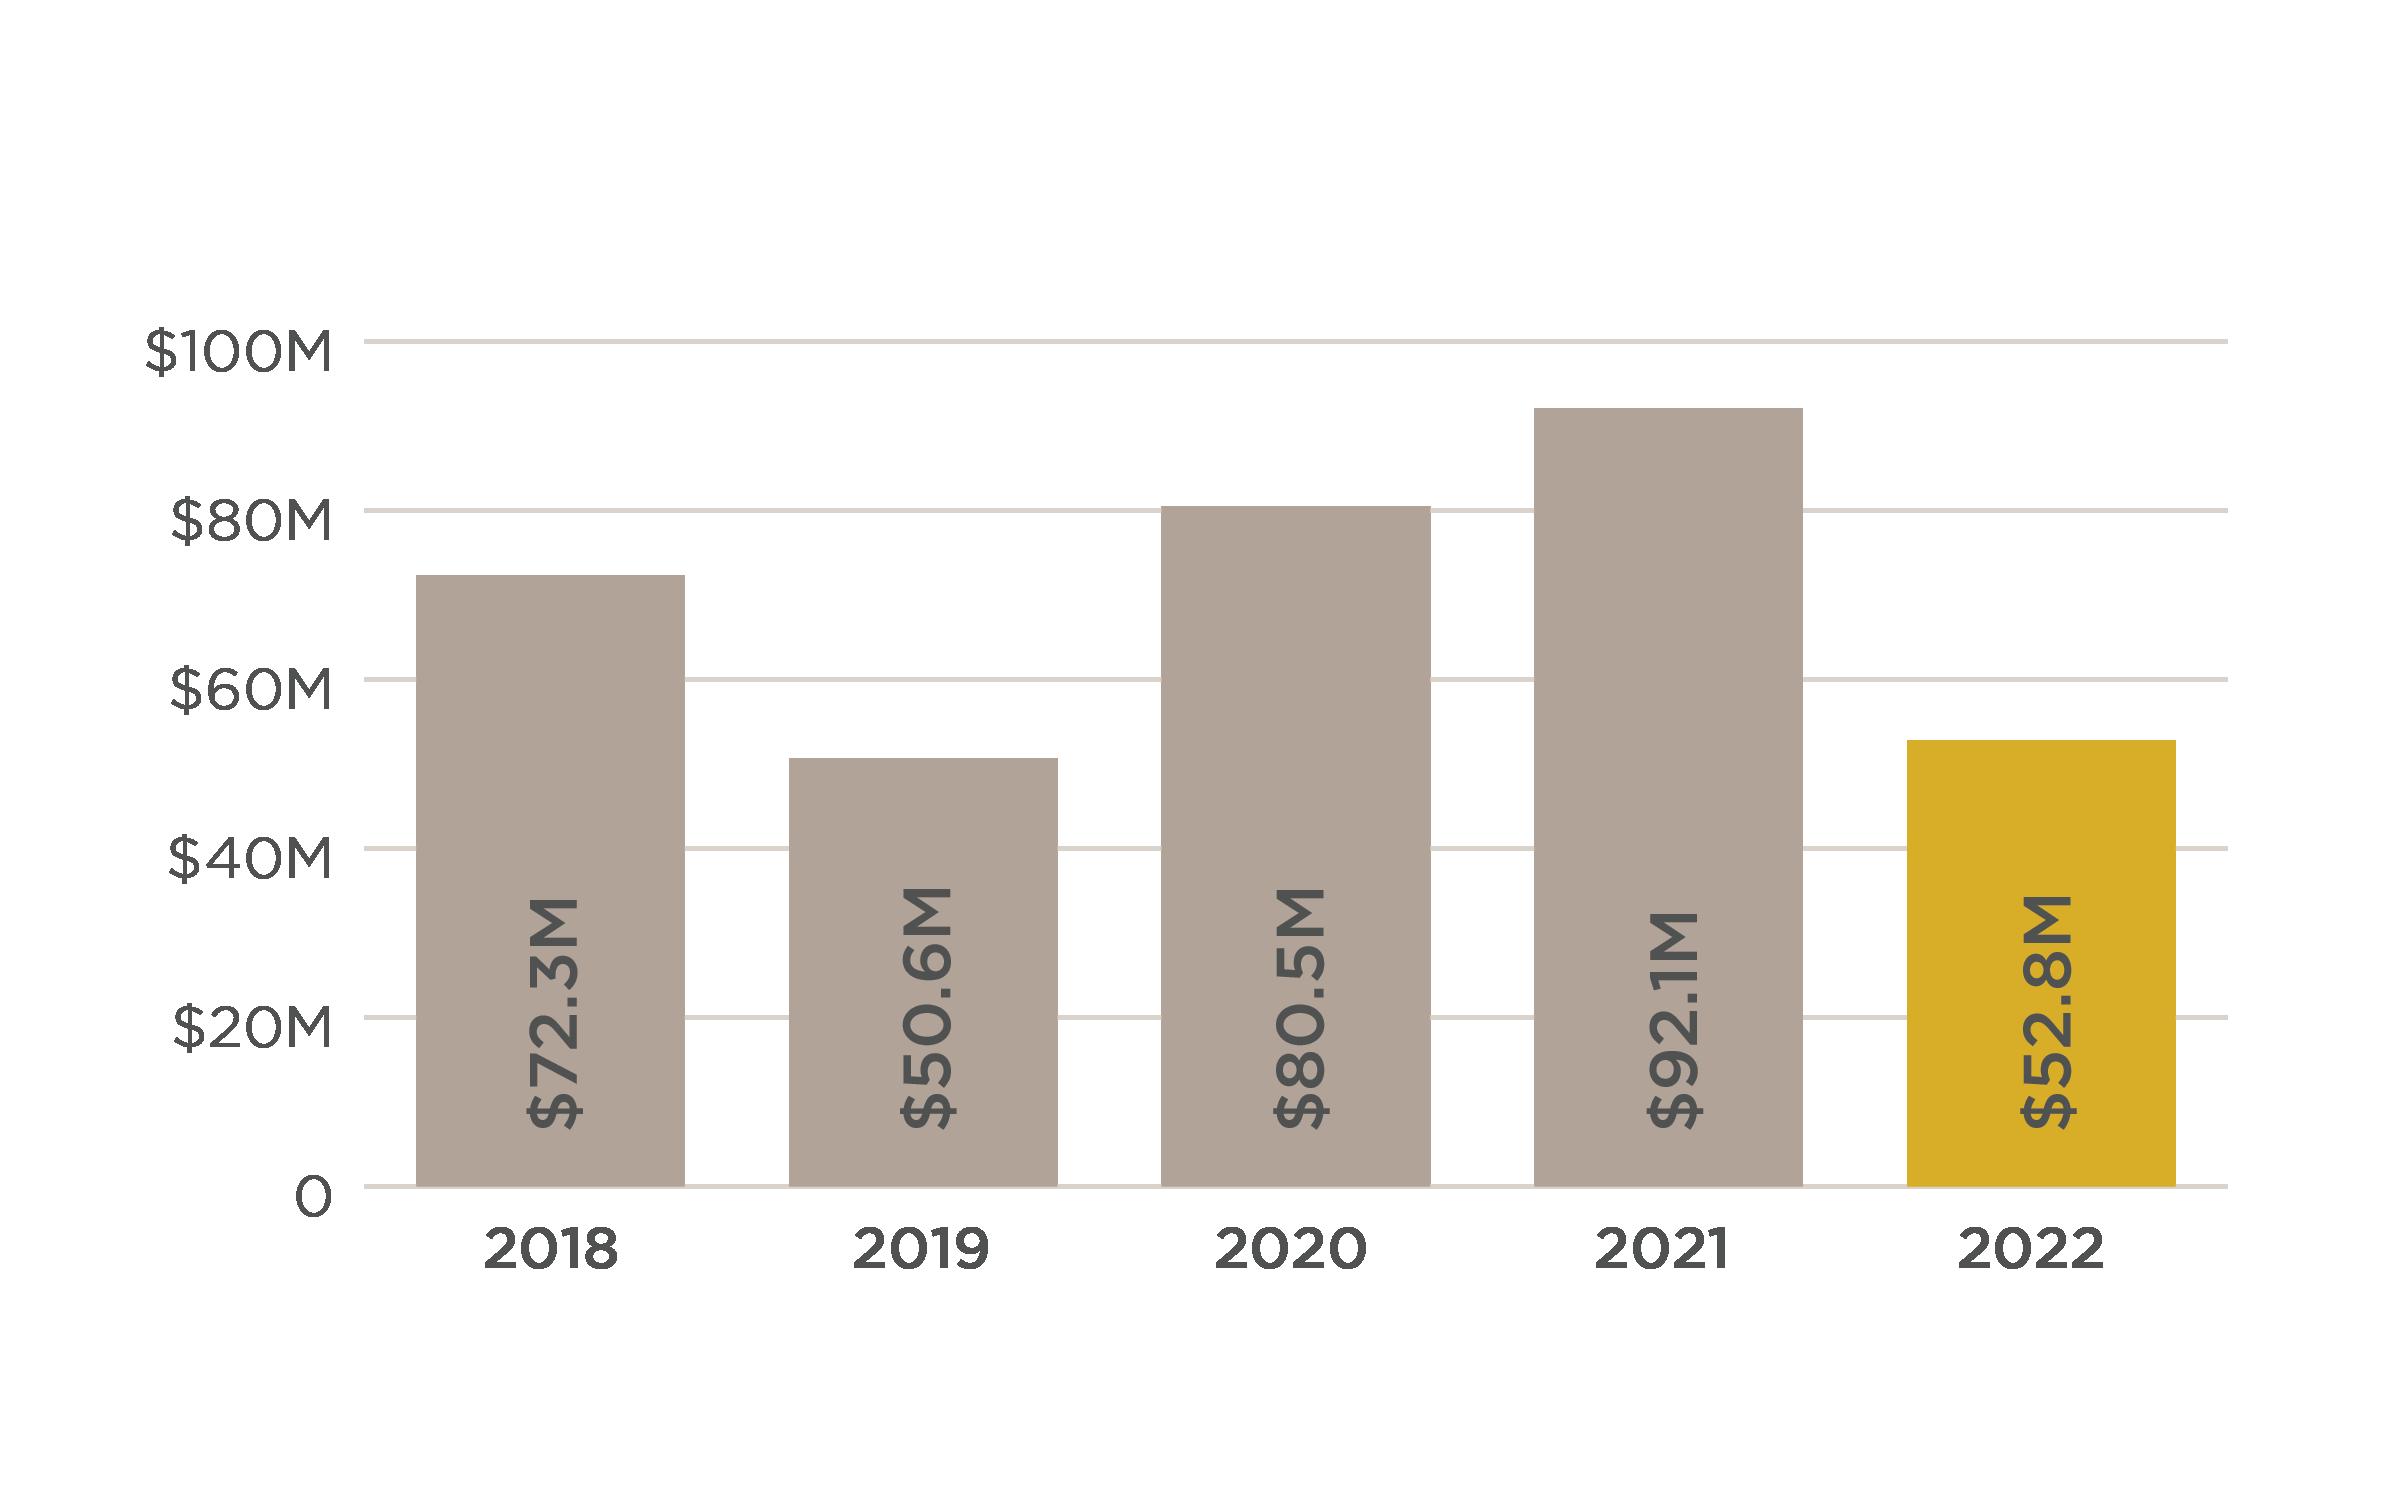
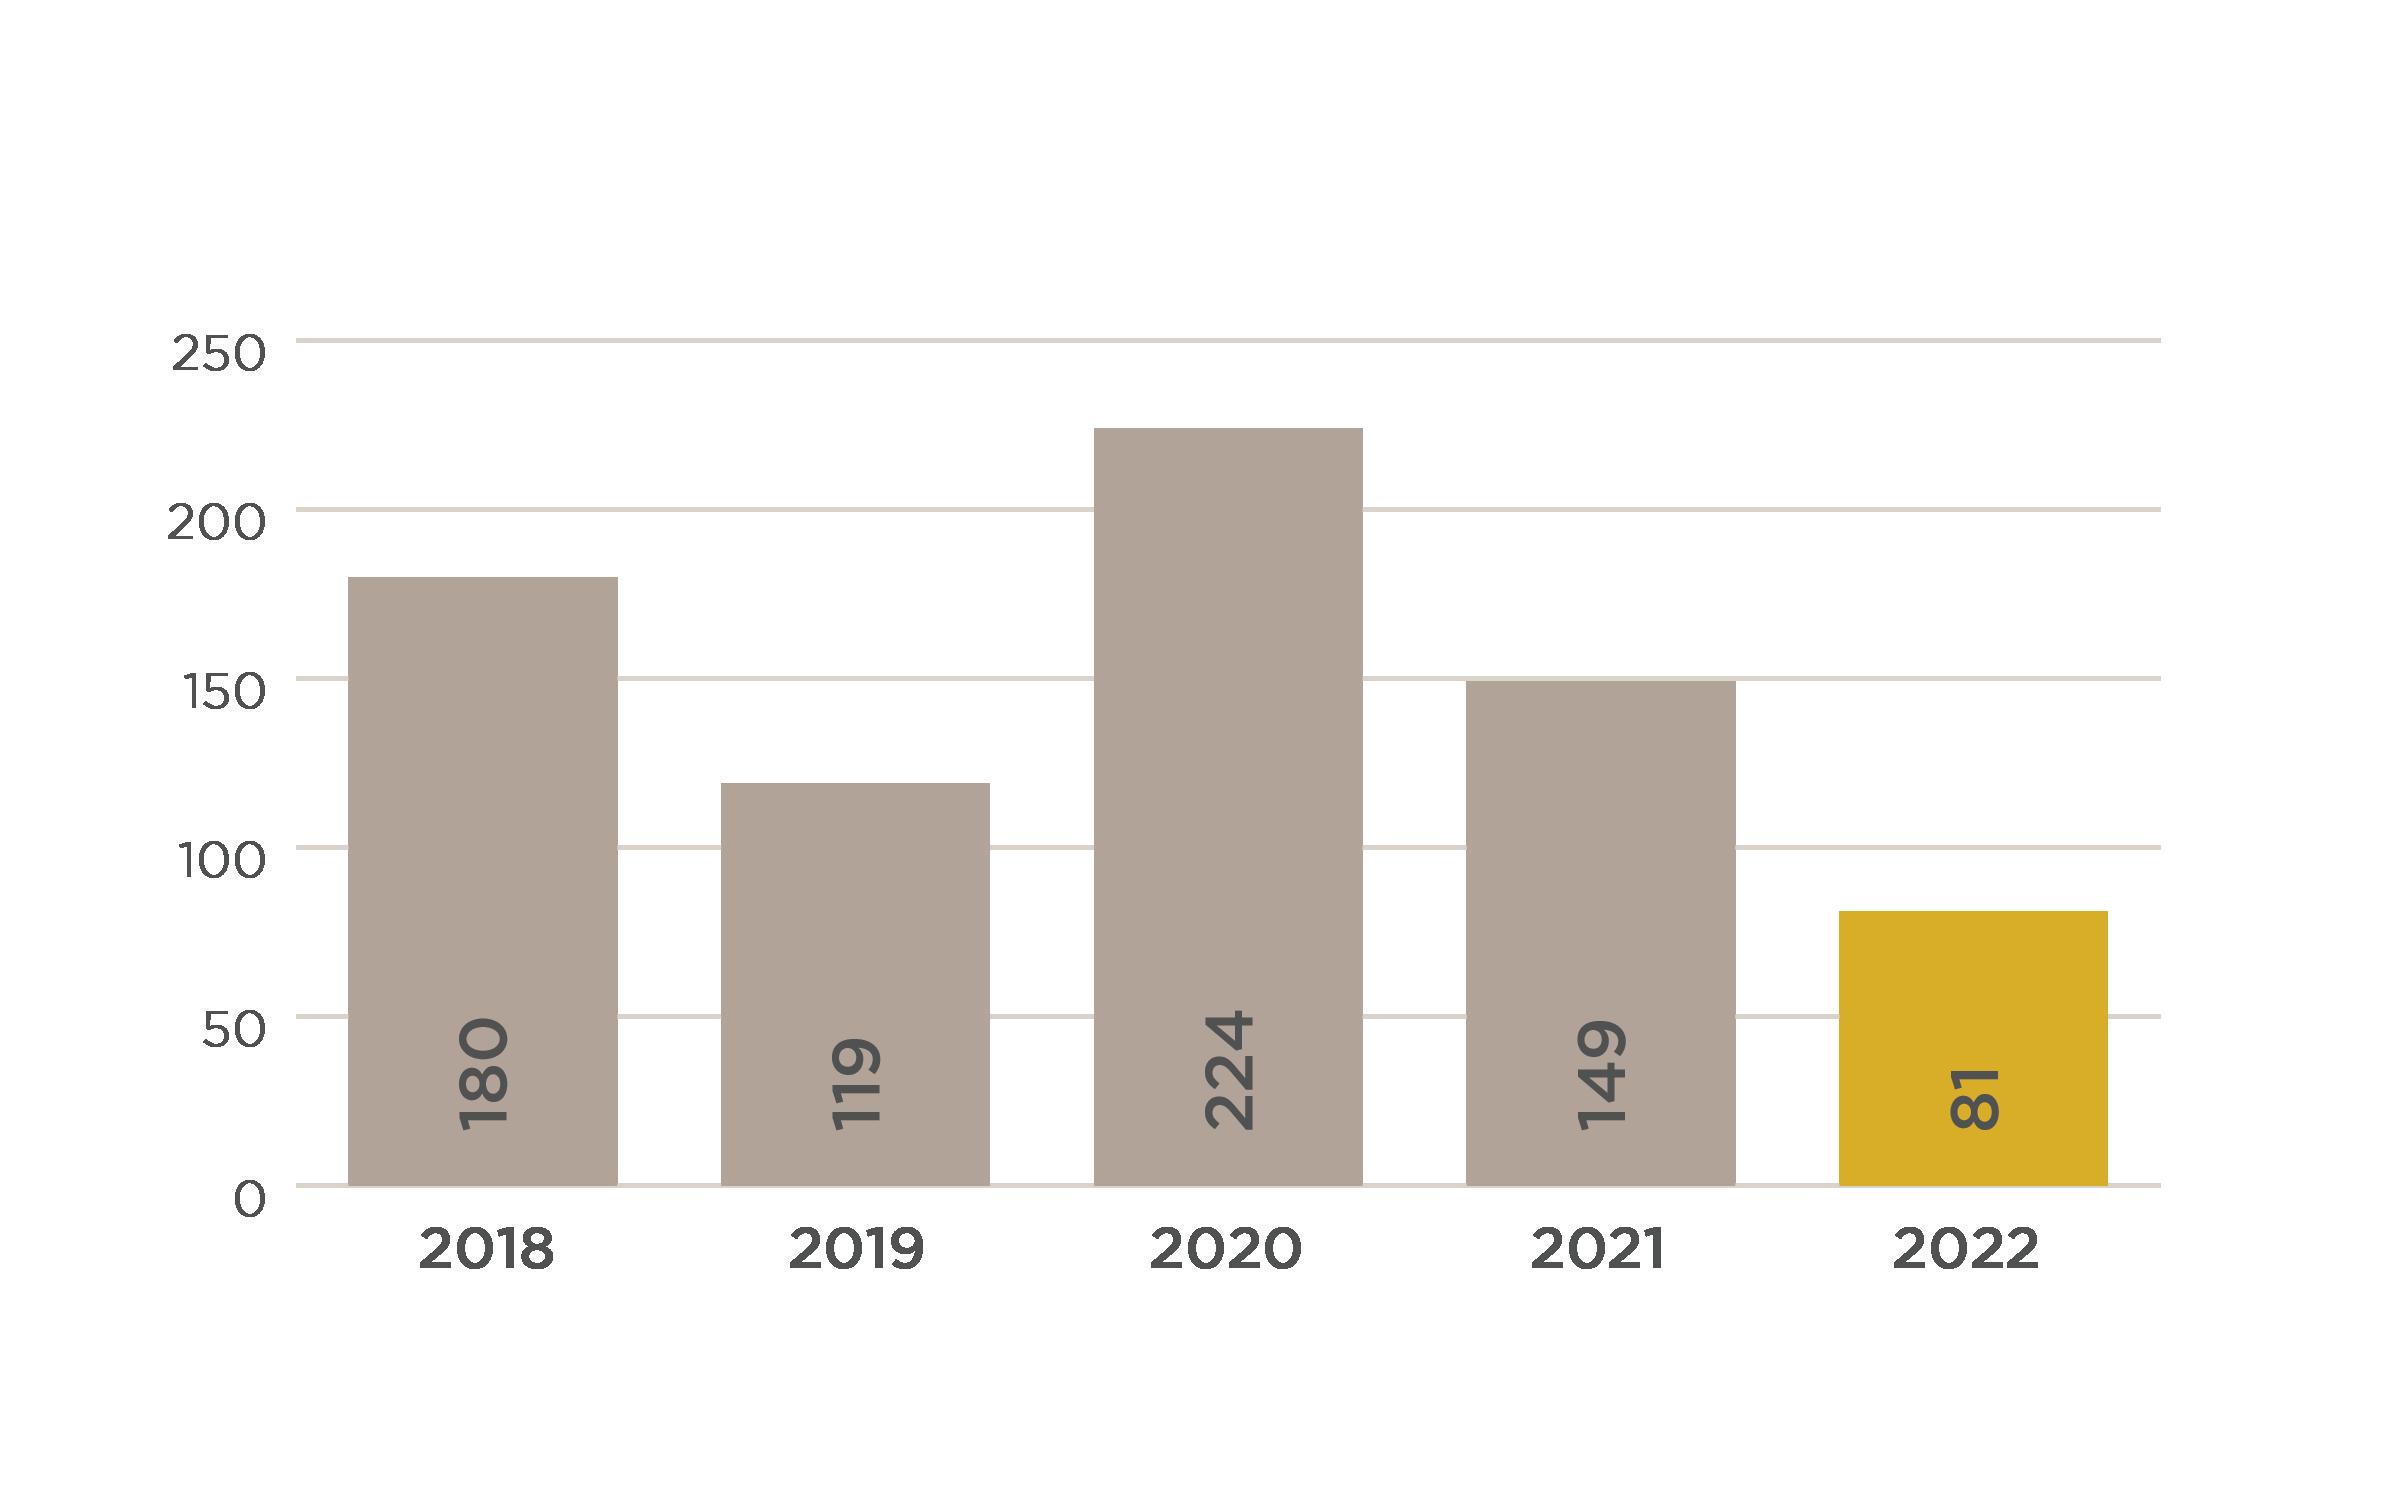
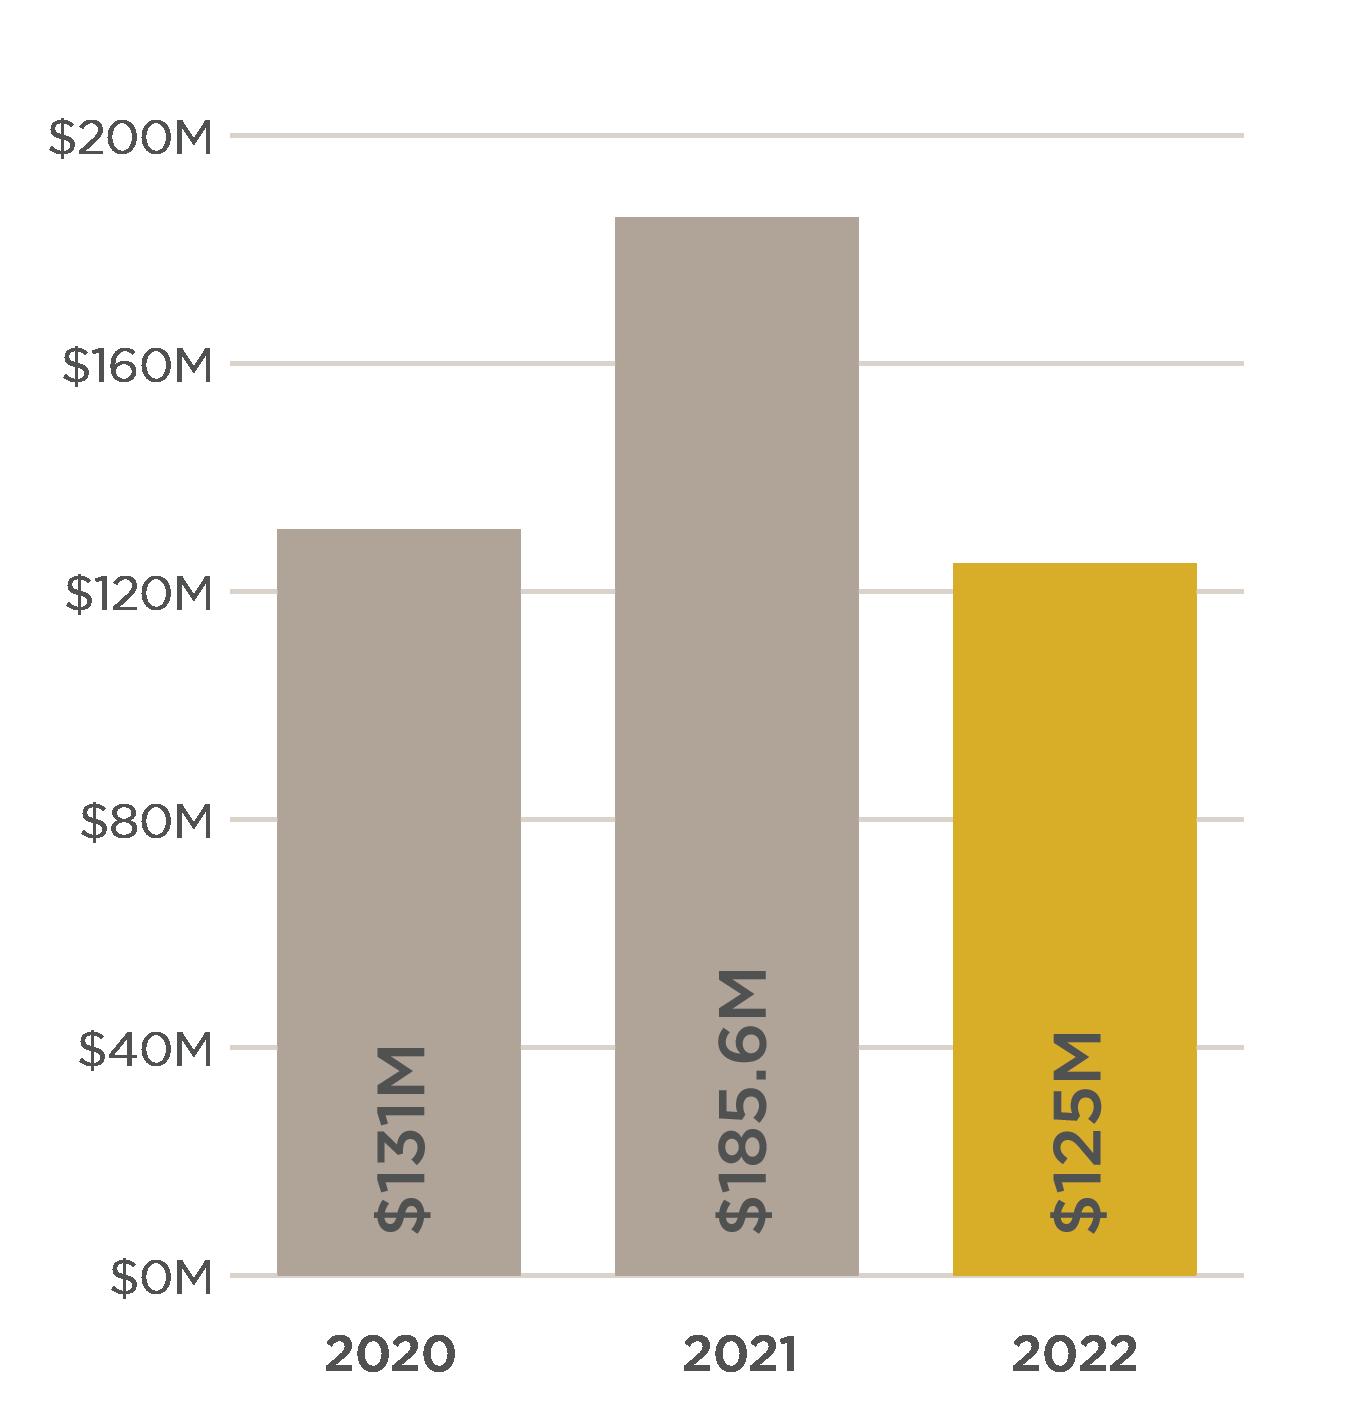
2018 $53,860,400 64 38 $841,569 $790,833 2019 $60,951,720 71 45 $858,475 $781,500 2020 $57,883,525 60 47 $964,725 $860,000 2021 $100,581,291 83 17 $1,211,823 $1,150,000 2022 $59,967,205 44 20 $1,362,891 $1,292,500
CONDOMINIUM
TOW NHOME SALES VOLUME NO OF SALES AVG DAYS ON MARKET AVG SALE MEDIAN SALE
&
2018 $42,160,820 109 16 $386,797 $355,000 2019 $61,805,108 150 33 $412,034 $361,000 2020 $68,201,392 150 70 $454,676 $416,500 2021 $80,894,474 142 10 $569,679 $505,500 2022 $60,888,066 90 18 $676,534 $545,000
Slifer Smith & Frampton Real Estate | 14 DILLON
AVERAGE PRICE PER SQUARE FOOT SALE VS. LIST PRICE COMPARISON 2018 2019 2020 2021 2022 Single Family & Duplex $310 $343 $371 $488 $575 Condominium & Townhome $422 $451 $470 $602 $740 AVERAGE SALE / LAST LISTED PRICE Single Family & Duplex 100% Condominium & Townhome 101% SALES VOLUME COMPARISON VS2021 23% Increasein averagepriceper Sq.Ft. -Condo/TH 12% Increasein averagesold price -SF/Duplex AREA highlights
SINGLE FAMILY & DUPLEX
SALES VOLUME
NO OF SALES AVG DAYS ON MARKET AVG SALE MEDIAN SALE
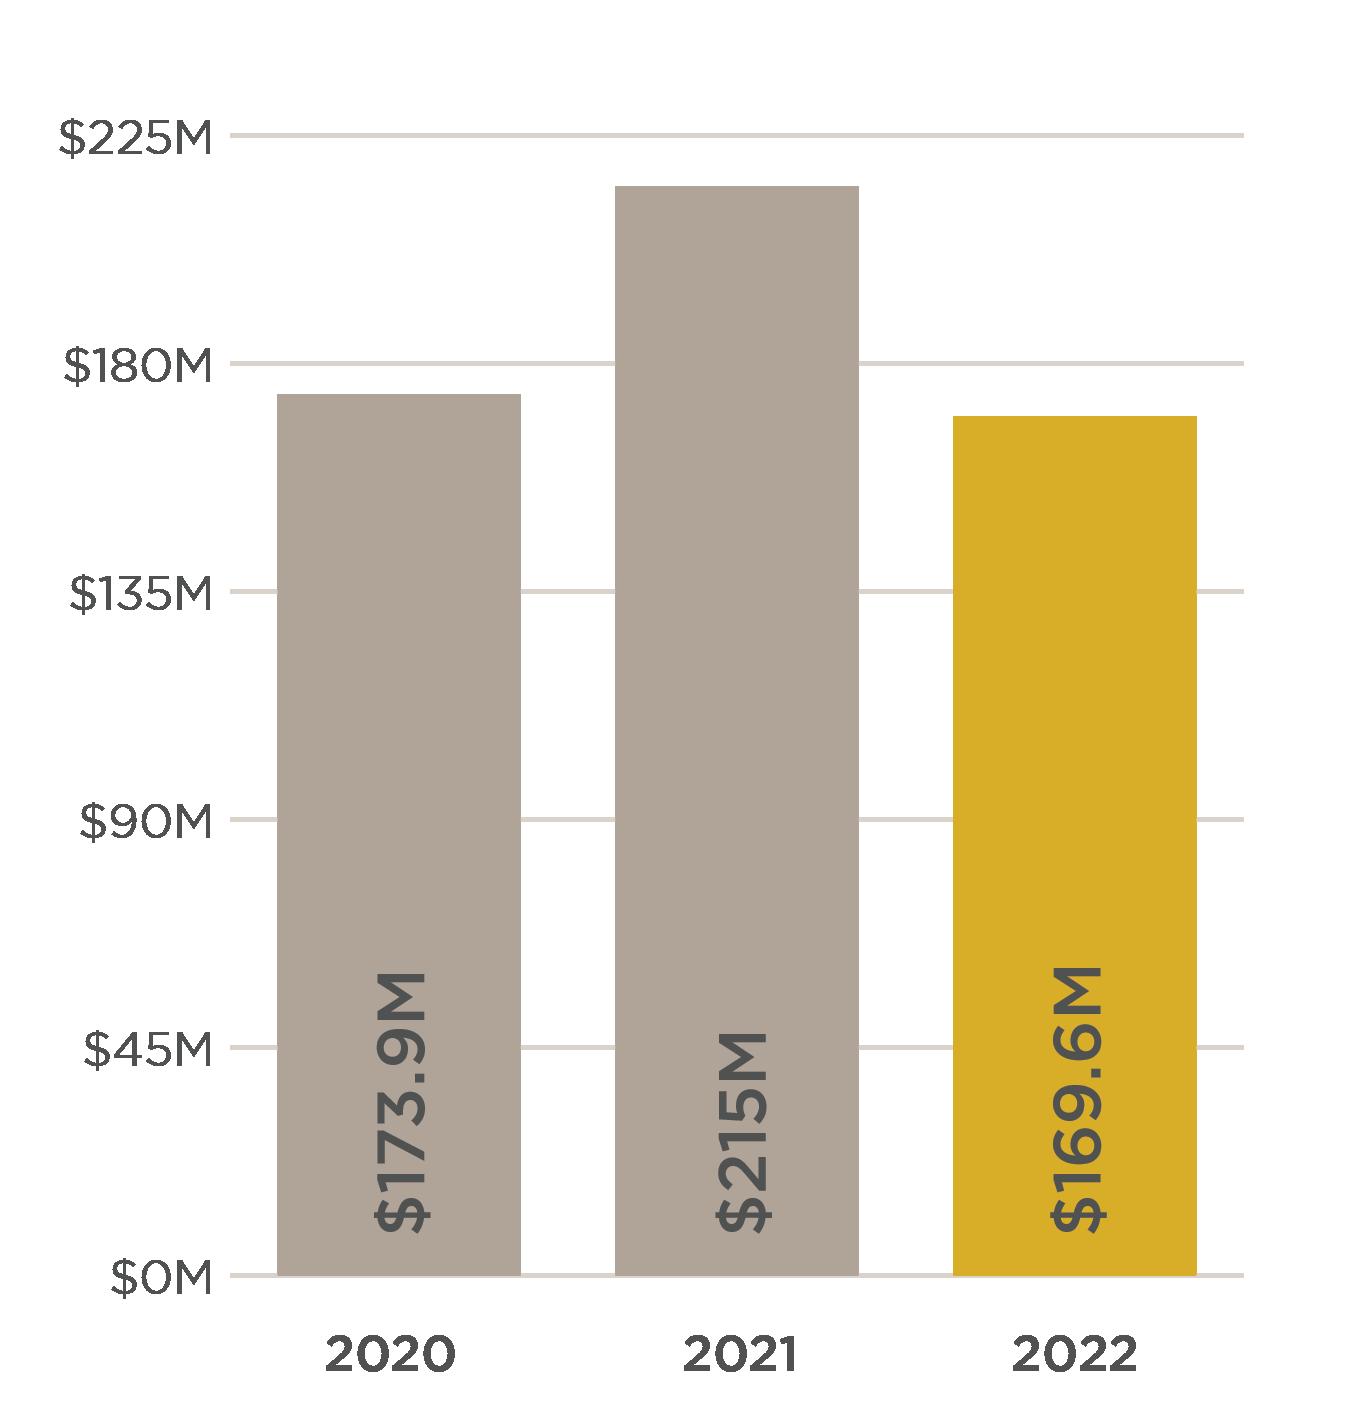
2018 $65,430,650 56 47 $1,168,404 $1,113,750 2019 $44,341,500 41 54 $1,081,500 $1,050,000
2020 $76,014,151 60 60 $1,266,903 $1,285,000 2021 $96,648,521 59 10 $1,638,111 $1,595,000 2022 $68,642,090 40 31 $1,716,052 $1,650,000
CONDOMINIUM & TOW NHOME
SALES VOLUME NO OF SALES AVG DAYS ON MARKET AVG SALE MEDIAN SALE
2018 $61,270,284 106 32 $578,022 $535,000 2019 $78,482,192 129 34 $608,389 $545,000 2020 $96,073,897 147 28 $653,564 $600,000 2021 $112,661,963 141 10 $799,021 $740,000 2022 $99,460,414 93 15 $1,069,467 $975,000
The Slifer Report 2023 | 15 FRISCO
AVERAGE PRICE PER SQUARE FOOT SALE VS. LIST PRICE COMPARISON 2018 2019 2020 2021 2022 Single Family & Duplex $436 $449 $485 $647 $726 Condominium & Townhome $504 $525 $560 $706 $813 AVERAGE SALE / LAST LISTED PRICE Single Family & Duplex 97% Condominium & Townhome 102% SALES VOLUME COMPARISON AREA highlights VS2021 34% Increasein averagesales price -Condo/TH 12% Increasein averageprice per Sq.Ft. -SF/Duplex
SINGLE FAMILY & DUPLEX
SALES VOLUME NO OF SALES AVG DAYS ON MARKET AVG SALE MEDIAN SALE
2018 $47,767,540 32 100 $1,492,736 $1,343,750 2019 $36,413,708 25 115 $1,456,548 $1,250,000 2020 $66,587,000 40 73 $1,664,675 $1,534,500 2021 $74,519,401 41 42 $1,817,546 $1,582,500 2022 $57,065,145 24 25 $2,377,714 $2,387,500
& TOW NHOME
2018 $161,784,551 295 51 $548,422 $500,000 2019 $141,365,421 249 52 $567,733 $535,000 2020 $153,507,924 264 68 $581,469 $545,000 2021 $175,902,684 256 38 $687,120 $637,000 2022 $187,066,551 217 18 $862,058 $778,000
Slifer Smith & Frampton Real Estate | 16 KEYSTONE
CONDOMINIUM
SALES VOLUME NO OF SALES AVG DAYS ON MARKET AVG SALE MEDIAN SALE
AVERAGE PRICE PER SQUARE FOOT SALE VS. LIST PRICE COMPARISON 2018 2019 2020 2021 2022 Single Family & Duplex $381 $375 $429 $540 $731 Condominium & Townhome $498 $519 $547 $683 $822 AVERAGE SALE / LAST LISTED PRICE Single Family & Duplex 97% Condominium & Townhome 100% SALES VOLUME COMPARISON VS2021 40% Decreasein averagedayson market -SF/Duplex 53% Decreasein averagedayson market -Condo/TH AREA highlights
SILVERTHORNE
SINGLE FAMILY & DUPLEX
SALES VOLUME
NO OF SALES AVG DAYS ON MARKET AVG SALE MEDIAN SALE
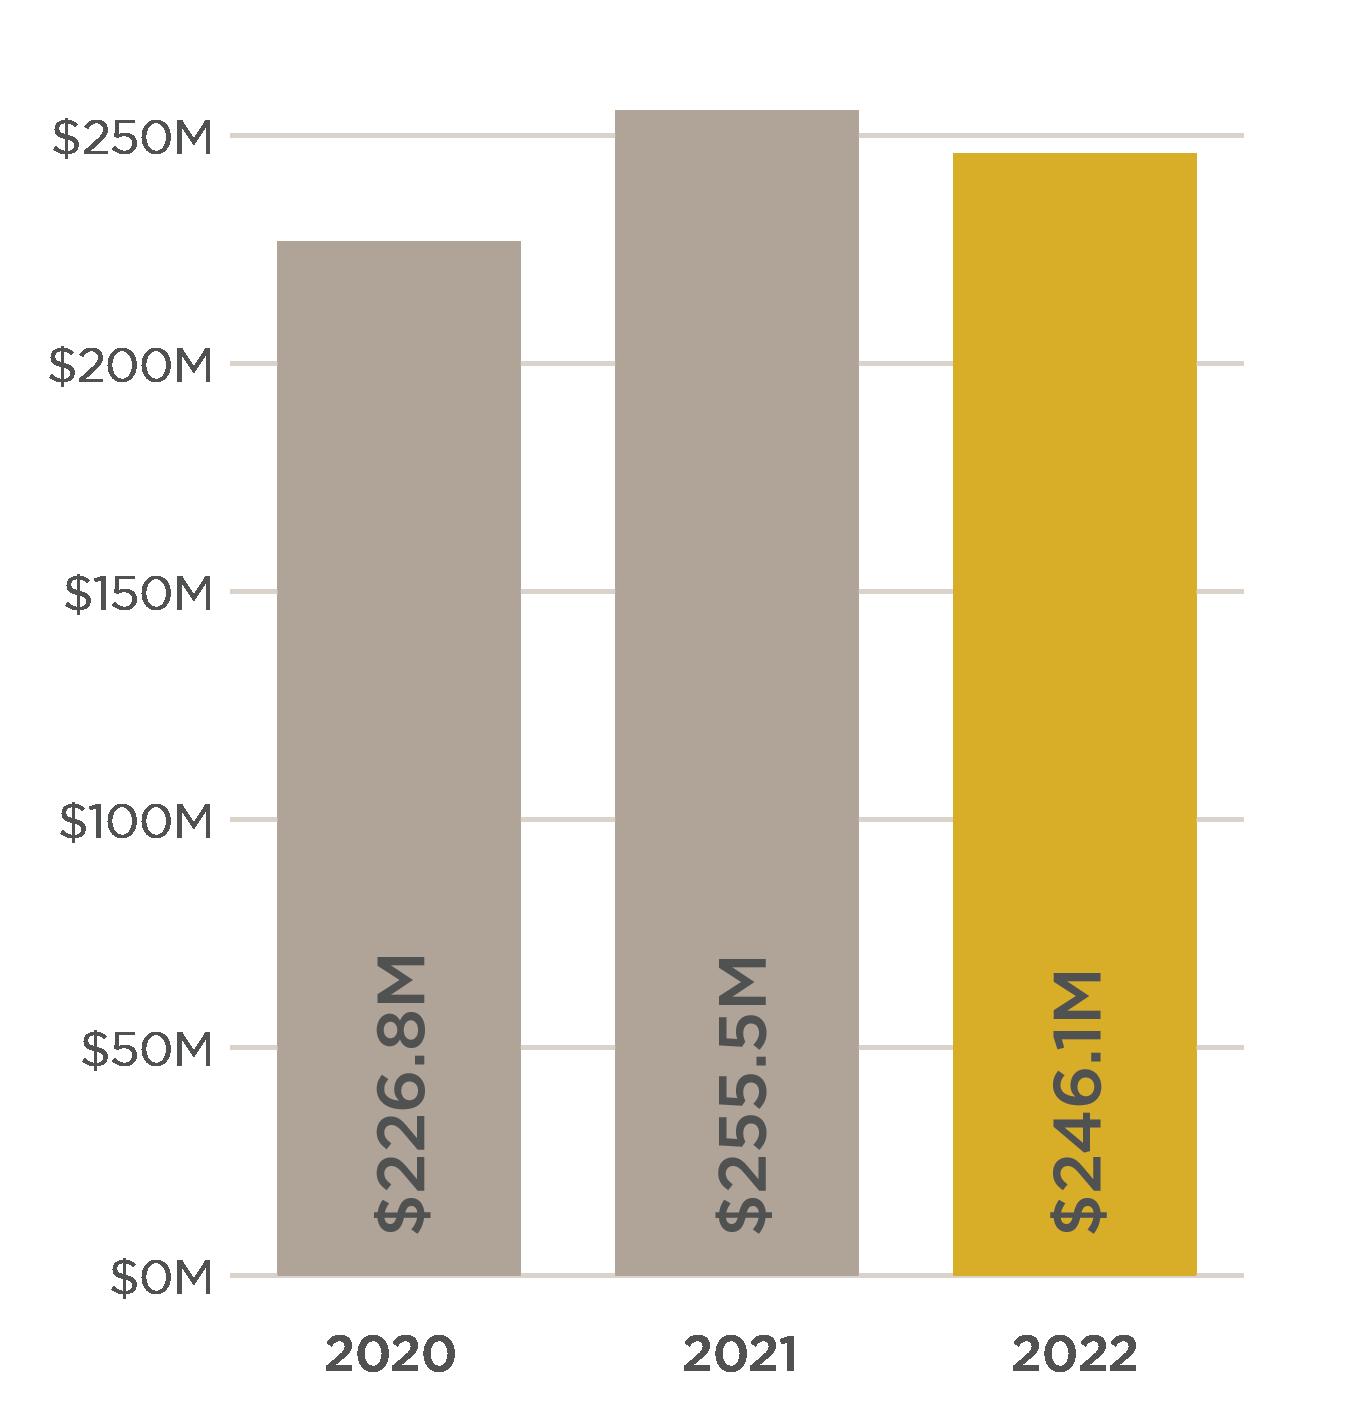
2018 $166,281,878 188 68 $884,478 $791,000 2019 $186,583,408 195 51 $956,838 $870,000
2020 $284,789,182 261 61 $1,091,146 $1,000,179 2021 $333,272,817 243 32 $1,371,493 $1,270,000 2022 $298,967,200 179 37 $1,670,208 $1,600,000
CONDOMINIUM & TOW NHOME
SALES VOLUME NO OF SALES AVG DAYS ON MARKET AVG SALE MEDIAN SALE
2018 $70,252,509 162 17 $433,657 $388,750 2019 $107,772,670 238 51 $452,826 $399,337 2020 $134,481,159 268 47 $501,795 $450,000 2021 $166,334,471 268 30 $620,651 $580,500 2022 $131,509,194 182 26 $722,578 $679,875
The Slifer Report 2023 | 17
AVERAGE PRICE PER SQUARE FOOT SALE VS. LIST PRICE COMPARISON 2018 2019 2020 2021 2022 Single Family & Duplex $361 $380 $419 $528 $589 Condominium & Townhome $394 $414 $448 $573 $645 AVERAGE SALE / LAST LISTED PRICE Single Family & Duplex 100% Condominium & Townhome 100% SALES VOLUME COMPARISON AREA highlights VS2021 22% Increasein averagesales price -SF/Duplex 13% Decreasein averagedayson market -Condo/TH