Local Market Update November 2022
Aresearchtool provided bytheColorado Associationof REALTORS® and the Aspen Board of Realtors

November Year to Date
New Listings 6 4 -33 3% 71 68 -4 2% -3 1% 4 6 +50 0% 67 34 -49 3%
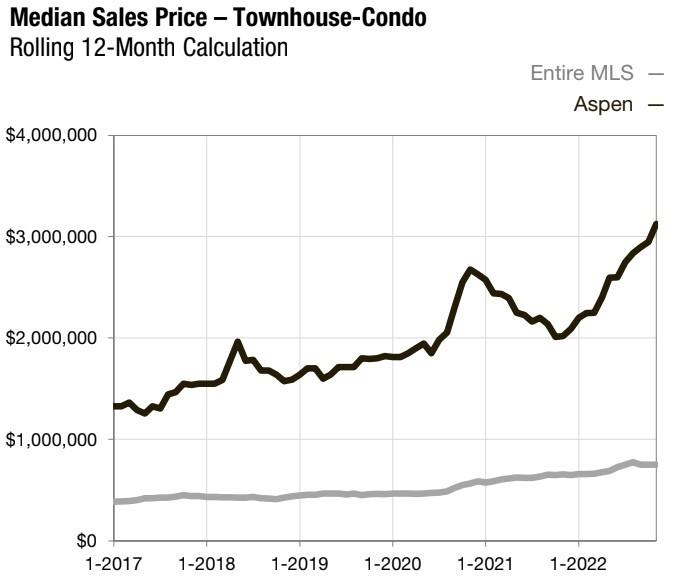
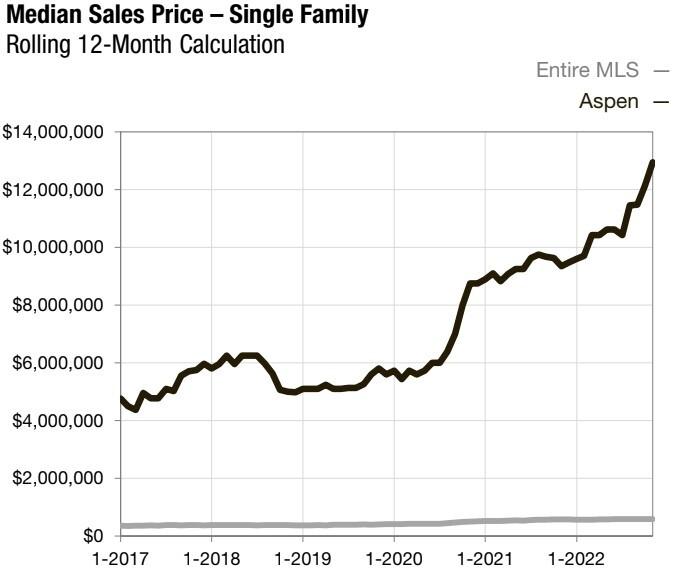
Median Sales Price $3,012,500 $1,450,000 -51 9% $1,495,000 $1,595,000 +6 7% Average Sales Price $4,650,000 $2,659,167 -42 8% $2,078,887 $2,011,529 -3 2% %of List Price Received 95 2% 94 2% -1 1% 96 1% 96 3% +0 2% Days on Market 120 18 -85 0% 111 52 -53 2% Inventory of Homes for Sale 18 22 +22 2% -- -- -Months Supply of Inventory 3 0 6 1 +103 3% -- -- --
November Year to Date
New Listings 11 5 -54 5% 102 96 -5 9% Sold Listings 10 2 -80 0% 82 76 -7 3%
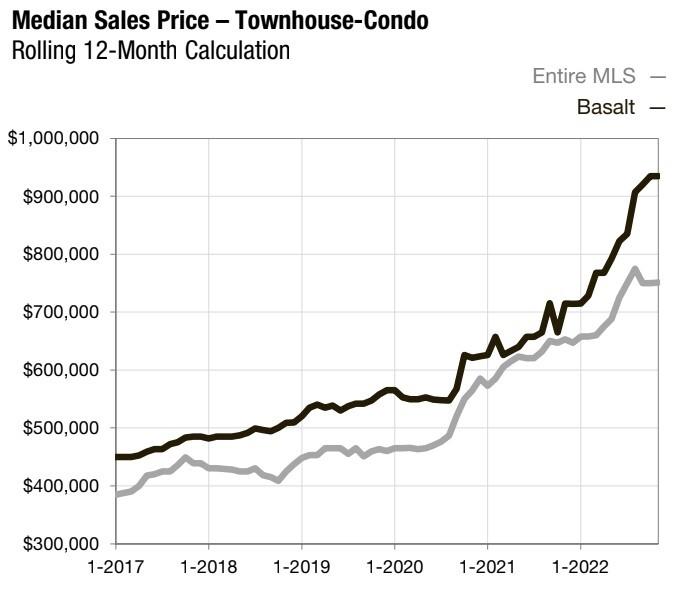
Median Sales Price $862,500 $1,364,727 +58 2% $714,500 $955,000 +33 7% Average Sales Price $1,166,000 $1,364,727 +17 0% $828,996 $1,175,789 +41 5% %of List Price Received 99 7% 99 2% -0 5% 99 6% 100 5% +0 9% Days on Market 27 43 +59 3% 44 32 -27 3% Inventory of Homes for Sale 13 26 +100 0% -- -- -Months Supply of Inventory 1 8 3 9 +116 7% -- -- --
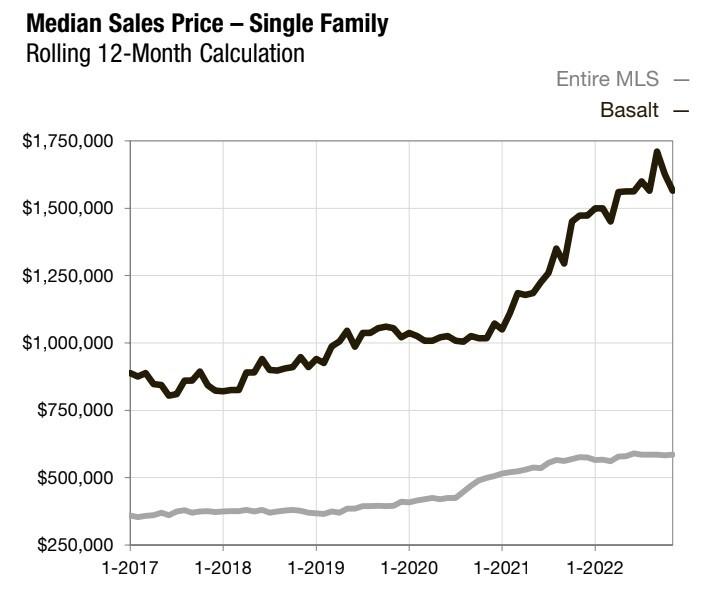
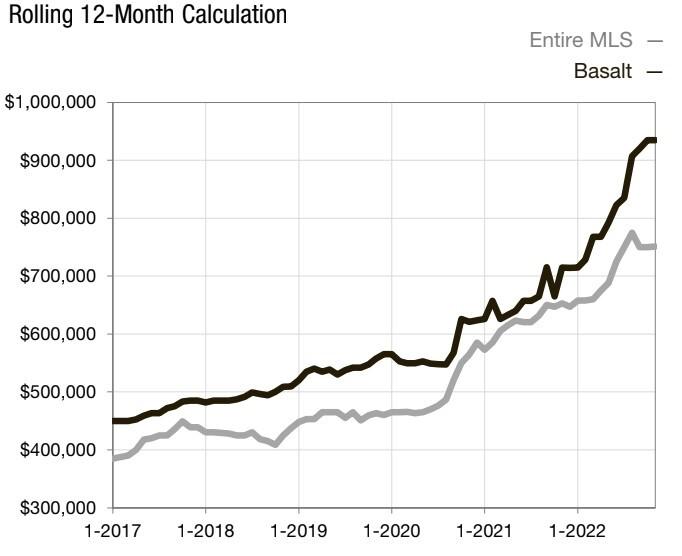
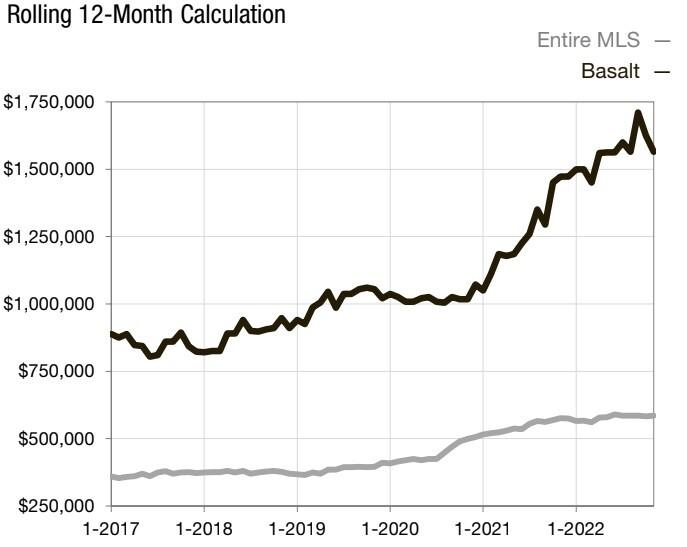
BASALT 2021 2022 % Change 2021 2022 % Change
2021 2022 % Change 2021 2022 % Change
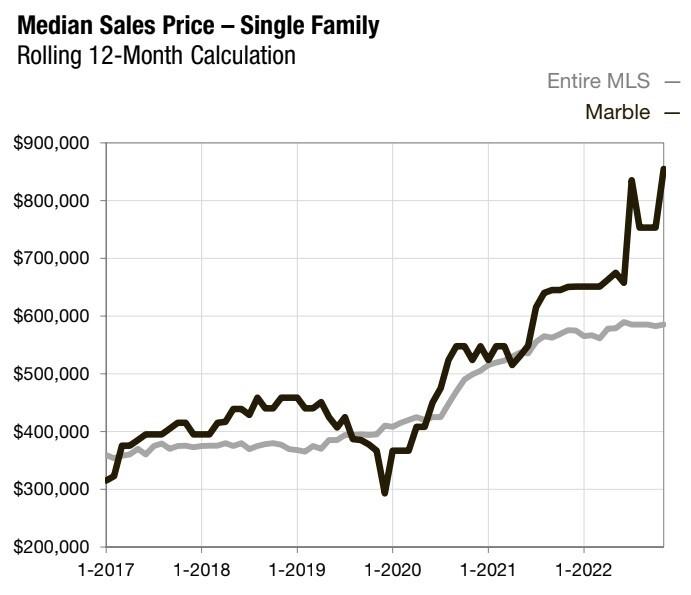
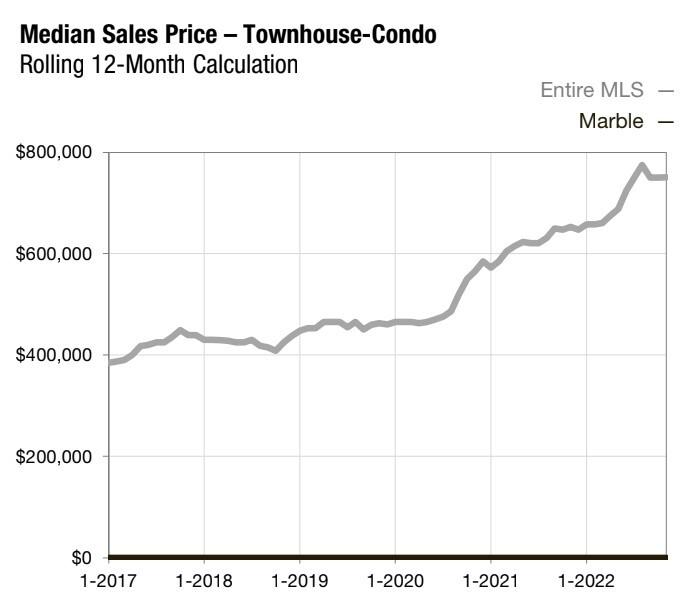
Med ian Sales Pr ice- Sing le Fam ily Rolling 12-Month Calculation Med ian Sales Pr ice- Tow nho use/ Co nd o Rolling 12-Month Calculation Current asof December 5, 2022 All data from the Aspen/Glenwood SpringsMLSInc Report © 2022 ShowingTime
Townhouse/ Condo Single Family
November Year to Date
to
Local Market Update November 2022 Aresearchtool provided bytheColorado Associationof REALTORS® and the Aspen Board of Realtors CARBONDALE 2021 2022 % Change 2021 2022 % Change New Listings 12 3 -75 0% 223 193 -13 5% Sold Listings 20 14 -30 0% 197 126 -36 0% Median Sales Price $984,743 $1,275,000 +29 5% $1,200,000 $1,525,000 +27 1% Average Sales Price $1,224,844 $1,493,821 +22 0% $1,416,531 $1,876,094 +32 4% %of List Price Received 97 5% 96 2% -1 3% 97 7% 97 5% -0 2% Days on Market 37 108 +191 9% 54 81 +50 0% Inventory of Homes for 52 48 -7 7% -- -- -Months Supply of Inventory 2 8 4 1 +46 4% -- -- --
2021 2022 % Change 2021 2022 % Change New Listings 3 2 -33 3% 86 73 -15 1% Sold Listings 4 4 0 0% 98 60 -38 8%
Med ian Sales Pr ice- Sing le Fam ily Rolling 12-Month Calculation Med ian Sales Pr ice- Tow nho use/ Co nd o Rolling 12-Month Calculation Current asof December 5, 2022 All data from the Aspen/Glenwood SpringsMLSInc Report © 2022 ShowingTime
Median Sales Price $580,000 $687,500 +18 5% $620,000 $870,500 +40 4% Average Sales Price $572,500 $837,500 +46 3% $697,727 $981,835 +40 7% %of List Price Received 99 9% 100 0% +0 1% 100 0% 99 6% -0 4% Days on Market 106 139 +31 1% 54 47 -13 0% Inventory of Homes for Sale 7 18 +157 1% -- -- -Months Supply of Inventory 0 8 3 1 +287 5% -- -- -November Year
Date Townhouse/ Condo Single Family
November Year to Date
to
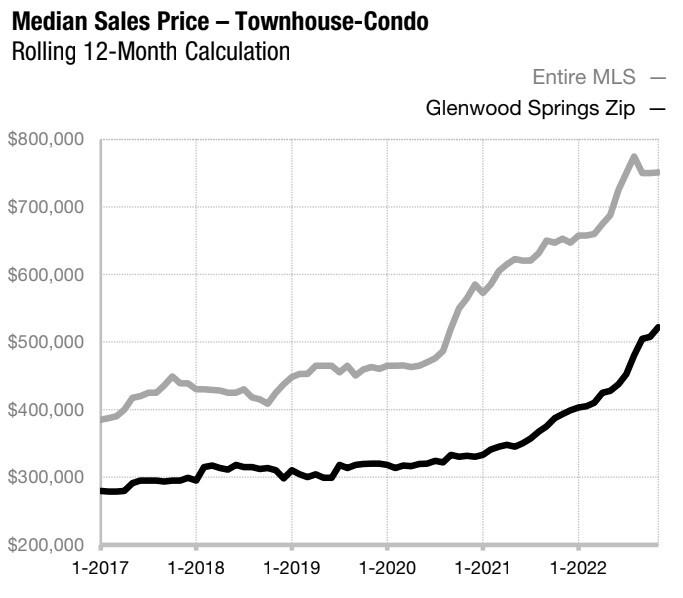
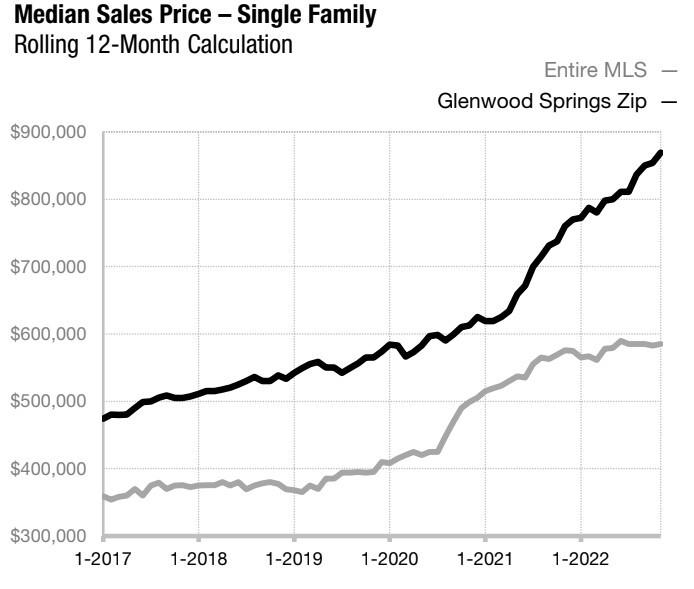
Local Market Update November 2022 Aresearchtool provided bytheColorado Associationof REALTORS® and the Aspen Board of Realtors GLENW OOD SPRINGS 2021 2022 % Change 2021 2022 % Change
New Listings 11 5 -54 5% 226 197 -12 8% Sold Listings 17 10 -41 2% 208 153 -26 4% Median Sales Price $835,000 $984,500 +17 9% $766,449 $855,000 +11 6% Average Sales Price $877,954 $989,100 +12 7% $836,816 $969,073 +15 8% %of List Price Received 98 4% 94 8% -3 7% 99 3% 98 1% -1 2% Days on Market 36 44 +22 2% 36 50 +38 9% Inventory of Homes for Sale 36 36 0 0% -- -- -Months Supply of Inventory 1 9 2 6 +36 8% -- -- --
2021 2022 % Change 2021 2022 % Change New Listings 10 4 -60 0% 96 80 -16 7% Sold Listings 6 0 -100 0% 82 84 +2 4%
Med ian Sales Pr ice- Sing le Fam ily Rolling 12-Month Calculation Med ian Sales Pr ice- Tow nho use/ Co nd o Rolling 12-Month Calculation Current asof December 5, 2022 All data from the Aspen/Glenwood SpringsMLSInc Report © 2022 ShowingTime
Median Sales Price $407,500 $0 -100 0% $395,000 $532,500 +34 8% Average Sales Price $373,333 0 0% -100 0% $394,678 $532,097 +34 8% %of List Price Received 100 0% 0 0% -100 0% 100 2% 98 8% -1 4% Days on Market 18 0 -100 0% 24 57 +137 5% Inventory of Homes for Sale 15 9 -40 0% -- -- -Months Supply of Inventory 2 1 1 0 -52 4% -- -- -November Year
Date Townhouse/ Condo Single Family
November 2022
2021 2022 % Change 2021 2022 % Change
Listings 0 0 --
Sold Listings 1 1 0 0% 7
Sales Price $675,000 $1,482,500
Sales Price $675,000
%of List Price Received 103 8% 99 5%
99
98
Days
Market 129 97
Inventory
Sale 2 2
Months Supply
Inventory 1 8 1 3
8% --
2021 2022 % Change 2021 2022 % Change
Listings 0 0
Sold Listings 0 0
Sales Price $0 $0
$0 $0
Average Sales Price $0 $0 -- $0 $0
%of List Price Received 0 0% 0 0% -- 0
Days
0
Inventory
Homes
Sale 0 0
Months Supply of Inventory 0 0 0 0 -- --
November
Date
Med ian Sales Pr ice- Sing le Fam ily Rolling 12-Month Calculation Med ian Sales Pr ice- Tow nho use/ Co nd o Rolling 12-Month Calculation Current asof December 5, 2022 All data from the Aspen/Glenwood SpringsMLSInc Report © 2022 ShowingTime
Local Market Update
Aresearchtool provided bytheColorado Associationof REALTORS® and the Aspen Board of Realtors MARBLE
New
6 4 -33 3%
3 -57 1% Median
+119 6% $651,000 $855,000 +31 3% Average
$1,482,500 +119 6% $708,000 $1,030,167 +45 5%
-4 1%
8%
4% -1 4%
on
-24 8% 96 143 +49 0%
of Homes for
0 0% -- -- --
of
-27
-- -November Year to Date
New
-- 0 0 --
-- 0 0 -Median
--
--
--
0% 0 0% --
on Market
0 -- 0 0 --
of
for
-- -- -- --
-- --
Year to
Townhouse/ Condo Single Family
November Year to Date
Market Update November 2022 Aresearchtool provided bytheColorado Associationof REALTORS® and the Aspen
of Realtors
2021 2022 % Change 2021 2022 % Change New Listings 2 1 -50 0% 39 32 -17 9% Sold Listings 2 0 -100 0% 38 25 -34 2% Median Sales Price $925,000 $0 -100 0% $1,645,000 $1,712,500 +4 1% Average Sales Price $925,000 $0
0% $1,790,305 $2,203,047 +23
%of List Price Received 93 2% 0 0% -100 0% 96 3% 97 4% +1 1% Days on Market 43 0 -100 0% 97 121 +24 7% Inventory of Homes for Sale 10 9 -10 0% -- -- -Months Supply of Inventory 2 7 3 1 +14 8% -- -- --
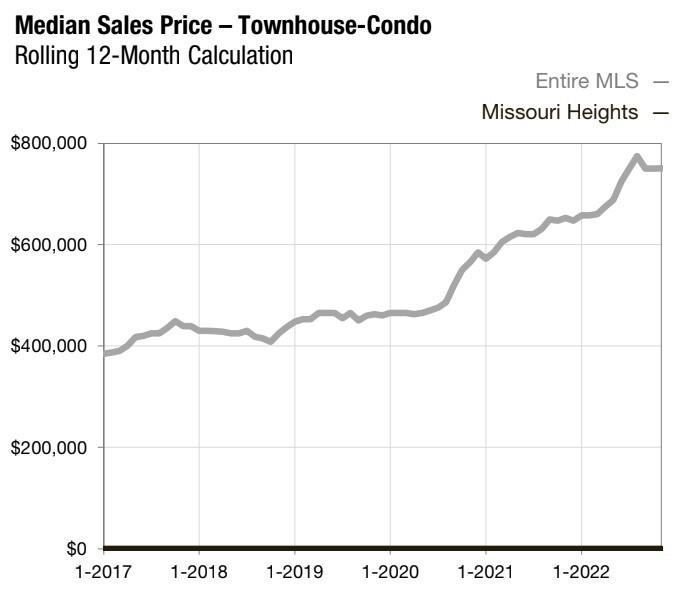
2021 2022 % Change 2021 2022 % Change New Listings 0 0 -- 0 0 -Sold Listings 0 0 -- 0 0 -Median Sales Price $0 $0 -- $0 $0 -Average Sales Price $0 $0 -- $0 $0 -%of List Price Received 0 0% 0 0% -- 0 0% 0 0% -Days on Market 0 0 -- 0 0 -Inventory of Homes for Sale 0 0 -- -- -- -Months Supply of Inventory 0 0 0 0 -- -- -- -November Year to Date Townhouse/ Condo Single Family Med ian Sales Pr ice- Sing le Fam ily Rolling 12-Month Calculation Med ian Sales Pr ice- Tow nho use/ Co nd o Rolling 12-Month Calculation Current asof December 5, 2022 All data from the Aspen/Glenwood SpringsMLSInc Report © 2022 ShowingTime
Local
Board
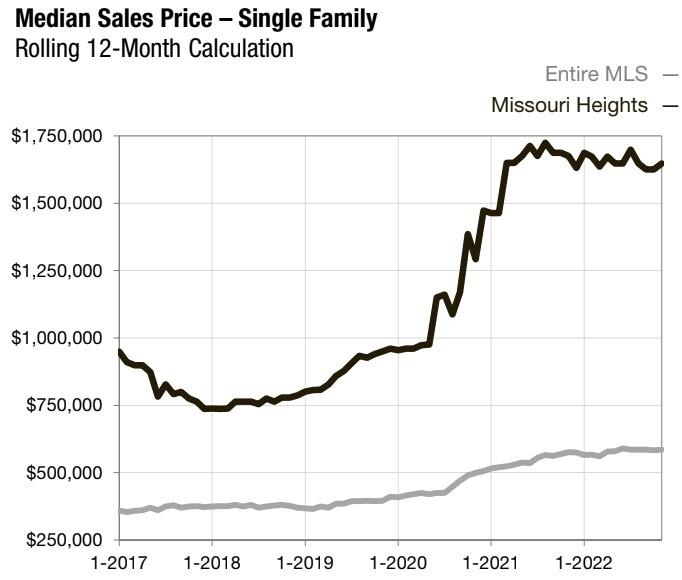
MISSOURI HEIGHTS
-100
1%
November Year to Date
New Listings 10 2 -80 0% 109 89 -18 3% Sold Listings 13 8 -38 5% 96 83 -13 5%
Median Sales Price $552,500 $695,000 +25 8% $551,250 $660,000 +19 7% Average Sales Price $556,923 $724,556 +30 1% $585,941 $662,182 +13 0% %of List Price Received 100 1% 98 7% -1 4% 99 0% 98 8% -0 2% Days on Market 24 37 +54 2% 38 33 -13 2% Inventory of Homes for Sale 13 17 +30 8% -- -- -Months Supply of Inventory 1 5 2 2 +46 7% -- -- --
Townhouse/ Condo Single Family
November
Year to Date
New Listings 8 1 -87 5% 61 53 -13 1% Sold Listings 8 2 -75 0% 60 51 -15 0%
Local Market Update November 2022 Aresearchtool provided bytheColorado Associationof REALTORS® and the Aspen Board of Realtors
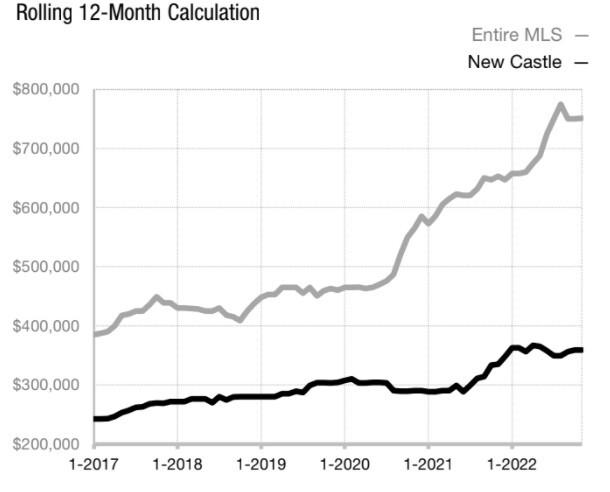
NEW CASTLE 2021 2022 % Change 2021 2022 % Change
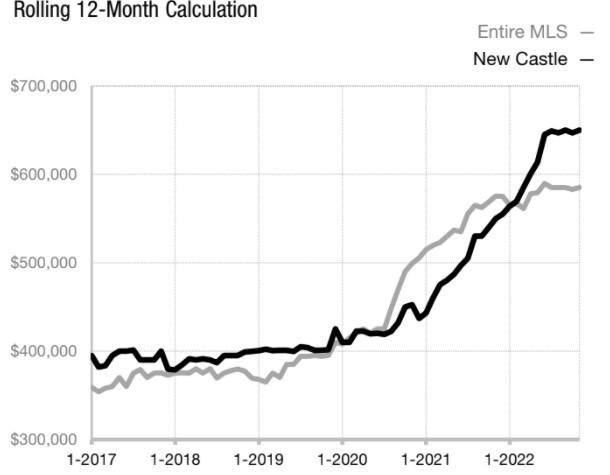
2021 2022 % Change 2021 2022 % Change
Median Sales Price $341,000 $357,500 +4 8% $337,500 $359,000 +6 4% Average Sales Price $344,313 $357,500 +3 8% $347,585 $398,884 +14 8% %of List Price Received 100 6% 98 0% -2 6% 100 4% 100 7% +0 3% Days on Market 9 17 +88 9% 17 13 -23 5% Inventory of Homes for Sale 13 6 -53 8% -- -- -Months Supply of Inventory 2 5 1 2 -52 0% -- -- -Med ian Sales Pr ice- Sing le Fam ily Rolling 12-Month Calculation Med ian Sales Pr ice- Tow nho use/ Co nd o Rolling 12-Month Calculation Current asof December 5, 2022 All data from the Aspen/Glenwood SpringsMLSInc Report © 2022 ShowingTime
November Year to Date
Market
November 2022
the
2021 2022 % Change 2021 2022 % Change
Local
Update
Aresearchtool provided bytheColorado Associationof REALTORS® and
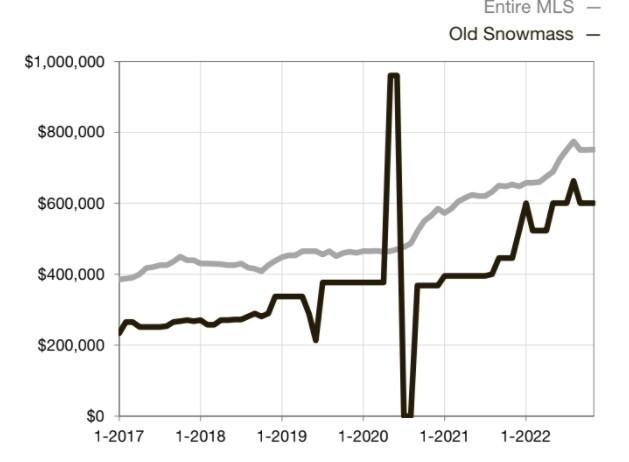
Aspen Board of Realtors OLD SNOW MASS
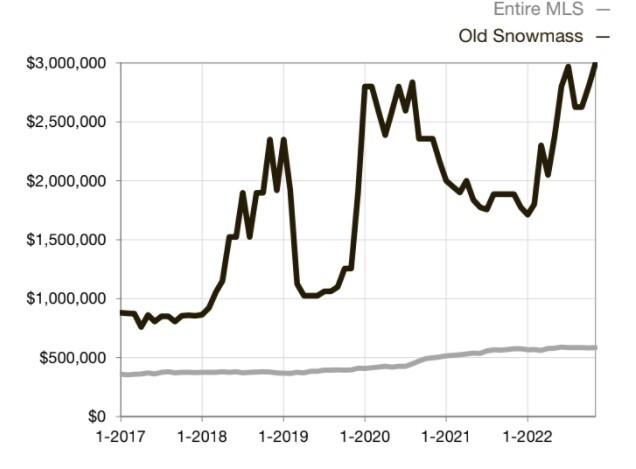
New Listings 2 0 -100 0% 27 22 -18 5% Sold Listings 4 3 -25 0% 22 21 -4 5% Median Sales Price $2,890,000 $6,125,000 +111 9% $1,750,000 $2,800,000 +60 0% Average Sales Price $5,730,500 $5,681,667 -0 9% $3,235,648 $6,081,483 +88 0% %of List Price Received 93 8% 93 0% -0 9% 96 0% 95 2% -0 8% Days on Market 180 16 -91 1% 86 77 -10 5% Inventory of Homes for Sale 13 4 -69 2% -- -- -Months Supply of Inventory 6 0 1 8 -70 0% -- -- --
2021 2022 % Change 2021
% Change
$0
Months
Inventory 1
--
Med ian Sales Pr ice- Sing le Fam ily Rolling 12-Month Calculation Med ian Sales Pr ice- Tow nho use/ Co nd o Rolling 12-Month Calculation Current asof December 5, 2022 All data from the Aspen/Glenwood SpringsMLSInc Report © 2022 ShowingTime
2022
New Listings 0 0 -- 3 1 -66 7% Sold Listings 0 0 -- 3 2 -33 3% Median Sales Price
$0 -- $445,000 $526,725 +18 4% Average Sales Price $0 $0 -- $1,008,333 $526,725 -47 8% %of List Price Received 0 0% 0 0% -- 97 6% 99 7% +2 2% Days on Market 0 0 -- 74 149 +101 4% Inventory of Homes for Sale 1 0 -100 0% -- -- --
Supply of
0 0 0 -100 0%
-- -November Year to Date Townhouse/ Condo Single Family
November 2022
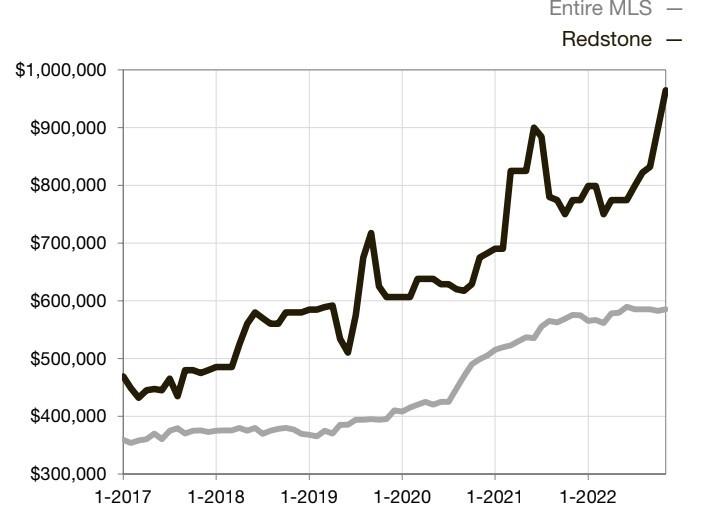
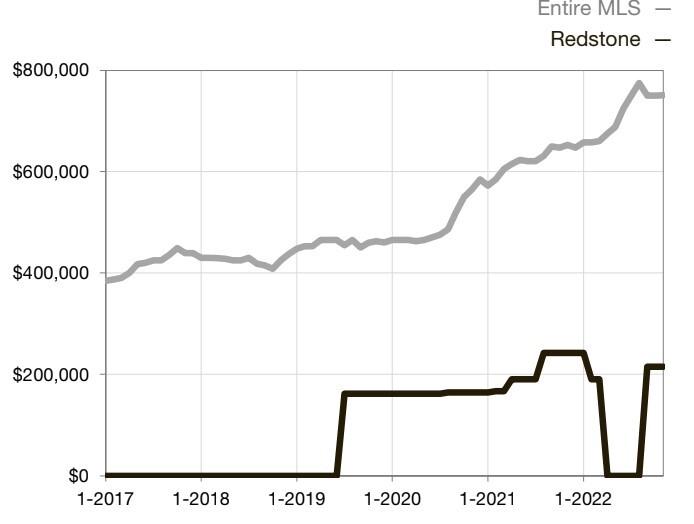
REDSTONE 2021
% Change 2021 2022 % Change
2021 2022 % Change 2021
% Change
$0
0
Months
Inventory 0
November Year to Date Townhouse/ Condo Single Family Med ian Sales Pr ice- Sing le Fam ily Rolling 12-Month Calculation Med ian Sales Pr ice- Tow nho use/ Co nd o Rolling 12-Month Calculation Current asof December 5, 2022 All data from the Aspen/Glenwood SpringsMLSInc Report © 2022 ShowingTime
Local Market Update
Aresearchtool provided bytheColorado Associationof REALTORS® and the Aspen Board of Realtors
2022
New Listings 1 0 -100 0% 23 11 -52 2% Sold Listings 1 2 +100 0% 23 8 -65 2% Median Sales Price $832,000 $1,180,000 +41 8% $750,000 $892,000 +18 9% Average Sales Price $832,000 $1,180,000 +41 8% $898,728 $2,314,750 +157 6% %of List Price Received 100 8% 92 5% -8 2% 94 6% 95 8% +1 3% Days on Market 3 154 +5033 3% 37 149 +302 7% Inventory of Homes for Sale 4 1 -75 0% -- -- -Months Supply of Inventory 1 7 0 6 -64 7% -- -- -November Year to Date
2022
New Listings 0 0 -- 2 3 +50 0% Sold Listings 0 0 -- 2 1 -50 0% Median Sales Price
$0 -- $242,500 $215,000 -11 3% Average Sales Price $0 $0 -- $242,500 $215,000 -11 3% %of List Price Received 0 0% 0 0$ -- 100 2% 104 9% +4 7% Days on Market 0 0 -- 6 3 -50 0% Inventory of Homes for Sale
0 -- -- -- --
Supply of
0 0 0 -- -- -- --
November Year to Date
Year to
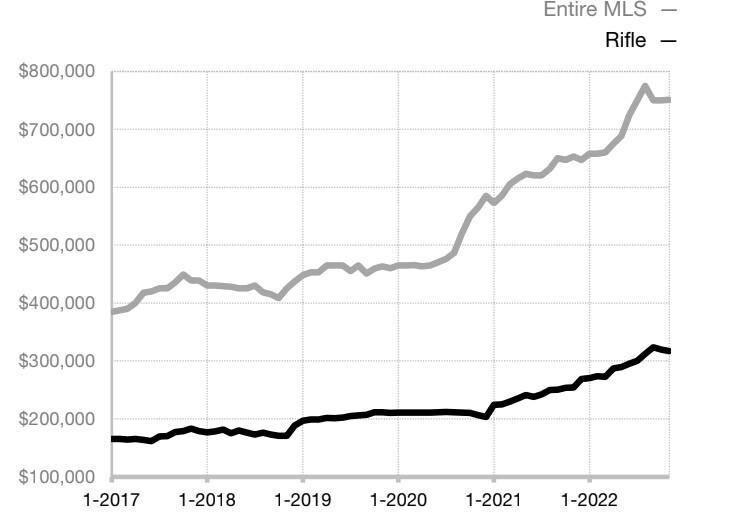
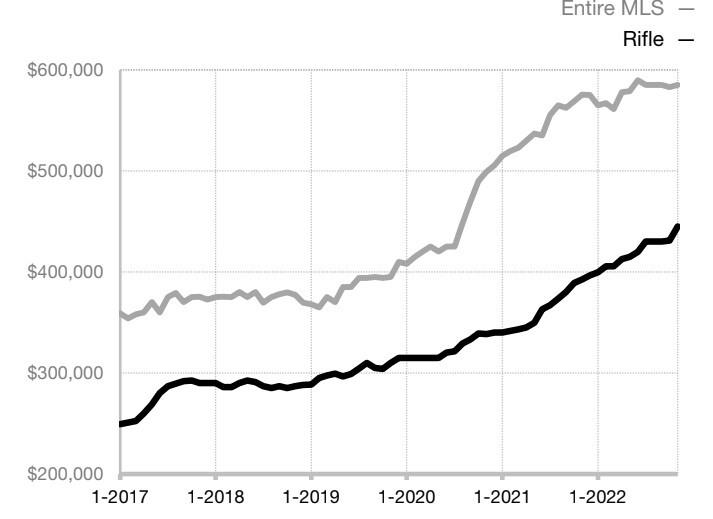
Local Market Update November 2022 Aresearchtool provided bytheColorado Associationof REALTORS® and the Aspen Board of Realtors RIFLE 2021 2022 % Change 2021 2022 % Change
New Listings 13 7 -46 2% 239 156 -34 7% Sold Listings 21 7 -66 7% 197 140 -28 9% Median Sales Price $390,000 $490,500 +25 8% $395,000 $445,500 +12 8% Average Sales Price $397,552 $516,471 +29 9% $415,534 $488,648 +17 6% %of List Price Received 98 3% 97 9% -0 4% 99 1% 98 9% -0 2% Days on Market 54 46 -14 8% 40 34 -15 0% Inventory of Homes for 30 17 -43 3% -- -- -Months Supply of 1 7 1 3 -23 5% -- -- --
2021 2022 % Change 2021 2022 % Change New Listings 3 2 -33 3% 69 35 -49 3% Sold Listings 5 2 -60 0% 76 36 -52 6%
Med ian Sales Pr ice- Sing le Fam ily Rolling 12-Month Calculation Med ian Sales Pr ice- Tow nho use/ Co nd o Rolling 12-Month Calculation Current asof December 5, 2022 All data from the Aspen/Glenwood SpringsMLSInc Report © 2022 ShowingTime
Median Sales Price $239,900 $279,000 +16 3% $260,000 $301,000 +15 8% Average Sales Price $279,730 $279,000 -0 3% $259,420 $278,069 +7 2% %of List Price Received 100 0% 100 6% +0 6% 100 4% 99 8% -0 6% Days on Market 39 10 -74 4% 47 49 +4 3% Inventory of Homes for Sale 3 2 -33 3% -- -- -Months Supply of Inventory 0 4 0 5 +25 0% -- -- -November
Date Townhouse/ Condo Single Family
November Year to Date
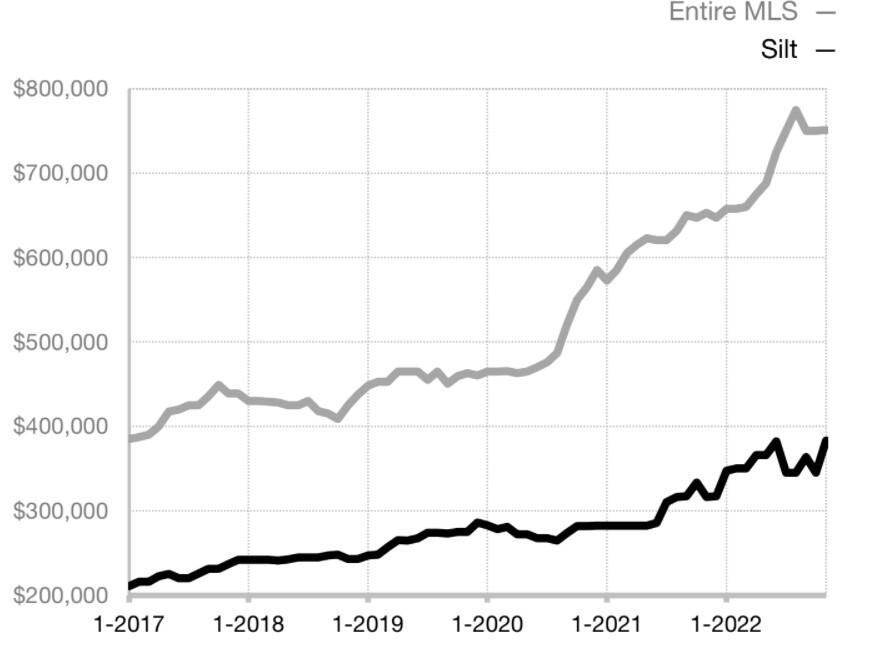
Local Market Update November 2022 Aresearchtool provided bytheColorado Associationof REALTORS® and the Aspen Board of Realtors SILT 2021 2022 % Change 2021 2022 % Change
New Listings 7 6 -14 3% 119 89 -25 2% Sold Listings 12 8 -33 3% 89 72 -19 1%
Median Sales Price $499,500 $705,000 +41 1% $480,000 $535,500 +11 6% Average Sales Price $497,708 $675,913 +35 8% $504,742 $555,566 +10 1% %of List Price Received 96 0% 96 6% +0 6% 98 8% 98 6% -0 2% Days on Market 83 48 -42 2% 43 41 -4 7% Inventory of Homes for Sale 23 21 -8 7% -- -- -Months Supply of Inventory 2 8 3 0 +7 1% -- -- --
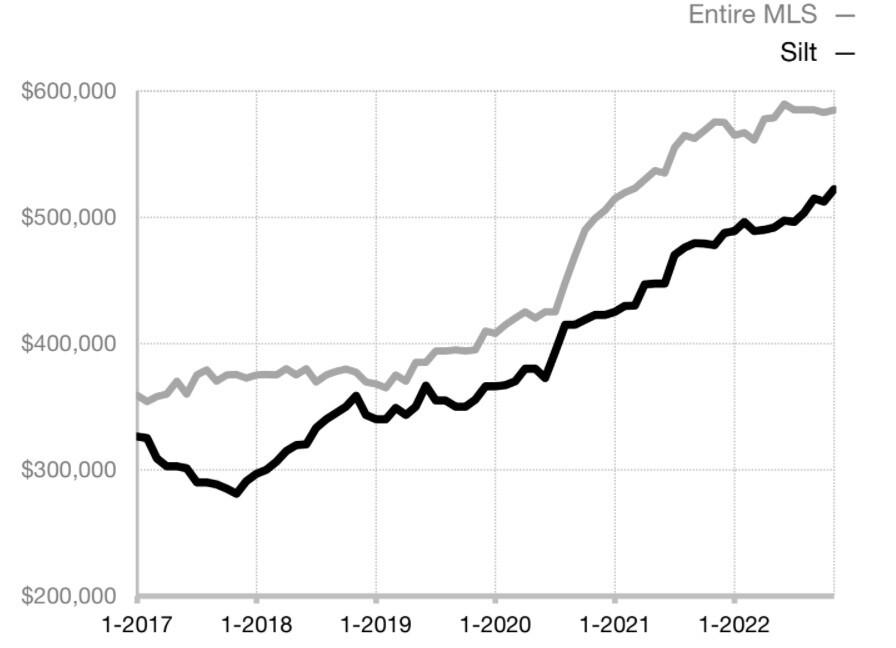
2021 2022 % Change 2021 2022 % Change
New Listings 0 0 --- 10 13 +30 0% Sold Listings 2 1 -50 0% 10 11 +10 0%
Med ian Sales Pr ice- Sing le Fam ily Rolling 12-Month Calculation Med ian Sales Pr ice- Tow nho use/ Co nd o Rolling 12-Month Calculation Current asof December 5, 2022 All data from the Aspen/Glenwood SpringsMLSInc Report © 2022 ShowingTime
Median Sales Price $233,500 $410,000 +75 6% $333,500 $385,000 +15 4% Average Sales Price $233,500 $410,000 +75 6% $334,100 $354,091 +6 0% %of List Price Received 102 0% 101 2% -80 8% 100 4% 98 8% -1 6% Days on Market 52 10 -80 8% 24 24 0 0% Inventory of Homes for Sale 0 0 -- -- -- -Months Supply of Inventory 0 0 0 0 -- -- -- -November Year to Date Townhouse/ Condo Single Family
November Year to Date
to
Local Market Update November 2022 Aresearchtool provided bytheColorado Associationof REALTORS® and the Aspen Board of Realtors
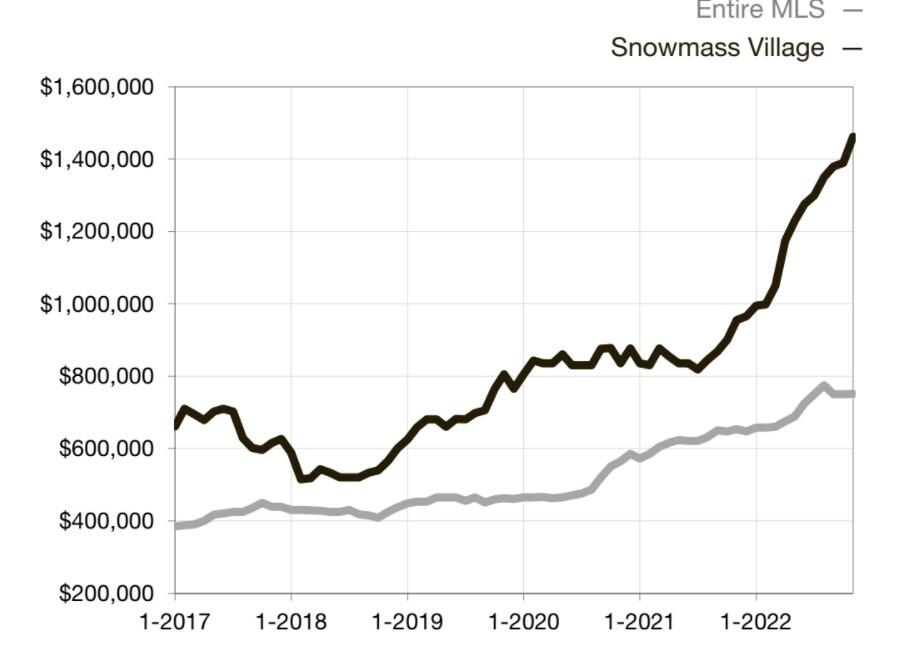
SNOW MASS VILLAGE 2021 2022 % Change 2021 2022 % Change
New Listings 3 1 -66 7% 62 49 -21 0% Sold Listings 8 1 -87 5% 68 33 -51 5% Median Sales Price $5,928,023 $6,592,370 +11 2% $5,150,000 $6,272,500 +21 8% Average Sales Price $6,137,631 $6,592,370 +7 4% $5,448,729 $7,265,287 +33 3% %of List Price Received 96 4% 94 9% -1 6% 96 5% 95 6% -0 9% Days on Market 108 96 -11 1% 146 110 -24 7% Inventory of Homes for Sale 13 18 +38 5% -- -- -Months Supply of Inventory 2 2 5 2 +136 4% -- -- --
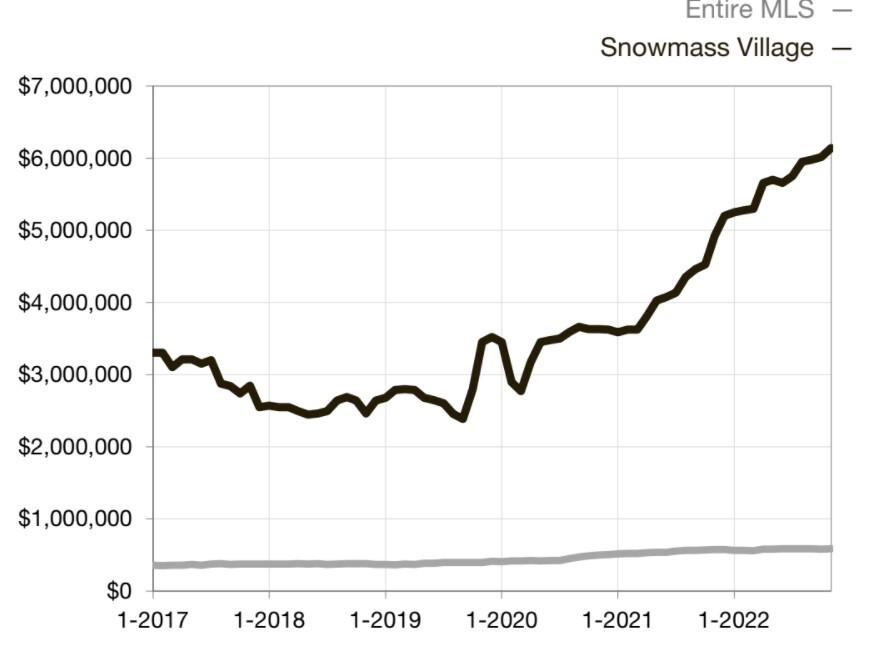
2021 2022 % Change 2021 2022 % Change New Listings 11 8 -27 3% 259 164 -36 7% Sold Listings 22 10 -54 5% 229 112 -51 1%
Med ian Sales Pr ice- Sing le Fam ily Rolling 12-Month Calculation Med ian Sales Pr ice- Tow nho use/ Co nd o Rolling 12-Month Calculation Current asof December 5, 2022 All data from the Aspen/Glenwood SpringsMLSInc Report © 2022 ShowingTime
Median Sales Price $1,224,015 $2,050,000 +67 5% $960,000 $1,485,000 +54 7% Average Sales Price $2,109,570 $2,553,500 +21 0% $1,413,489 $2,015,479 +42 6% %of List Price Received 96 9% 93 1% -3 9% 97 8% 97 4% -0 4% Days on Market 45 74 +64 4% 93 41 -55 9% Inventory of Homes for Sale 19 42 +121 1% -- -- -Months Supply of Inventory 0 9 4 0 +344 4% -- -- -November Year
Date Townhouse/ Condo Single Family
Market Update November 2022 Aresearchtool provided bytheColorado
REALTORS® and the Aspen
2021 2022 % Change 2021 2022 % Change New Listings 0 3 -- 11 12 +9 1% Sold Listings 1 0 -100 0% 10 0
0% Median Sales Price $4,700,000 $0 -100 0% $11,587,500 $0
Average Sales Price $4,700,00 $0
0% $12,364,500 $0
%of List Price Received 104 4% 0 0% -100 0% 96 4% 0 0%
Days on Market 156 0 -100 0% 193 0
Inventory of Homes for Sale 4 8 +100 0% -- -- -Months Supply of Inventory 2 9 8 0 +175 9% -- -- --
2021 2022 % Change 2021 2022 % Change New Listings 0 0 -- 0 0 -Sold Listings 0 0 -- 0 0 -Median Sales Price $0 $0 -- $0 $0 -Average Sales Price $0 $0 -- $0 $0 -%of List Price Received 0 0% 0 0% -- 0 0% 0 0% -Days on Market 0 0 -- 0 0 -Inventory of Homes for Sale 0 0 -- -- -- -Months Supply of Inventory 0 0 0 0 -- -- -- -November Year
Date Townhouse/ Condo
Family Med ian Sales Pr ice- Sing le Fam ily Rolling 12-Month Calculation Med ian Sales Pr ice- Tow nho use/ Co nd o Rolling 12-Month Calculation Current asof December 5, 2022 All data from the Aspen/Glenwood SpringsMLSInc Report © 2022 ShowingTime
Local
Associationof
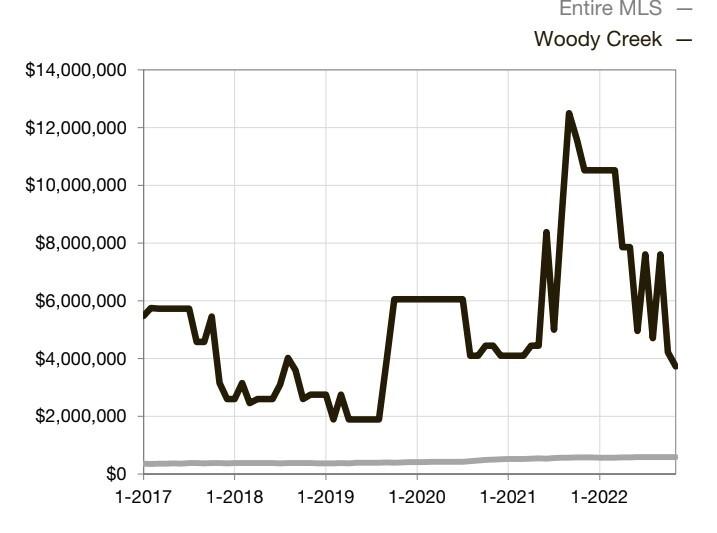
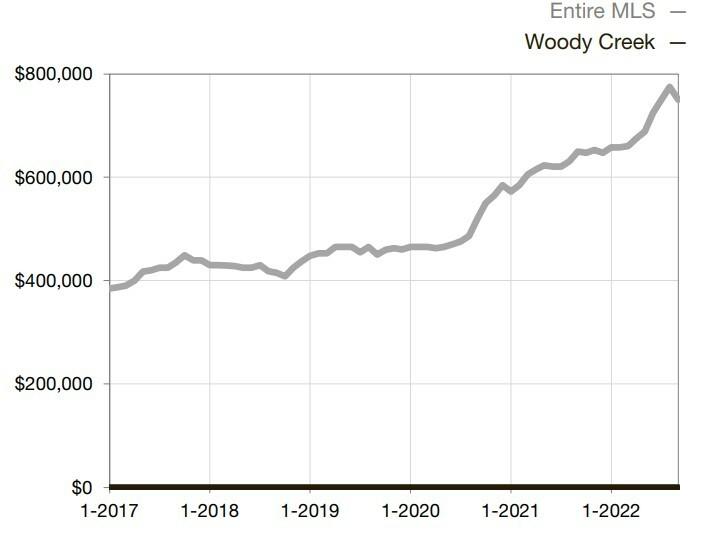
Board of Realtors W OODY CREEK
-100
-100 0%
-100
-100 0%
-100 0%
-100 0%
November Year to Date
to
Single