
Market Update


September 2022
September
Year to Date
September
Year to Date
Local
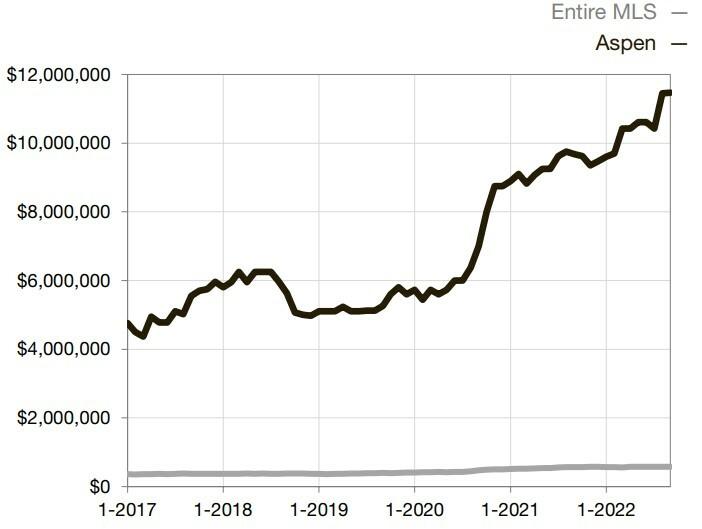
Aresearchtool provided bytheColorado Associationof REALTORS® and the Aspen Board of Realtors ASPEN 2021 2022 % Change 2021 2022 % Change New Listings 16 11 31 3% 150 130 13 3% Sold Listings 17 2 88 2% 103 59 42 7% Median Sales Price $10,600,000 $9,250,000 12 7% $9,700,000 $12,400,000 +27 8% Average Sales Price $9,269,176 $9,250,000 0 2% $11,954,990 $16,689,914 +39 6% %of List Price Received 97 6% 97 6% 0 0% 95 2% 96 2% +1 1% Days on Market 77 27 64 9% 153 114 25 2% Inventory of Homes for Sale 95 74 22 1% Months Supply of Inventory 6 6 8 1 +22 7%
2021 2022 % Change 2021 2022 % Change New Listings 15 10 33 3% 191 147 23 0% Sold Listings 23 9 60 9% 179 99 44 7% Median Sales Price $2,897,500 $4,125,000 +42 4% $1,880,000 $3,125,000 +66 2% Average Sales Price $4,729,152 $5,445,556 +15 1% $2,818,467 $4,527,475 +60 6% %of List Price Received 97 6% 96 4% 1 2% 96 9% 98 0% +1 1% Days on Market 87 43 50 6% 90 45 50 0% Inventory of Homes for Sale 45 54 +20 0% Months Supply of Inventory 2 2 3 8 +72 7%
Townhouse/ Condo
Med ian Sales Pr ice Sing le Fam ily Rolling 12 Month Calculation Med ian Sales Pr ice Tow nho use/ Co nd o Rolling 12 Month Calculation Current asof October 5, 2022 All data from the Aspen/Glenwood SpringsMLSInc Report © 2022 ShowingTime
Single Family
Calculation
September 2022
Update
September Year to Date
September Year to Date
Med
12 Month Calculation

Local Market
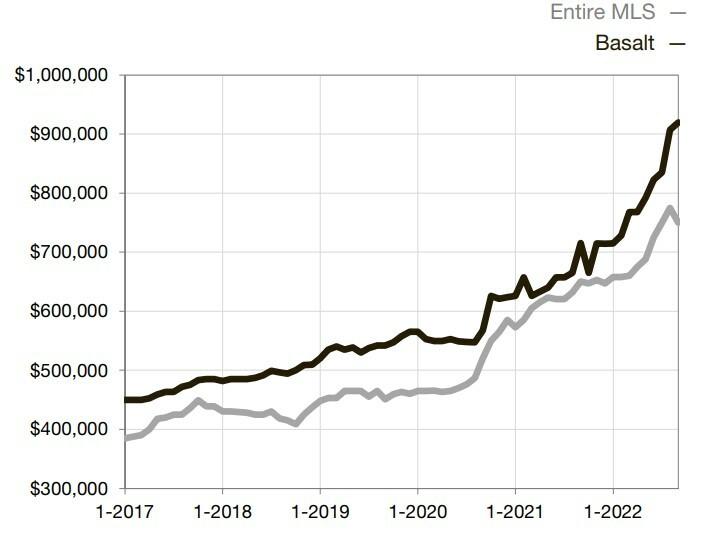
Aresearchtool provided bytheColorado Associationof REALTORS® and the Aspen Board of Realtors BASALT 2021 2022 % Change 2021 2022 % Change New Listings 3 6 +100 0% 62 59 4 8% Sold Listings 9 4 55 6% 55 23 58 2% Median Sales Price $1,295,000 $1,700,000 +31 3% $1,450,000 $1,565,000 +7 9% Average Sales Price $1,827,352 $2,131,875 +16 7% $1,876,703 $1,844,478 1 7% %of List Price Received 95 7% 94 8% 0 9% 95 9% 96 9% +1 0% Days on Market 141 19 86 5% 118 62 47 5% Inventory of Homes for Sale 25 31 +24 0% Months Supply of Inventory 3 9 8 5 +117 9%
2021 2022 % Change 2021 2022 % Change New Listings 8 5 37 5% 89 86 3 4% Sold Listings 9 12 +33 3% 66 68 +3 0% Median Sales Price $820,000 $1,525,000 +86 0% $670,500 $942,500 +40 6% Average Sales Price $1,099,556 $1,754,500 +59 6% $791,056 $1,170,699 +48 0% %of List Price Received 100 5% 99 4% 1 1% 99 7% 100 7% +1 0% Days on Market 42 66 +57 1% 49 30 38 8% Inventory of Homes for Sale 12 21 +75 0% Months Supply of Inventory 1 4 2 9 +107 1%
Townhouse/ Condo
Med ian Sales Pr ice Sing le Fam ily Rolling 12 Month
ian Sales Pr ice Tow nho use/ Co nd o Rolling
Current asof October 5, 2022 All data from the Aspen/Glenwood SpringsMLSInc Report © 2022 ShowingTime
September 2022
Update
Family
September
Year to Date

September
Year to Date

Local Market
Aresearchtool provided bytheColorado Associationof REALTORS® and the Aspen Board of Realtors CARBONDALE 2021 2022 % Change 2021 2022 % Change New Listings 13 12 7 7% 172 164 4 7% Sold Listings 16 11 31 3% 133 86 35 3% Median Sales Price $1,324,500 $1,250,000 5 6% $1,463,375 $1,622,500 +10 9% Average Sales Price $1,456,444 $1,363,636 6 4% $1,553,078 $1,856,184 +19 5% %of List Price Received 99 2% 98 4% 0 8% 98 3% 98 4% +0 1% Days on Market 38 47 +23 7% 57 71 +24 6% Inventory of Homes for 60 59 1 7% Months Supply of Inventory 3 7 5 3 +43 2%
2021 2022 % Change 2021 2022 % Change New Listings 9 7 22 2% 76 68 10 5% Sold Listings 10 3 70 0% 82 52 36 6% Median Sales Price $840,500 $880,000 +4 7% $635,000 $890,000 +40 2% Average Sales Price $1,041,250 $933,333 10 4% $712,515 $979,079 +37 4% %of List Price Received 100 0% 98 7% 1 3% 99 9% 99 5% 0 4% Days on Market 25 9 64 0% 57 37 35 1% Inventory of Homes for Sale 11 23 +109 1% Months Supply of Inventory 1 2 3 7 +208 3%
Townhouse/ Condo Single
Med ian Sales Pr ice Sing le Fam ily Rolling 12 Month Calculation Med ian Sales Pr ice Tow nho use/ Co nd o Rolling 12 Month Calculation Current asof October 5, 2022 All data from the Aspen/Glenwood SpringsMLSInc Report © 2022 ShowingTime
Update
2022
GLENW OOD SPRINGS


September Year to Date
September
Year to Date
Local Market
September
Aresearchtool provided bytheColorado Associationof REALTORS® and the Aspen Board of Realtors
2021 2022 % Change 2021 2022 % Change New Listings 25 12 52 0% 202 170 15 8% Sold Listings 20 15 25 0% 170 130 23 5% Median Sales Price $799,000 $1,042,500 +30 5% $766,449 $852,164 +11 2% Average Sales Price $939,414 $1,066,690 +13 5% $836,287 $958,729 +14 6% %of List Price Received 99 1% 95 9% 3 2% 99 4% 98 6% 0 8% Days on Market 48 37 22 9% 39 49 +25 6% Inventory of Homes for Sale 36 49 +36 1% Months Supply of Inventory 1 8 3 2 +77 8%
2021 2022 % Change 2021 2022 % Change New Listings 5 3 40 0% 83 73 12 0% Sold Listings 13 16 +23 1% 68 80 +17 6% Median Sales Price $395,850 $619,500 +56 5% $395,425 $532,500 +34 7% Average Sales Price $479,104 $583,281 +21 7% $395,835 $532,827 +34 6% %of List Price Received 100 2% 94 4% 5 8% 100 2% 98 9% 1 3% Days on Market 12 60 +400 0% 22 58 +163 6% Inventory of Homes for Sale 16 4 75 0% Months Supply of Inventory 2 2 0 4 81 8%
Townhouse/ Condo Single Family Med ian Sales Pr ice Sing le Fam ily Rolling 12 Month Calculation Med ian Sales Pr ice Tow nho use/ Co nd o Rolling 12 Month Calculation Current asof October 5, 2022 All data from the Aspen/Glenwood SpringsMLSInc Report © 2022 ShowingTime
Update
2022
September Year to Date
September Year to Date


Local Market
September
Aresearchtool provided bytheColorado Associationof REALTORS® and the Aspen Board of Realtors MARBLE 2021 2022 % Change 2021 2022 % Change New Listings 0 0 6 4 33 3% Sold Listings 0 0 6 2 66 7% Median Sales Price $0 $0 $645,500 $804,000 +24 6% Average Sales Price $0 $0 $713,500 $804,000 +12 7% %of List Price Received 0 0% 0 0% 99 2% 97 8% 1 4% Days on Market 0 0 90 167 +85 6% Inventory of Homes for Sale 3 2 33 3% Months Supply of Inventory 2 6 1 3 50 0%
2021 2022 % Change 2021 2022 % Change New Listings 0 0 0 0 Sold Listings 0 0 0 0 Median Sales Price $0 $0 $0 $0 Average Sales Price $0 $0 $0 $0 %of List Price Received 0 0% 0 0% 0 0% 0 0% Days on Market 0 0 0 0 Inventory of Homes for Sale 0 0 Months Supply of Inventory 0 0 0 0
Townhouse/ Condo Single Family Med ian Sales Pr ice Sing le Fam ily Rolling 12 Month Calculation Med ian Sales Pr ice Tow nho use/ Co nd o Rolling 12 Month Calculation Current asof October 5, 2022 All data from the Aspen/Glenwood SpringsMLSInc Report © 2022 ShowingTime
2022
Family
HEIGHTS

September Year to Date
September Year to Date

Local Market Update September
Aresearchtool provided bytheColorado Associationof REALTORS® and the Aspen Board of Realtors MISSOURI
2021 2022 % Change 2021 2022 % Change New Listings 2 1 50 0% 36 29 19 4% Sold Listings 2 4 +100 0% 34 23 32 4% Median Sales Price $1,735,000 $1,287,500 25 8% $1,687,000 $1,712,500 +1 5% Average Sales Price $1,735,000 $1,543,750 11 0% $1,842,840 $2,178,312 +18 2% %of List Price Received 95 6% 96 7% +1 2% 96 6% 97 8% +1 2% Days on Market 92 59 35 9% 101 116 +14 9% Inventory of Homes for Sale 14 10 28 6% Months Supply of Inventory 3 1 3 5 +12 9%
2021 2022 % Change 2021 2022 % Change New Listings 0 0 0 0 Sold Listings 0 0 0 0 Median Sales Price $0 $0 $0 $0 Average Sales Price $0 $0 $0 $0 %of List Price Received 0 0% 0 0% 0 0% 0 0% Days on Market 0 0 0 0 Inventory of Homes for Sale 0 0 Months Supply of Inventory 0 0 0 0
Townhouse/ Condo Single
Med ian Sales Pr ice Sing le Fam ily Rolling 12 Month Calculation Med ian Sales Pr ice Tow nho use/ Co nd o Rolling 12 Month Calculation Current asof October 5, 2022 All data from the Aspen/Glenwood SpringsMLSInc Report © 2022 ShowingTime
September 2022
Update
Family
CASTLE
September Year to Date
September
Year to Date


Local Market
Aresearchtool provided bytheColorado Associationof REALTORS® and the Aspen Board of Realtors NEW
2021 2022 % Change 2021 2022 % Change New Listings 11 5 54 5% 89 79 11 2% Sold Listings 6 9 +50 0% 75 66 12 0% Median Sales Price $577,500 $655,000 +13 4% $550,000 $664,500 +20 8% Average Sales Price $612,833 $613,611 +0 1% $581,938 $670,041 +15 1% %of List Price Received 97 3% 96 7% 0 6% 99 1% 99 0% 0 1% Days on Market 20 24 +20 0% 38 34 10 5% Inventory of Homes for Sale 23 14 39 1% Months Supply of Inventory 2 9 1 7 41 4%
2021 2022 % Change 2021 2022 % Change New Listings 9 2 77 8% 51 51 0 0% Sold Listings 2 5 +150 0% 49 45 8 2% Median Sales Price $257,500 $420,000 +63 1% $333,500 $349,000 +4 6% Average Sales Price $257,500 $432,500 +68 0% $343,890 $390,780 +13 6% %of List Price Received 99 3% 98 6% 0 7% 100 4% 100 9% +0 5% Days on Market 48 23 52 1% 18 13 27 8% Inventory of Homes for Sale 11 7 36 4% Months Supply of Inventory 2 1 1 3 38 1%
Townhouse/ Condo Single
Med ian Sales Pr ice Sing le Fam ily Rolling 12 Month Calculation Med ian Sales Pr ice Tow nho use/ Co nd o Rolling 12 Month Calculation Current asof October 5, 2022 All data from the Aspen/Glenwood SpringsMLSInc Report © 2022 ShowingTime
2022
MASS
September Year to Date
September Year to Date


Local Market Update September
Aresearchtool provided bytheColorado Associationof REALTORS® and the Aspen Board of Realtors OLD SNOW
2021 2022 % Change 2021 2022 % Change New Listings 3 1 66 7% 24 19 20 8% Sold Listings 3 1 66 7% 16 15 6 3% Median Sales Price $715,000 $499,000 30 2% $1,750,000 $2,450,000 +40 0% Average Sales Price $2,803,333 $499,000 82 2% $2,733,969 $5,853,267 +114 1% %of List Price Received 94 9% 100 0% +5 4% 97 6% 95 2% 2 5% Days on Market 37 10 73 0% 62 97 +56 5% Inventory of Homes for Sale 15 7 53 3% Months Supply of Inventory 7 5 3 2 57 3%
2021 2022 % Change 2021 2022 % Change New Listings 0 0 3 1 66 7% Sold Listings 1 0 100 0% 3 2 33 3% Median Sales Price $2,175,000 $0 100 0% $445,000 $526,725 +18 4% Average Sales Price $2,175,000 $0 100 0% $1,008,333 $526,725 47 8% %of List Price Received 96 3% 0 0% 100 0% 97 6% 99 7% +2 2% Days on Market 28 0 100 0% 74 149 +101 4% Inventory of Homes for Sale 1 0 100 0% Months Supply of Inventory 1 0 0 0 100 0%
Townhouse/ Condo Single Family Med ian Sales Pr ice Sing le Fam ily Rolling 12 Month Calculation Med ian Sales Pr ice Tow nho use/ Co nd o Rolling 12 Month Calculation Current asof October 5, 2022 All data from the Aspen/Glenwood SpringsMLSInc Report © 2022 ShowingTime
2022
September Year to Date
September Year to Date


Local Market Update September
Aresearchtool provided bytheColorado Associationof REALTORS® and the Aspen Board of Realtors REDSTONE 2021 2022 % Change 2021 2022 % Change New Listings 1 0 100 0% 21 11 47 6% Sold Listings 4 3 25 0% 21 6 71 4% Median Sales Price $749,500 $745,000 0 6% $750,000 $892,000 +18 9% Average Sales Price $736,625 $796,333 +8 1% $912,559 $2,693,000 +195 1% %of List Price Received 97 3% 95 3% 2 1% 94 1% 96 9% +3 0% Days on Market 18 67 +272 2% 38 147 +286 8% Inventory of Homes for Sale 6 3 50 0% Months Supply of Inventory 2 5 2 0 20 0%
2021 2022 % Change 2021 2022 % Change New Listings 0 0 2 2 0 0% Sold Listings 0 1 2 1 50 0% Median Sales Price $0 $215,000 $242,500 $215,000 11 3% Average Sales Price $0 $215,000 $242,500 $215,000 11 3% %of List Price Received 0 0% 104 9% 100 2% 104 9% +4 7% Days on Market 0 3 6 3 50 0% Inventory of Homes for Sale 0 0 Months Supply of Inventory 0 0 0 0
Townhouse/ Condo Single Family Med ian Sales Pr ice Sing le Fam ily Rolling 12 Month Calculation Med ian Sales Pr ice Tow nho use/ Co nd o Rolling 12 Month Calculation Current asof October 5, 2022 All data from the Aspen/Glenwood SpringsMLSInc Report © 2022 ShowingTime
September 2022
Update
September Year to Date

September
Year to Date

Local Market
Aresearchtool provided bytheColorado Associationof REALTORS® and the Aspen Board of Realtors RIFLE 2021 2022 % Change 2021 2022 % Change New Listings 22 10 54 5% 208 141 32 2% Sold Listings 19 8 57 9% 154 120 22 1% Median Sales Price $415,000 $472,500 +13 9% $393,500 $448,750 +14 0% Average Sales Price $443,276 $464,500 +4 8% $416,344 $494,647 +18 8% %of List Price Received 98 4% 96 8% 1 6% 99 2% 99 1% 0 1% Days on Market 24 55 +129 2% 38 34 10 5% Inventory of Homes for 47 32 31 9% Months Supply of 2 8 2 1 25 0%
2021 2022 % Change 2021 2022 % Change New Listings 5 2 60 0% 59 32 45 8% Sold Listings 7 1 85 7% 62 31 50 0% Median Sales Price $265,000 $375,000 +41 5% $252,000 $324,500 +28 8% Average Sales Price $240,843 $375,000 +55 7% $250,887 $281,903 +12 4% %of List Price Received 99 6% 96 2% 3 4% 100 5% 99 9% 0 6% Days on Market 27 102 +277 8% 44 46 +4 5% Inventory of Homes for Sale 3 5 +66 7% Months Supply of Inventory 0 4 1 1 +175 0%
Townhouse/ Condo Single Family Med ian Sales Pr ice Sing le Fam ily Rolling 12 Month Calculation Med ian Sales Pr ice Tow nho use/ Co nd o Rolling 12 Month Calculation Current asof October 5, 2022 All data from the Aspen/Glenwood SpringsMLSInc Report © 2022 ShowingTime
2022
Family
September Year to Date

September
Year to Date

Local Market Update September
Aresearchtool provided bytheColorado Associationof REALTORS® and the Aspen Board of Realtors SILT 2021 2022 % Change 2021 2022 % Change New Listings 10 15 +50 0% 97 76 21 6% Sold Listings 15 4 73 3% 70 60 14 3% Median Sales Price $495,000 $697,000 +408% $479,500 $535,500 +11 7% Average Sales Price $529,023 $724,750 +37 0% $505,351 $545,907 +7 8% %of List Price Received 97 7% 98 3% +0 6% 99 1% 98 8% 0 3% Days on Market 36 34 5 6% 37 42 +13 5% Inventory of Homes for Sale 26 23 11 5% Months Supply of Inventory 3 3 3 0 9 1%
2021 2022 % Change 2021 2022 % Change New Listings 0 2 8 13 +62 5% Sold Listings 1 0 100 0% 8 9 +12 5% Median Sales Price $285,000 $0 100 0% $369,500 $385,000 +4 2% Average Sales Price $285,000 $0 100 0% $359,250 $365,444 +1 7% %of List Price Received 100 0% 0 0% 100 0% 99 9% 99 4% 0 5% Days on Market 45 0 100 0% 17 16 5 9% Inventory of Homes for Sale 0 2 Months Supply of Inventory 0 0 1 3
Townhouse/ Condo Single
Med ian Sales Pr ice Sing le Fam ily Rolling 12 Month Calculation Med ian Sales Pr ice Tow nho use/ Co nd o Rolling 12 Month Calculation Current asof October 5, 2022 All data from the Aspen/Glenwood SpringsMLSInc Report © 2022 ShowingTime
Update
2022
SNOW MASS VILLAGE


Single Family
September Year to Date
September
Year to Date
Local Market
September
Aresearchtool provided bytheColorado Associationof REALTORS® and the Aspen Board of Realtors
2021 2022 % Change 2021 2022 % Change New Listings 1 2 +100 0% 54 45 16 7% Sold Listings 10 1 90 0% 56 29 48 2% Median Sales Price $5,362,500 $9,800,000 +82 8% $4,837,500 $6,272,500 +29 7% Average Sales Price $5,756,000 $9,800,000 +70 3% $5,331,991 $7,398,176 +38 8% %of List Price Received 97 6% 91 2% 6 6% 96 6% 96 0% 0 6% Days on Market 79 82 +3 8% 146 108 26 0% Inventory of Homes for Sale 17 18 +5 9% Months Supply of Inventory 2 3 4 3 +87 0%
2021 2022 % Change 2021 2022 % Change New Listings 23 3 87 0% 239 149 37 7% Sold Listings 18 8 55 6% 187 93 50 3% Median Sales Price $1,154,500 $1,369,500 +18 5% $840,000 $1,400,000 +66 7% Average Sales Price $1,611,608 $1,863,781 +15 6% $1,300,165 $1,914,588 +47 3% %of List Price Received 98 5% 93 8% 4 8% 97 8% 97 9% +0 1% Days on Market 70 95 +35 7% 102 35 65 7% Inventory of Homes for Sale 29 53 +82 8% Months Supply of Inventory 1 3 4 3 +230 8%
Townhouse/ Condo
Med ian Sales Pr ice Sing le Fam ily Rolling 12 Month Calculation Med ian Sales Pr ice Tow nho use/ Co nd o Rolling 12 Month Calculation Current asof October 5, 2022 All data from the Aspen/Glenwood SpringsMLSInc Report © 2022 ShowingTime
2022
Single Family
CREEK
September Year to Date
September
Year to Date


Local Market Update September
Aresearchtool provided bytheColorado Associationof REALTORS® and the Aspen Board of Realtors
WOODY
2021 2022 % Change 2021 2022 % Change New Listings 1 1 0 0% 10 9 10 0% Sold Listings 1 0 100 0% 7 0 100 0% Median Sales Price $670,000 $0 100 0% $12,650,000 $0 100 0% Average Sales Price $670,000 $0 100 0% $10,988,571 $0 100 0% %of List Price Received 96 4% 0 0% 100 0% 95 2% 0 0% 100 0% Days on Market 164 0 100 0% 201 0 100 0% Inventory of Homes for Sale 7 11 +57 1% Months Supply of Inventory 5 4 8 3 +53 7%
2021 2022 % Change 2021 2022 % Change New Listings 0 0 0 0 Sold Listings 0 0 0 0 Median Sales Price $0 $0 $0 $0 Average Sales Price $0 $0 $0 $0 %of List Price Received 0 0% 0 0% 0 0% 0 0% Days on Market 0 0 0 0 Inventory of Homes for Sale 0 0 Months Supply of Inventory 0 0 0 0
Townhouse/ Condo
Med ian Sales Pr ice Sing le Fam ily Rolling 12 Month Calculation Med ian Sales Pr ice Tow nho use/ Co nd o Rolling 12 Month Calculation Current asof October 5, 2022 All data from the Aspen/Glenwood SpringsMLSInc Report © 2022 ShowingTime