69 minute read
Recent Efforts, Challenges and Opportunities


The adoption of the COG 2030 Climate and Energy Action Plan comes as the Greater Washington region addresses specific needs in housing, transportation, and recovery from the COVID-19 pandemic, and as local governments prepare their own climate action plans. These recent and ongoing efforts show where we can strengthen policies to make renewed and urgent progress in meeting our 2030 climate goal while also addressing equity and livability.
Visualize 2045
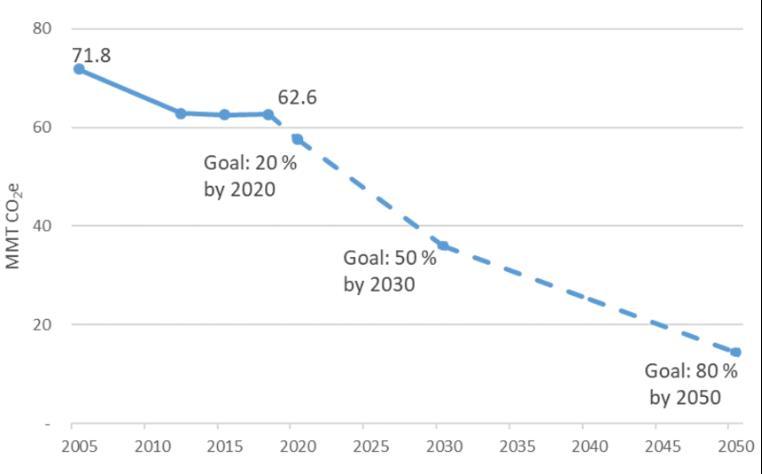
The 2018 Visualize 2045 plan would reduce transportation GHG by only 23 percent from 2005 to 2045 (at which point on-road GHG would begin to rise again due to continued VMT growth). This small reduction stands in contrast to our region’s adopted goal of reducing GHG 80 percent by 2050 and even more in contrast to stronger carbon neutrality goals adopted by localities and other regions and proposed by the Biden administration.
The National Capital Region Transportation Planning Board (TPB) is beginning the process of updating Visualize 2045, which will continue through 2021, with final adoption in 2022. The updated plan will need to demonstrate that it can achieve significant GHG emissions by 2030 and by 2045 under a range of scenarios that take into account uncertainty regarding factors such as the uptake of electric vehicles by the region’s households and workers.
Regional Housing Targets
Currently, the region has a shortfall of 264,000 affordable housing units,55 which is projected to grow. In September 2019, the region’s leaders adopted the following housing targets based on COG’s Future of Housing in Greater Washington report: 1. Amount – At least 320,000 housing units should be added in the region between 2020 and 2030. This is an additional 75,000 units beyond the units already forecast for this period. 2. Accessibility – At least 75% of all new housing should be in Activity Centers or near high-capacity transit. 3. Affordability – At least 75% of new housing should be affordable to low- and middleincome households.56
Making sure that our region has enough affordable housing and that much of it is located near transit and within close-in activity centers is both an equity strategy and a climate strategy.
The TPB Board of elected and agency officials in December 2020 took a promising first step in the Visualize 2045 update by voting to require that project submissions “…prioritize investments on projects, programs, and policies to reduce greenhouse gas emissions, prioritize the aspirational strategies, and achieve COG’s land use and equity goals...”
18
COVID-19 Impacts to Public Transit
Public transit is an essential part of moving essential workers around the region, getting everyone back to work during our economic recovery, and reducing the climate impacts of our transportation system.57 Federal, state, regional and local support for transit must be maintained and further strategies to provide high-quality, effective transit must be supported. For example, a high-level analysis of the Biden transition plan to provide every American city with 100,000 or more residents with high-quality, zero-emissions public transportation options, found it to be realistic and relatively low cost compared to massive highway spending.58
Transportation & Climate Initiative
Mid-Atlantic and Northeastern states, including DC, Virginia and Maryland, have negotiated a Memorandum of Understanding to create a regional cap-and-trade program for greenhouse gas emissions related to wholesale motor vehicle fuel sales. So far DC, Massachusetts, Connecticut and Rhode Island have signed on. The program, if joined by all states, is expected to produce significant revenues (up to $7 billion annually) from pollution allowances that can be used for clean transportation investments in the 13 participating jurisdictions. In addition, the jurisdictions have committed to equity measures and to considering complementary policies to achieve stronger emissions reductions. 59, 60 The cap-and-trade scenario developed by the 13 jurisdictions would produce a 25 percent reduction in greenhouse gas emissions from combustion of on-road gasoline and diesel fuels. However, the reference case scenario (of no TCI policy) is forecast to reduce emissions by 19 percent over the time period, meaning the TCI program would result in a net decrease in emissions of 6 percent without additional complementary policies. 61
Local Climate Action Planning
Local climate action plans are under preparation across the region. Like regional plans, these local plans need specific, measurable and monitored VMT reduction and mode share policies and strategies. These planning efforts include:
● Fairfax County – Community-Wide Energy and Climate Action Plan (CECAP) ● Alexandria – Energy and Climate Change
Action Plan (ECCAP) ● Montgomery County – Climate Action and
Plan (CAP) ● Prince George’s County – Climate Action
Plan
● Frederick County – Climate Emergency
Mobilization Work Group
To produce more significant emissions reductions than 6%, it is critical that jurisdictions participating in the TCI program, such as DC (and possibly Maryland and Virginia) adopt strong complementary policies related to land use, mode shift, affordable housing near transit, as well as vehicle electrification. The contributions of metropolitan transportation agencies and local governments are also critical for an effective TCI Program.
19
Residents Overwhelmingly Want Climate Action in Transportation
A recent survey of a statistically representative sample of the region’s residents by TPB found that 84 percent agree with the statement that “elected officials need to consider the impacts of climate change when planning transportation in the future. ”62
In contrast, when asked about traffic congestion, less than half of respondents (44 percent) indicated that traffic congestion is a significant concern that impacts their lives, and 25 percent said congestion was somewhat a concern that impacted their lives a little. They survey asked “What transportation investments should we make today that future generations will thank us for tomorrow?” and allowed respondents to provide their own openended answers. The majority of the answers involved clean transportation, public transportation and biking compared with much fewer for more or wider roads:
• 259 combined responses mentioned expanding areas served by rail transit or bike infrastructure; • 172 mentioned clean transportation (electric vehicles, buses, charging infrastructure, lower emissions);
• 134 responses mentioned more or wider roads or more lanes; and
• 72 responses mentioned improving the condition of (fixing and making more resilient) existing roads and bridges. Climate action in our transportation decisions is clearly a priority – evidenced by these survey results of residents as well as by elected official representatives on the TPB Board voting to prioritize projects that reduce GHG emissions. The survey had additional significant results suggesting that residents overall want to walk and bike more and drive less, and that they strongly support more street space for pedestrian areas, cafes, bike lanes, and bus lanes. While many residents expect to use transit less than they did before the pandemic, they also cited a number of factors, like frequent and reliable service, that would make them more likely to ride transit post-pandemic.63
84 percent of the region’s residents want elected officials to consider the impacts of climate change when planning transportation. Of the residents under 30 years of age, those who will be most affected by climate change and our long-range transportation plans, the percentage is 92 percent.
− TPB Voices of the Region Survey results
20
Action 1
Set Targets for Reducing Greenhouse Gas Emissions and Auto Vehicle Miles Traveled, and Increasing NonAuto Mode Share
Ensure that all regional transportation and land use plans and related major infrastructure projects quantify how they will reduce greenhouse gas (GHG) emissions and automobile vehicle miles traveled (VMT) consistent with adopted climate targets. Include mode share targets for boosting non-auto travel by transit, walking, biking or rolling (i.e., scooters and other micromobility).
Per capita VMT reductions needed to achieve our climate targets are in the range of 15 to 25 percent by the 2030-2045 timeframe compared to prepandemic levels. Likewise, the share of trips by non-auto modes must increase by 15 to 20 percentage points in this same timeframe.
For each of these targets, the region’s officials need to ensure that major plans and projects 1) measure recent year baselines, 2) set quantified goals consistent with overall GHG reduction targets for a year in the 2030 timeframe and a later year, 3) develop and commit to actionable strategies that can achieve the targets, and 4) incorporate a tracking mechanism and regular update schedule.
Specific Action Recommendations
Transportation Planning Board
The Visualize 2045 Update must prioritize reducing vehicle miles traveled and associated greenhouse gas emissions. This guidance was adopted by the TPB Board at its meeting on December 14, 2020.
a. Visualize 2045 draft update (conformity technical inputs) by June 2021 needs to be consistent with TPB guidance, which requires member agencies to prioritize projects, programs and policies 21
that reduce GHG emissions, increase non-auto travel mode share and reduce VMT. This means that the updated Visualize 2045 plan must be substantially different from the previous 2018 plan, which did not adequately support the region’s climate targets and help reduce VMT.
b. TPB needs to more precisely estimate the total and per capita VMT reductions needed to achieve 2030 and 2050 adopted climate goals under a range of scenarios and this analysis needs to be completed expeditiouslyi to shape the Visualize 2045 plan due to be adopted in 2022. Scenarios need to include:
o Varied Electric Vehicle adoption rates by 2030. o Update of regional climate target to 2050 carbon neutrality goal, consistent with Biden administration proposal and long-term GHG targets of other major metropolitan regions.
c. In the meantime, regional officials should assume that metropolitan Washington will need to reduce per capita VMT 15 to 25 percent and increase non-auto mode share 15 to 20 percent by the 2030 to 2045 timeframe compared to 2019 levels.
d. Establish baselines and targets for VMT and non-auto mode share for each sub-area of the region: Core (DC, Arlington, Alexandria), Inner Suburbs (Fairfax, Falls Church, Montgomery,
Prince George’s), and Outer Suburbs (Loudoun, Prince William, Manassas, Manassas Park,
Charles, Frederick).
e. Visualize 2045 Update and other regional plans must include GHG, VMT and mode share performance measures that include targets for 2030 and 2045 or similar medium- and long-term timeframes (see Action Step #6).
f. Incorporate in the Visualize 2045 Update the Mode Shift and Travel Behavior strategies from the COG 2030 CEAP and strengthen them to meet the VMT and non-auto mode share targets.
Other Regional Agencies and Local Governments
g. Ensure that other transportation and comprehensive plans at the local and regional levels, such as the Northern Virginia Transportation Authority’s TransAction 2040 Update, include GHG, VMT and non-auto mode share targets as performance measures (see Action Step #6).
h. Consider VMT measures and non-auto mode share, rather than vehicle Level of Service, for evaluating and mitigating the transportation impacts of new development.
i TPB announced at its December 4, 2020 Technical Committee meeting that it will conduct an analysis over the course of 2021 to assess what types of actions in the transportation sector could lead to attaining the interim goal of reducing GHG emissions in 2030 by 50% relative to 2005 levels. However, the GHG scenario analysis is scheduled to be completed by the end of the 2021 calendar year with results provided to the TPB Board in spring 2022, which would be too late to shape Visualize 2045. TPB has long known of the need to reduce VMT; therefore, jurisdictions should from the outset begin identifying which projects and programs contribute to reducing VMT and associated GHG emissions and remove projects inconsistent with regional climate goals.
22
Justification
What each type of target shows
GHG Targets for On-Road Transportation These show the connection with our climate mitigation goals and demonstrate whether the transportation plan or project is consistent with the scale of emissions reductions needed. The Rocky Mountain Institute (RMI) estimates that the U.S. needs to reduce transportation emissions by 45 percent by 2030 relative to 2005 to achieve its overall GHG target for all sectors. 64
Auto Vehicle Miles Traveled (VMT) Targets VMT targets show that transportation projects and plans do not just rely on assumptions of fuel economy improvements or electric vehicle sales in how they plan to reduce GHG emissions. Auto VMT shows how transportation plans and projects reduce the need to drive and travel distances.
Non-Auto Mode Share Targets
These show that people can conveniently access jobs and services by non-auto transportation modes. Projects and plans cannot just rely on assumptions for future telework that reduce overall VMT; they also need to show that people can conveniently travel by non-auto modes (transit, walking, biking and scooting) for non-work as well as work trips. Including nonwork trips is essential as these account for three quarters of our region’s daily trips.
How Much Does Our Region Need to Reduce VMT?
As detailed in pages 3-5, even with ambitious adoption of electric vehicles and a clean electricity grid, we cannot meet our climate targets without also reducing VMT. The range of per capita VMT reduction needed is likely in the range of 15-25 percent by sometime during 2030 to 2045.
GHG mitigation studies have identified needed per capita VMT reduction targets ranging from 15 percent by 2050 for California65 (which already has a relatively clean vehicle fleet and electrical grid) to 20 percent by 2030 for the entire U.S.66
Urban Area VMT Reductions Will Need to Help Offset Rural Area Travel
These targets cited in the RMI study and for California are for both urban and rural areas, meaning that much of the shift in travel modes and reduction in trip distances will need to occur in metro areas where that is more feasible. Nationally, 70 percent of VMT is from urban area travel while 30 percent occurs in rural areas.67 For the Greater Washington region to help Virginia (34 percent rural VMT) and Maryland (18 percent rural VMT) sufficiently reduce transportation emissions, its urban area VMT reductions will need to be higher than state or national level targets. Many suburban areas in particular may need to do more, for example, taking advantage of untapped transit-oriented development opportunities rather than focusing on more road expansion.
If our region can set a bold goal for a third of the cars on the roads to be electric by 2030, it can also set bold, necessary and achievable goals to reduce VMT and increase non-auto mode share. Addressing VMT and mode share also provides many co-benefits to the region that electric cars by themselves do not.
23
Bold VMT Goals Need to Accompany Bold EV Goals
The uncertain pace of EV adoption by motorists is even more rationale for why our regional leaders need to set bold VMT reduction goals and enact policies accordingly. RMI’s decarbonization scenario aims for a high adoption rate of 70 million EVs on the road nationally by 2030, about a quarter of the fleet. Likewise, COG’s 2030 climate scenario depends on a high rate of EV adoption, setting a goal to have a third of the region’s passenger vehicles be electric by that time. Our Transportation and Land Use Studies Have Demonstrated VMT Reduction
The ConnectGreaterWashington study by WMATA found a per capita VMT reduction of 24 percent from 2010-2040 (or 12 percent below the 2040 status quo) from a combination of travel and land use policies. 68 Similarly, TPB’s 2016 Multi-sector GHG reduction study modeled a land use scenario that by itself reduced total VMT 12 percent below forecast 2040 levels and a parking pricing and commute incentive scenario that reduced total VMT by up to 5 percent; additional individual strategies in the study decreased VMT by incremental but meaningful amounts. 69 Post-Pandemic Telework Could Play a Key Role But for Only Some Travel
Anticipated sustained increases in telework rates compared to pre-pandemic conditions could help accelerate these VMT reductions. However, the larger share of non-work trips and travel needs of residents who cannot work from home also need to be considered in strategies to reduce VMT – which is why we also need a mode share target.
Some of the existing alternative modes to auto travel in our region
Photo credit: Adam Fagen, licensed under Creative Commons
24
How much Does Our Region Need to Increase Non-Auto Mode Share?
Pre-pandemic, about 80 percent of all trips were made by car across the region, with 10.6 percent by walking and biking and 5.6 percent by transit (note that the share of commute trips by transit was 24.1 percent). 70, 71 Boosting the share of walking and biking trips by 5 to 10 percentage points and transit and telework/teleservices by about 10 percentage points by 2045 compared to pre-pandemic levels is feasible.
If our region focuses new development in walkable, mixed-use activity centers and underutilized Metro station areas, prioritizes investments in pedestrian and bicycle infrastructure, mobility hubs and transit services over highway expansion, and prices travel more efficiently and equitably, this mode shift can happen and bring benefits to all travelers. Transportation and Land Use Studies Have Demonstrated Mode Shift
The ConnectGreaterWashington regional land use and transit policy scenario increased the mode shares of transit to 15 percent and walk and bike trips to between 18 and 23 percent.72 The San Francisco Plan Bay Area 2050 scenario study found that proposed land use and transportation strategies would increase the non-auto mode share from 9 percent up to 21 percent for all trips under various future scenarios of the region.73 The Denver, CO region 2050 Metro Vision Transportation Plan likewise analyzed various packages of proposed strategies and found that infill development combined with transit and active transportation strategies resulted in six times the number of transit trips and triple the number of walk and bike trips compared to the future baseline scenario. 74
All of these strategies also significantly improved regional travel times and relieved congestion.

Multi-modal transportation on 14th St, NW, District of Columbia
Photo credit: BeyondDC, licensed under Creative Commons
25
Local Jurisdictions Are Already Setting Bold Mode Shift Goals
This goal would also be consistent with what some local jurisdictions are already planning. For example, Montgomery County, which reflects the broader region’s mix of urban and suburban areas, has set a goal in its draft Climate Action Plan to double the share of transit and bicycle trips by 2035.75
TPB’s New Guidance Requires Prioritizing GHG Reduction
On December 17, 2020, the TPB Board voted to change the Visualize 2045 guidance document for project submissions by member agencies: “…TPB requires its member agencies to prioritize investments on projects, programs, and policies to reduce greenhouse gas emissions, prioritize the aspirational strategies, and achieve COG’s land use and equity goals as they submit their inputs for inclusion in the TPB’s LRTP and TIP.”
Member agencies must now describe how their project submissions (including projects included in the previous Visualize 2045 plan) contribute to
Examples
● District of Columbia MoveDC transportation plan set a goal that 75 percent of commute trips will be made without a car, up from the 2018 rate of 58.5 percent.76 ● City of Alexandria Environmental Action
Plan sets a performance target of reducing VMT one percent per year by
FY2023 and requires documentation of the amount of carbon reduction from the transportation sector.77 meeting the region’s adopted 2030 GHG reduction target and whether they contribute to non-auto travel or reduce VMT.
TPB will compile the project submissions into a draft network along with other policy assumptions during March through June 2021. Following June approval, the draft plan will enter the conformity testing process, which lasts until early 2022. TPB typically makes no significant changes to the plan after it goes into the conformity analysis. Thus, it is critical that our region’s leaders, transportation officials and planners prepare an initial draft plan during spring 2021 that is consistent with TPB guidance to prioritize GHG and VMT reduction.
Few of our Current Plans and Projects Have Targets For These
Few of our region’s plans set specific baselines and goals for these essential indicators. For example, the 2018 Visualize 2045 regional transportation plan sets no quantified goals or performance measures for GHG, and includes a non-auto mode share goal that seeks an insignificant increase of 0.6 percent over four years, buried in Chapter 6 of the plan.
Examples from Other Regions
GHG Emissions Targets for Transportation
● Portland, OR metro area has a target to reduce per capita GHG emissions from passenger vehicles 20 percent by 2035 and 25 percent by 2040 (relative to 2005).78 ● California metro areas must reduce per capita GHG emissions from passenger vehicles 19 percent by 2035 (relative to 2005) on top of GHG reductions anticipated from statewide policies.79 ● Denver region Metro Vision plan sets a performance measure for 60 percent
26
reduction in surface transportation emissions between 2010 and 2040.80
Vehicle Miles Traveled (VMT) Targets
● Denver region Metro Vision plan sets a per capita VMT reduction goal of 10 percent by 2040, included in an online dashboard of indicators, and as a performance measure in current regional transportation planning processes.81 ● Each of the Twin Cities, MN set strong
VMT reduction goals in their transportation and climate plans.
Minneapolis, MN aims to reduce total
VMT 1.8 percent per year, and St. Paul aims to reduce per capita VMT by 2.5 percent per year. 82, 83, 84, 85 ● Portland, OR regional transportation plan includes a VMT performance measure.86
● California is working to reduce its total statewide VMT 7.5 percent below the 2035 baseline to achieve its 2030 greenhouse gas reduction target.87 This number is lower than we need for metropolitan areas because it includes
California’s extensive rural areas.
● Minnesota Department of
Transportation’s Sustainable
Transportation Advisory Council recommended a 20 percent reduction in
VMT by 2050 to help the state to achieve its adopted climate target.88

Takoma Park farmers market
Photo credit: Jordan Barab, licensed under Creative Commons (Greater and Lesser Washington group)
27
Mode Share Targets
General Mode Share
● City of Boston climate plan and transportation plan set coordinated goals for a four-fold increase in biking rates by 2030 and 50 percent increase in walking rates by 2030.89, 90 ● Portland, OR regional transportation plan sets tiered mode share targets for the different sub-areas of the region.91 ● San Francisco Bay Area Horizon
Initiative scenario plan includes a mode share performance measure for all trips (auto, active, transit, telecommute).92 ● Los Angeles Green New Deal Plan sets mode share goals of 35 percent by 2025 and 50 percent by 2035 for all trips made by walking, biking, micromobility/matched rides or transit.93 Commute Mode Share
● San Francisco region’s Plan Bay Area 2050 Final Blueprint decreases the drive-alone commute share from 51 percent in 2015 to 36 percent in 2050.94 ● City of Boston climate plan and transportation plan have coordinated mode share goals to cut the drive-alone commute rate by half and increase the public transit commute rates by a third by 2030.95 ● Denver region Metro Vision plan sets non-SOV commute mode share goal for 2040; it is being used as a performance measure in the current regional transportation planning process.96, 97
● Ann Arbor’s recently adopted climate action plan sets 2030 commuting targets of 25 percent of regional commute trips into the city by transit, and car commute trips into the city reduced by 25 percent.98
28
Action 2
Prioritize Transit Station Areas for Development and Services
Prioritize high-capacity and high-frequency transit station areas in walkable regional activity centers for housing and job growth, accessibility of services, and public investments.
In our region COG defines high-capacity transit as Metrorail; commuter rail (MARC and VRE); light rail (e.g., Purple line); and Bus Rapid Transit (BRT)/Streetcars. While there is no standard Washington region definition for highfrequency transit, one simple indicator is an average frequency of 15 minutes or less averaged across day and evening (CNT AllTransit Index).
Specific Action Recommendations
a. Provide additional metrics in the Visualize 2045 Update to evaluate how well the transportation system serves high-capacity station areas and major bus transfer centers, including equity measures.
b. Identify more fine-grained housing and jobs target areas and develop goals for future development occurring in these new sub-areas, which would complement, not replace, the current COG activity centers. Use numerical benchmarks to identify these sub-areas based on: • High-capacity and high-frequency transit station areas • Walkable mixed-use areas
• Locations with high regional accessibility • Balancing the east-west jobs-housing divide • Other important built environment or demographic criteria identified in the literature for activity centers that improve non-auto travel and reduce VMT
c. Incorporate these stronger land use targets in regional plans like Visualize 2045 and TransAction. • Prioritize transportation projects that support transit-oriented land use; and
29
• For Transaction2040 do not compile project lists and model first, and then later apply a transit-oriented development (TOD) scenario. Instead, start with the TOD scenario from the beginning.
d. Implement these policies at the local level through updated comprehensive and small-area plans, zoning ordinances, capital improvement plans, housing programs, and other growth policies.
Justification
Importance of Land Use in Reducing Transportation Emissions
Land use, including the locations of jobs and housing and how community design supports transit and walkability, plays a major role in transportation emissions. Efficient land use and community design enable proximity to destinations and facilitate walking, biking and transit use to reach them – and significantly reduces transportation greenhouse gas emissions. For example, the WMATA study ConnectGreaterWashington showed the significant transportation and climate benefits of building out TOD at all of our Metro stations, especially those on the east side of the region its scenario to help balance land use and travel reduced VMT by 12 percent.99 The Importance of High-Capacity Transit Stations in Regional Activity Centers Metropolitan Washington uses its designated “Regional Activity Centers” (RACs) as the targeted locations for most of our future jobs and housing growth. While many regional activity centers have compact, mixed-use, walkable areas with robust transit, there are also many that consist of dispersed office parks and poorly connected apartment and shopping complexes, with little or no transit – and where residents have to drive even more than the suburban average. Meanwhile, when looking specifically at high-capacity transit station areas in RACs, we find many where households drive significantly less, especially in the inner suburbs and core communities. The analysis by the Coalition for Smarter Growth in Table 1 shows the kinds of places in the region that will provide a successful transportation-land use-climate strategy. Building on Our Regional Housing Target COG’s 2030 Climate and Energy Action Plan recommends putting 75 percent of our new housing in RACs with high-capacity transit stations (based on Regional Housing Target #2), which is a good start. But to really capture the proximity and efficient benefits of good land use and transit, our region needs to set further policies to prioritize walkable and compact areas with good transit and regional accessibility for development in the region.
Suburban officials can retrofit areas to be more walkable, compact, and transit-friendly. For example, households in the Mosaic District of Fairfax County are estimated to drive on average 15,500 miles per year and generate 5.9 metric tons of CO2 emissions compared to the Inner Suburb average of almost 20,000 miles per year and 8.4 metric tons of CO2. Coalition for Smarter Growth analysis using CNT H+T Index data
30
What factors make an activity center ideal for efficient proximity and travel?
This land use strategy of “polycentric” development, identifying and prioritizing a network of activity centers for new development in addition to the central business district, is being used in a number of metropolitan regions as well as in metro Washington. Recent analyses by Reid Ewing and other researchers show how this land use framework can significantly reduce VMT by encouraging walking trips and facilitating efficient travel patterns. However, to do this, they found that activity centers need to meet the following minimum thresholds: • Activity density (jobs + population) of at least 10,000 to 25,000 per square mile (depending on center type); • Job-population balance of at least 0.2 to 0.5 (depending on center type); • Intersection density of at least 150 to 300 intersections per square mile (depending on center type); • Share of four-way intersections at least 60 percent; and • Share of regional employment accessible within 30 minutes by transit at least 5 to 35 percent (depending on center type). 100

US 29 Flash BRT and Capital Bikeshare station, Burnt Mills, Montgomery County Example of type of location suitable for transit-oriented redevelopment
Photo credit: BeyondDC licensed under Creative Commons
31
Examples
● Our region’s activity centers with highcapacity transit and good accessibility support average household GHG emissions from auto use in the range of 3-6 metric tons of CO2 per year, while those on the outer fringe without good transit have household emissions that can average over 11 metric tons per year.101 ● CSG’s 2016 GreenPlace study found that TOD projects in the region’s core averaged 17 to 25.5 daily VMT per household and 16-25 lbs of daily carbon output per household, compared to regional household averages of 45 daily
VMT and 69.4 lbs daily carbon output from driving.102 ● CSG’s 2010 Cool Communities study compared the locations of small area plans and large-scale developments and demonstrated the benefit of areas with high walkability, mix of uses, and frequent transit service. For example, the New Carrollton TOD plan generates 11.2 percent fewer travel-related carbon emissions compared to relocating the same planned development to the
Konterra area next to I-95 and the
Intercounty Connector.103
Examples from Other Regions
● The Chicago region vision plan measures community walkability and sets goals for growth in walkable areas.104
● The City of Los Angeles Green New
Deal Plan has a goal for 75 percent of new housing to be within 1,500 ft. of transit by 2035, including provisions for on-site affordable units.105
● The San Francisco Bay Area regional plans have multiple tiers for concentrating new regional job and housing growth, including transit priority areas and high resource economic opportunity areas served by transit, as well as more general priority development areas in urban centers and demarcated conservation areas where growth is significantly restricted.106, 107 ● The Thrive MSP vision plan for the Twin
Cities, MN region has an online dashboard of indicators, including one for the percentage of transit station areas with housing options.108
32
Action 3:
Make Affordable Housing in TransitAccessible Locations a Climate Strategy
Implement adopted regional housing targets and prioritize locations near frequent transit for affordable housing production and preservation.
Specific Recommendations
a. Set a housing goal and affordable housing goal for each jurisdiction to accommodate 75 percent of household growth in high-capacity transit station areas.
b. Leverage HAND Housing Indicators Tool to track affordable housing policies and production for each area jurisdiction.
c. Track affordable housing in transit station areas and high-frequency transit corridors.
d. Establish programs to prioritize affordable housing investments in transit station areas and highfrequency corridors with good access to jobs; programs should address both production and preservation goals for affordable housing.
e. Update zoning ordinances to allow more housing options in our urban and suburban communities served by transit but currently restricted solely to single-family detached zoning.
f. Improve the safety and convenience of walking and biking in transit station areas and corridors with significant numbers of low- to moderate-income and zero-car households.
g. Protect areas of affordable housing from the already occurring effects of climate change that disproportionately threaten their residents.
Justification
Providing affordable housing in close-in, regionally accessible locations near transit is both a social equity strategy and a climate strategy.
33
Lessons from our Region Within our region the benefits of affordable housing near jobs and transit are evident: ● Housing Leaders Group of Greater Washington: “The prospects for upward economic mobility and self-sufficiency depend critically on the availability and affordability of housing that is connected to jobs, transit, and other amenities and services.”109
● Although low- and medium-income households have less access to personal cars and use transit more to get to work,110 they are currently underrepresented in neighborhoods around Metrorail stations compared to higher income households – in both DC and surrounding jurisdictions.111 ● Transit-accessible locations not only improve job access, they also save households money in transportation costs. Average household transportation costs are significantly lower in the core jurisdictions and inner suburban activity centers of our region, as shown in
Figure 7. These locations have good transit, walkable neighborhoods and regional accessibility compared to autooriented inner suburban areas or most outer suburban areas. For example, a household living near the Takoma-
Langley Transit Center in Maryland would expect to spend about $9,000 per year on transportation costs, in contrast to the average Prince George’s County household, which would spend about $13,000 – or a household in the
Westphalia area, which would spend $15,000 per year.112 ● Achieving the COG Regional Housing
Targets will provide other benefits for the whole region. TPB estimates that it would reduce congestion by 20 percent.113 Lessons from Other Regions Experience in other parts of the country shows the benefits of this strategy, in particular California. For example, an analysis of statewide travel data by the organization TransForm showed that “Lower Income households drive 25-30% fewer miles when living within 1/2 mile of transit than those living in non-TOD. When living within…1/4 mile of frequent transit they drove nearly 50% less.” As a result, investing 10% of state cap-and-trade program revenues in the state’s TOD Housing program over three years would yield 15,000 transit-accessible affordable homes. These locations would result in a total decrease of 105 million VMT every year, which, over the life of the housing development, equate to 1.58 million metric tons of GHG reductions, even considering advances in cleaner cars and fuels.114
Additional Policies Needed to Improve Safe Accessibility of Transit, Destinations Supportive policies to improve accessibility and safety within transit-station areas and along transit corridors that serve high proportions of low-to-moderate income households and workers are also needed.
● Urban and suburban communities of low-to-moderate income individuals and people of color are often especially at risk from poor street design and the lack of safe walking access to transit stops, as documented in the recently published book Right of Way: Race, Class and the
Silent Epidemic of Pedestrian Deaths in
America by Angie Schmitt. 115 ● Locating affordable housing near transit by itself is not enough to reduce VMT.
Other neighborhood factors (walkable street design, availability of services) are also important to reduce the need for low-to-moderate households to drive.116
Housing Security and Climate Change Low-to-moderate income households are already more at risk of displacement due to the 34
impacts of climate change, so housing security needs to be a key element of both our climate mitigation and climate resiliency efforts. A recent review of studies on the relationship between climate change and displacement found that “Low-income groups and communities of color, particularly African American and Hispanic communities, are often more likely to experience financial hardships related to climate hazards and physical displacement in the wake of extreme weather events.”117

The Wren, near U Street/African-Amer Civil War Memorial/Cardozo Metro station, 132 affordable units provided for DC public land disposition of parcel
Photo credit: Cheryl Cort
Examples
● Montgomery County adopted a Metro
Station Development 15-year Tax
Abatement for projects on WMATA land, tied to strong affordable housing requirements (12.5 percent and in some cases 15 percent moderately priced dwelling units). 118 ● District of Columbia Housing Framework for Equity and Growth 119 o The District has a goal of producing 36,000 more homes by 2025, with 12,000 of them affordable. Each part of the District served by bus and rail is to have 15 percent of its homes be affordable by 2025 under the proposed Comprehensive Plan. o Public land disposition (sale of
District of Columbia-owned property) requires that new housing development on sites near transit set aside 30 percent of units as affordable housing, compared to 20 percent on sites farther from transit. 35
Photo of example project above, The Wren, 965 Florida Ave NW. ● The City of Alexandria and Montgomery
County both adopted resolutions endorsing the COG Regional Housing
Targets. They each set local targets to increase housing production above their forecasts with 3,000 and 10,000 additional units, respectively. 120, 121 ● The Urban Institute found that modest changes in zoning scaled up across the region could result in significant new housing near Metro stations and in activity centers. They conducted an illustrative exercise that assumed a 20 percent increase in density in such areas (and no increase in already dense areas) in DC, Arlington, Fairfax, and
Montgomery Counties and found that it would accommodate approximately 50,000 to 60,000 new homes.122 ● Enterprise Green Communities
Certification Program for affordable housing includes “Location +
Neighborhood Fabric” criteria that require projects to meet minimum transit accessibility thresholds and award additional points for proximity to community resources and dedicated bicycle facilities. This is a national program but a number of local projects have been implemented in our region. In
DC the program is required under the
Green Building Act for projects that receive over 15 percent of their funding from public sources. 46 projects comprising 4,087 units have been registered in DC to date. 123, 124 ● Local toolkits and policy resources for implementing affordable housing in accessible, transit-served locations: o Housing Leaders Group of Greater Washington, Guidebook for Increasing Housing Affordability in the Greater Washington Region, 2017.
o NVAHA, Building Northern Virginia’s
Future: Policies to Create a More
Affordable, Equitable Housing
Supply, 2019. o Urban Institute, Meeting the
Washington Region’s Future
Housing Needs, 2019. o The Case Made, A New Narrative for Housing: Playbook for the
Greater Washington Region, 2020.
36

Wheaton Metro station with MetroPointe mixed-income apartments in the background
Photo credit: Dan Reed, licensed under Creative Commons
Examples from Other Regions
● The Commonwealth of Massachusetts now requires municipalities to allow multi-family housing within ½ mile of transit stations and created a $50 million transit-oriented affordable housing program.125, 126 ● California Affordable Housing and
Sustainable Communities program has used greenhouse gas cap-and-trade revenues to provide 11,317 dedicated affordable homes near transit, with lifetime GHG reductions of 3.0 million metric tons and annual VMT reductions of 269 million since inception. The program also enhances transit services, access to transit stops, and active transportation infrastructure in the vicinity of funded housing developments. 127, 128 ● Chicago is establishing an Equitable
Transit-Oriented Development (eTOD)
Policy Plan to ensure that the benefits of TOD are widely and equitably distributed to city residents.129
● Los Angeles, CA “Transit-Oriented
Communities” program and Austin, TX provide density bonuses and have higher affordability requirements near transit. The LA program has tiers for type and frequency of transit.130 ● The BeltLine transit and multi-use trail corridor in Atlanta, GA has a zoning overlay district with inclusionary zoning for affordable housing.131 Recently a partnership of finance companies and the metro area’s main transit agency,
MARTA, created a $100 million Greater
Atlanta Transit Oriented Affordable
Housing Preservation Fund. 132 ● Denver, CO is developing a citywide zoning incentive program to create affordable housing near transit as a
37
result of its Blueprint Denver and
Comprehensive Plan 2040. 133 ● Transit agencies in a number of cities have affordable housing goals, programs and requirements for joint development on their station area properties. These include Sound Transit in Seattle, BART and VTA in the San
Francisco Bay Area, Los Angeles Metro, and a draft policy by RTD in Denver,
CO. Some of these agencies have revolving loan funds.134, 135 ● The Twin Cities, MN region maintains a regional indicator of the percentage of transit station areas with affordable housing options on its web-based dashboard that tracks progress in reaching regional vision goals.136
● The Chicago region’s vision plan sets targets for not just housing affordability, but the combined affordability of housing and transportation costs, which take into account locations with walkable proximity to transit and daily needs.137

Tenley View Apartments, near Tenleytown-AU Metro station, affordable units provided to meet DC inclusionary zoning requirements
Photo credit: Cheryl Cort
38
Action 4
Optimize and Leverage Transportation Pricing
Enact pricing strategies to address transportation equity, reflect the true cost of driving and parking, and recognize sustainability – for example, commuter benefit cash-outs, reduced transit fares, parking pricing and unbundling, usagebased car insurance, and congestion pricing on existing highway lanes.
Specific Recommendations
a. Reduce fares or make transit free, especially for low-income users.
b. Decouple pricing from proposed highway expansions. Additions to the region’s express highway toll network should only include repurposing existing travel lanes and not expand highway capacity.
c. Eliminate free parking for employees and establish market rate parking pricing for commuters.
d. Require commuter benefit and parking subsidy cash-out options.
e. Continue studying congestion pricing for the region’s core.
f. Require that usage-based, or “pay-as-you-drive,” car insurance products are offered as options in the region by insurers, and educate regional stakeholders on their advantages.
Justification
Best Practices
The American Cities Climate Challenge Climate Action Playbook Brief138 recommends the following pricing strategies for cities to reduce transportation emissions from VMT: ● Promote Commuter Incentives to Reduce Driving. ● Provide Incentives and Behavioral
Nudging for Use of Low-carbon Mobility
Modes.
● Utilize Parking Management and Pricing to Encourage Low-carbon Travel. ● Implement Congestion Pricing and/or
Low Emissions Zones for Priority Areas.
39
Specific types of strategies that are mentioned as being effective in these areas are: ● Cordon pricing, which charges drivers a fee to enter a specific area; lowemissions zones, charging vehicles extra if they are not low or zeroemission; and reinvestment of revenues in sustainable and equitable transportation options such as transit service improvements. ● Eliminating off-street parking requirements and incorporating other transportation options in urban development. ● Charging market rates for curb parking and reinvesting parking revenues in the neighborhood. ● Unbundling parking, by making landlords charge for parking separately so people do not have to pay for parking they may not want or need. ● Using gamification and incentives to educate travelers on the benefits and availability of travel options. An additional pricing strategy not included in the Playbook Brief is usage-based (“pay-as-youdrive” or “pay-as-you-go”) car insurance. These products exist in many places, offer drivers financial savings, and incentivize less driving (2.7 percent estimated by one study) compared to traditional fixed-cost insurance.139 DC, Maryland and Virginia could expand availability of these products in the region by requiring that insurers offer them.
These types of market-based reforms that price transportation modes efficiently and fairly, if implemented together, could significantly reduce VMT, with estimates of 35 to 50 percent.140

Employee parking, Danish Embassy, District of Columbia
Photo credit: Payton Chung, licensed under Creative Commons
40
Local Guidance from the COG Climate Plan
The COG 2030 Climate and Energy Action Plan (CEAP)141 includes the following Mode Shift and Travel Behavior strategies with pricing elements: ● MSTB-1: Invest in Infrastructure that Increases Transit, Carpooling, and Nonmotorized Travel
● MSTB-3: Enhance Options for
Commuters
While these are good strategies and the plan lists some examples of specific actions that can be taken in these areas, the 2030 CEAP’s recommendations are incomplete, leaving goals and well articulated strategies up to transportation agencies and localities. Good potential strategies included, but more can be done
For example, the CEAP asks local member jurisdictions to “Discontinue free parking at employment sites within Activity Centers and near high capacity transit stations,” and expand commuter transit benefits for workers, which are both good strategies. But metro areas are doing much more, like decoupling parking costs from housing rents and homeowners fees, requiring that employees have the option to cash out commuter benefits and parking, and bringing up the monetary value of commuter benefits for non-drivers to be on par with those of drivers so everyone can benefit. For example, following a Coalition for Smarter Growth campaign, the District of Columbia adopted flexible commuter benefits that allow DC workers to “cash-out” employer-provided parking benefits if they walk, bike or take transit to work. The Commonwealth of Virginia and the State of Maryland could adopt similar measures to ensure that workers have these options for fair and flexible commuter benefits. Express toll lane strategy does not differentiate highway expansion and pricing The CEAP lists this aspirational strategy from the region’s 2018 transportation plan, Visualize 2045, but does not clarify that expanding the express highway toll network is only an effective GHG reduction strategy if it is used on existing travel lanes and does not expand highway capacity. Heavy focus on commuters and telework, but most trips are for non-work purposes Strategy MSTB-3: Enhance Options for Commuters sets a 20 percent telework rate goal that may happen regardless due to long-term shifts accelerated by the pandemic. For example, the Denver region is already assuming a 20 percent telework rate going forward beyond 2023. Thus, a mode share target for non-SOV commuting needs to be articulated so we make sure that sustainable, convenient and low-cost travel modes are available for the remaining 80 percent of workers. Land use and travel options that support commuting by walking, biking and transit will also facilitate more climate-friendly non-work trips, which comprise three quarters of the trips made in our region. Creating 15-minute walkable mixed-use neighborhoods, including in the suburbs beyond our transit station areas, is key to reducing VMT and emissions for nonwork trips.
Express Toll Lanes Strategy has Been a Highway Expansion Strategy
Our region’s roadway pricing strategy has really been a highway expansion strategy, with projects like the Intercounty Connector and added High-Occupancy Toll lanes on the Beltway that lock in and reinforce patterns of single-occupant auto travel and car-oriented land use. Past TPB modeling has shown that increasing highway capacity, even with express toll lanes and added transit, does not reduce GHG emissions:
41
Past TPB Studies
The 2010 Aspirations Scenario included a regional network of tolled lanes and transit investments. 2030 VMT increased in this scenario (with no meaningful change in per capita VMT) and also had a significant 56% increase in VMT at speeds of 65mph and greater.142 Likewise, the 2017 TPB Long-Range Plan Task Force study showed that the Express Travel Network strategy did not reduce GHG emissions.143
Proposed MD I-495/270 Expansion
This approach – highway capacity expansion through toll lanes with bus transit and modest land use clustering – does not meaningfully shift travel to more sustainable modes and reduce trip distances. A recently completed study by Smart Mobility Inc. of the Maryland I-495/270 toll lane proposal, including a look back at the Virginia 495 toll lanes, confirms this.144 The Balanced Land Use, Demand Management, and Transit Network strategies from the 2017 TPB Long-Range Plan Task Force study all performed better than the Express Travel Network, and would be even more effective in combination.

MD Intercounty Connector
Photo credit: Doug Kerr, licensed under Creative Commons
Examples
● The District of Columbia Transportation
Benefits Equity Act145 requires employers who provide free or subsidized parking to employees to offer, with some exemptions, these alternatives:
o Employer-paid transit benefits o Taxable cash for employees who walk, bicycle, or ride in a carpool to work, or who take transit (where cash would make up any difference 42
between the value of the parking and transit cost) o Increased employer contribution to an employee’s healthcare benefit ● The State of Maryland Commuter Tax
Credit program applies to parking cashout programs offered by employers.146 ● A Decongestion Pricing Study is underway for the region’s core, testing potential alternative pricing strategies for
District of Columbia streets and highways and evaluating outcomes, including impacts on vulnerable users.
The study is being undertaken by the organization D.C. Sustainable
Transportation.147 ● Multiple jurisdictions have instituted changes in parking policies and piloted projects for pricing of on-street parking and curbside use and requirements for off-street parking facilities in new development. Arlington County has developed a program to pilot variable pricing in the Rosslyn-Ballston corridor, and the District of Columbia has used a similar program in part of its downtown area.148
Examples from Other Regions
● The San Francisco region Plan Bay
Area 2050 has set a strategy to implement per-mile tolling on congested freeways where transit alternatives exist, with discounts for low-income residents and carpools and with revenues invested in corridor transit services.149
● Seattle is studying congestion pricing for the region’s core.150
● Vancouver, BC is planning to implement a congestion charge for vehicles to enter the metro area core, as part of its recently approved Climate Emergency
Action Plan. 151

On-street parking, Somerset Place, NW, District of Columbia
Photo credit: Mike Maguire, licensed under Creative Commons
43
Action 5
Broaden Vehicle Electrification Strategies with Shared Mobility and Micromobility
Include electric bikes, scooters, mopeds, buses, shared mobility, and mobility hubs in a broader “e-mobility” strategy that includes equity provisions.
Specific Recommendations
a. Prioritize shared e-mobility solutions and non-auto electric modes and focus on electrifying those vehicles that get the most use (e.g., transit and school buses, institutional fleet vehicles, car share and ride hailing vehicles).
b. Implement “mobility hubs” (defined below) in activity centers, at high-capacity transit stations, and in other locations with community mobility needs.
c. Set targets for electrifying the region’s fleets of transit buses, school buses, and other local government vehicles and reducing overall medium- and heavy-duty fleet emissions.
d. The ZEV strategies should also include equity-focused implementation metrics to ensure that incentives, charging infrastructure and other EV programs benefit all communities.
Justification
Shared Mobility
Shared e-mobility solutions, micromobility, and electric transit buses and shuttles can substitute for many short distance or commute car trips by personal vehicles.152 Travel on these alternative modes has many more co-benefits (i.e., other societal benefits in addition to reducing GHG emissions) compared to electric cars (see page 12). In the case of e-micromobility (electricassist bikes, electric scooters), these modes have much smaller batteries and are much more affordable than electric cars. In the case of shared-use electric vehicles (i.e., carshare), these vehicles are used more frequently than a personally owned car, providing more bang-forthe-buck in terms of reducing carbon emissions and other environmental impacts when replacing a conventional gas-powered car with an electric one.153, 154 For example, in California, the shift to an EV for a ride hailing worker reduces GHG emissions three times as much as for a typical car owner not engaged in ride hailing.155
44
Shared mobility is viewed as the critical third piece of the major technological revolution occurring in personal transportation, the others being electrification and automation. Without shared mobility, traffic congestion and the parking and energy needs of our transportation system will grow much more significantly. 156
More Equitable E-Mobility
Many households, including low-to-moderate income households, without good transit access and difficult-to-reach job locations will continue to rely on personal automobiles for some of their transportation needs. Efforts to speed up the transition to EVs need to incorporate programs that allow car-dependent lower-income households to have clean mobility options that meet their needs. For example, many multifamily dwellings lack access to vehicle charging outlets, and the high up-front cost of EVs (lack of a used car market in most places) put them out of reach of most lower-income households, even with rebate programs.157 Even some places ahead of the curve in adopting EVs and installing charging infrastructure are finding that 90 percent of chargers are currently in singlefamily homes. Most EVs are sold to owners in detached homes (80-90 percent in some cities), and less than half of apartment dwellers having access to home charging. 158, 159 Ride hailing workers with EVs also depend much more heavily on publicly available charging stations compared to average EV owners, due to their driving patterns as well as availability of charging at home. 160 Local governments need to expand access to charging infrastructure for multi-family residents through public charging stations and EV-ready development ordinances for new residential construction. States and localities also need to create EV purchase, trade-in, leasing, charging equipment, and carshare programs geared toward lower-income households and those in multi-family housing, in addition to general EV purchase rebate programs available to all buyers regardless of income. State-level EV equity policies (including the District of
Columbia) are evaluated by the ACEEE State Electrification Scorecard. 161
Mobility Hubs
The Shared-Use Mobility Center defines a mobility hub as “a place where people can seamlessly connect with multiple modes of transportation in a safe, comfortable, and accessible environment…mobility hubs provide physical integration among modes by colocating carsharing, bikesharing, and other shared-mobility services close to public transit stops and large residential developments.” The Mobility Hub concept is widely used in Europe and now expanding in the U.S. The Shared-Use Mobility Center has a guide of best practices, essential features, and context typologies for successful hubs.162
Other mobility hub concepts being explored by the New Urban Mobility Alliance (NUMO) incorporate co-location with other community services, such as food, retail, package pickup/drop-off, broadband, and co-work locations. While mobility hubs are typically located at a transit stop, some locations may serve community centers not directly on a fixed-route transit line, helping extend the reach and accessibility of the transit service and offer other mobility services.163
“[Mobility hubs] offer visibility to and connection between public transit and shared mobility services that in turn support multimodal living and reduced dependence on personal cars and solo driving.” Shared-Use Mobility Center
45
A Broader Electric Mobility
While the COG 2030 Climate and Energy Action Plan’s Zero Emission Vehicle strategies set ambitious and well-articulated electrification targets for passenger cars and associated charging infrastructure, none of the strategies mention electric-assist bicycles, electric scooters or electric mopeds. These e-mobility options are more sustainable, more affordable and offer more co-benefits from their GHG reductions than electric cars.
Successful shared mobility and e-micromobility strategies can broaden the availability of clean vehicles compared to the up-front personal expense and the typical government incentives for electric cars. A rebate to incentivize purchase of a micromobility device would be a fraction of a typical EV rebate incentive provided by many states for new car purchases, covering many more potential buyers for the same amount. For example, New Jersey which has an ambitious EV program, provides rebates of up to $5,000. In Virginia, the General Assembly study commission recommended a standard rebate for a new EV of $2,500.164

Electric-assist shared bikes, Dupont Circle Metro station
Photo credit: angela n., licensed under Creative Commons
46
Examples
● District of Columbia’s Carbon Free DC 2050 initiative proposes to track the share of zero-emission VMT (out of total
VMT) to better assess and maximize the emissions impact of its vehicle electrification efforts. 165
● Multiple transit agencies have started to electrify their bus fleets, including the
DC Circulator and Alexandria DASH.
WMATA has conducted a study of infrastructure and energy needs for fleet electrification and is currently conducting a battery electric bus pilot project. 166 The Sierra Club has published a report showing the significant climate and other benefits of
an eventual transition to all electric buses in the Metrobus system.167 • In January 2021, the District of
Columbia adopted the Electric Vehicle
Readiness Amendment Act of 2020, which will help expand EV charging to multi-family housing, requiring new developments with off-street parking to provide EV charging infrastructure for 20 percent of parking spaces.168 The
District Department of Environment and
Energy is convening a Stakeholder
Equity Feedback Group for its
Transportation Electrification Roadmap project underway in 2021.
Examples from Other Regions
● Over ten localities, two states and several European countries have electric bicycle purchase incentive programs.169 ● San Diego Forward regional transportation plan and the Sacramento region Green Region Plan make mobility hubs key elements. These serve the full suite of mobility options, with an emphasis on shared, electric and active mobility, including e-bikes, scooters, and transit as well as carshare and charging stations for personal cars. Both regions incorporate strategies to ensure that disadvantaged communities benefit.170,
171
● City of Boston climate action plan EV deployment strategy includes permitting action steps for electric micromobility, ebikes and e-scooters; and for passenger cars sets clear equity-based policies and has metrics to locate charging infrastructure in every neighborhood by 2023 and to ensure that 100 percent of residents are within a 10-minute walk of public EV chargers or EV carshare facilities.172
● Minneapolis has created 25 mobility hubs as part of a pilot project, which are being coordinated with an electric car share program. The hubs are distributed throughout the city based on a datadriven approach that prioritizes equity.
The hubs provide transit, bikeshare, and electric scooter services and additional amenities and have volunteer community ambassadors.173, 174 • Santa Monica, CA is launching a zeroemission delivery zone in February 2021 that will use only small electric vehicles for food and package deliveries.175 • Sacramento Air Quality Management
District has an EV carshare program directed to affordable housing residents that provides up to nine hours of free driving time a week per household. The program has helped many households avoid the need to purchase a second
47
car. The city subsidizes the program with state GHG cap-and-trade revenues and is looking into ways to create a longer-term funding model.176 • The State of California runs an array of clean transportation equity programs, comprising car-ownership programs and multimodal clean mobility programs. A
“One Stop Shop” webtool and outreach program has been piloted and will expand to connect lower-income residents with the relevant mobility assistance programs and facilitate the application processes. 177 • The Twin Cities Electric Vehicle Mobility
Network is creating a combined EV charging network and car share program. The siting guidelines take into account density of renters, public housing, one- or zero-car households, and other factors.178
• Grant programs and partnerships with utility companies can help make EV charging equipment accessible for existing multi-family and affordable housing developments. For example, the San Diego Gas and Electric “Power
Your Drive” program coordinates reduced-cost installation of charging stations at multi-family developments and awards fully subsidized charging stations to program applicants in lowincome communities.179 The Washington State “Electrification of Transportation Systems” grants program similarly provides state-level grants for EV charging infrastructure, with priority for communities impacted by climate change and transportation-related pollution and to low-income or communities of color.180

ART Bus and Bird scooters, Arlington County
Photo credit: BeyondDC, licensed under Creative Commons (original image cropped to fit column)
48
Action 6
Track Local and Regional Progress
Establish clear integrated regional benchmarking and performance tracking of transportation, housing, and land use metrics related to greenhouse gas emissions (e.g., housing and jobs near transit, affordable housing, VMT, and mode share for work and non-work trips), at local, sub-regional (core, inner suburbs, outer suburbs), and regional levels.
Specific Action Recommendations
a. Visualize 2045 needs to further demonstrate the linkage between projects and performance by incorporating shared regional goals into the Performance Based Planning and Programming measures, with targets set for 2030 and 2045. In this way, priority regional measures like greenhouse gas emission reductions, VMT, access to transit, mode share, and equitable access to jobs and services will be clearly incorporated.
o These measures, targets and implementation metrics must be presented in a clear chapter of the plan and should also be available in a convenient online dashboard, with actual performance, baseline level, and future targets compared.
o Some of the measures like mode share should include sub-regional targets.
b. Other regional and local transportation, comprehensive, and climate plans need to set targets for and track similar priority measures, including greenhouse gas emission reductions, VMT, mode share, access to jobs and services, and access to transit.
Justification
Few of the region’s plans and projects have established quantified goals to reduce GHG emissions and even fewer actively track these and the related performance measures needed to monitor progress and hold agencies accountable.
For example, the COG 2030 Climate and Energy Action Plan includes Strategy MSTB-1: Invest in Infrastructure that Increases Transit, Carpooling, and Non-Motorized Travel and lists implementation metrics related to reducing transit headways and fares. To really measure progress, our transportation plans need to also set targets and commit to action steps like miles of dedicated bus lanes built, bus network redesigns completed, and set targets for bus frequency, accessibility, ridership, and active transportation and transit mode shares. Mode share goals should be set for sub-areas (core, inner, outer) with a need to make significant
49
progress in the suburbs. Regional travel surveys show that suburban areas have not meaningfully shift their mode shares over the last decade. 181
Visualize 2045 includes mandated federal measures for tracking progress, but most of these are not meaningful to the public or
Examples from Other Regions
● Denver region transportation performance measures from its Vision
Plan are incorporated into convenient online trackers of mobility goals and regional status updates. 182 ● Twin Cities, Minnesota regional vision plan has an indicator dashboard (example below). 183
stakeholders, focusing mostly on highways and setting minor, incremental goals over four-years that are not connected to regional priorities. Critically, these performance measures say nothing about how the region’s transportation system is addressing climate change.
Figure 11: Thrive MSP Online Dashboard, Equity Indicators Example

Source: Metropolitan Council. Thrive MSP 2040. Indicators website. Accessed December 7, 2020.
50
References
1 Metropolitan Washington Council of Governments (COG). (October 14, 2020) Certified Resolution R45-2020 Endorsing Regional Climate Mitigation and Resiliency Goals. https://www.mwcog.org/documents/2020/10/14/certified-resolution-r45-2020---endorsing-regional-climate-mitigationand-resiliency-goals/ 2 COG. (November 2020). Metropolitan Washington 2030 Climate and Energy Action Plan. https://www.mwcog.org/documents/2020/11/18/metropolitan-washington-2030-climate-and-energy-action-plan/ 3 Ibid. See pages 27-30 for recent year regional emissions and business-as-usual projections. See pages 30-31 for the COG plan 2030 scenario, showing the significant expected contribution of adopted state-level mandates for the electricity sector. 4 Lashof, Dan and Devashree Saha. (September 28, 2020). “California Shows How the U.S. Can Reduce Transport Emissions.” In The City Fix, World Resources Institute Ross Center. https://thecityfix.com/blog/california-shows-howthe-u-s-can-reduce-transport-emissions-dan-lashof-devashree-saha/ 5 Milovanoff, A., Posen, I.D. & MacLean, H.L. (2020). Electrification of light-duty vehicle fleet alone will not meet mitigation targets. Nat. Clim. Chang. https://doi.org/10.1038/s41558-020-00921-7 6 Alarfaj, Abdullah F., W. Michael Griffin, and Constantine Samaras. (2020). Decarbonizing US passenger vehicle transport under electrification and automation uncertainty has a travel budget. Environmental Research Letters 15 0940c2. https://doi.org/10.1088/1748-9326/ab7c89 7 Smart Growth America and Transportation for America. (October 2020). Driving Down Emissions: Transportation, land use, and climate change. https://smartgrowthamerica.org/resources/driving-down-emissions/ 8 National Academies of Sciences, Engineering, and Medicine. (2021). Accelerating Decarbonization of the U.S. Energy System. Washington, DC: The National Academies Press. https://doi.org/10.17226/25932. See pages 53 and 85. 9 Nadel, Stephen, and Lowell Ungar. (September 2019). Halfway There: Energy Efficiency Can Cut Energy Use and Greenhouse Gas Emissions in Half by 2050. American Council for an Energy-Efficient Economy, Report U1907. https://www.aceee.org/sites/default/files/publications/researchreports/u1907.pdf 10 Goss, Brenda. (January 28, 2021). “How to Move America to Electric Vehicles: From a Rudderless to a Resolute 2030 EV Vision.” Rocky Mountain Institute. https://rmi.org/how-to-move-america-to-electric-vehicles/ 11 Osborne, Beth, and Ben Holland. (February 2021). “To Meet Climate Goals, Think Outside the Electric Car.” In Bloomberg City Lab. https://www.bloomberg.com/news/articles/2021-02-10/electric-cars-are-great-even-better-nocars?srnd=citylab-transportation 12 California Air Resources Board. (November 24, 2020). Draft 2020 Mobile Source Strategy. https://ww2.arb.ca.gov/sites/default/files/2020-11/Draft_2020_Mobile_Source_Strategy.pdf 13 California Air Resources Board. (2018). 2018 Progress Report: California’s Sustainable Communities and Climate Protection Act. https://ww2.arb.ca.gov/sites/default/files/2018-11/Final2018Report_SB150_112618_02_Report.pdf. See page 4. 14 California Air Resources Board. (January 2019). California Air Resources Board 2017 Scoping Plan-Identified VMT Reductions and Relationship to State Climate Goals. https://ww2.arb.ca.gov/sites/default/files/201901/2017_sp_vmt_reductions_jan19.pdf 15 California Air Resources Board. (February 2018). Updated Final Staff Report, Proposed Update to the SB 375 Greenhouse Gas Emission Reduction Targets. https://ww2.arb.ca.gov/sites/default/files/202006/SB375_Updated_Final_Target_Staff_Report_2018.pdf 16 Clark-Sutton, Kyle, Joshua Fletcher, Jeffrey Petrusa, and Kirsten Franzen. (2019). Evolving Transportation in North Carolina: An Analysis of Emission Reduction Pathways for North Carolina’s Transportation Sector. https://www.southernenvironment.org/uploads/publications/Transportation_Report_0120_web_F.pdf
51
17 California Senate Bill 375, Sustainable Communities and Climate Protection Act of 2008. 18 Bloomberg Philanthropies. (October 21, 2018). “Mike Bloomberg Names Pittsburgh, Philadelphia, Boston and Washington, DC as Winners in Bloomberg American Cities Climate Challenge.” https://www.bloomberg.org/press/releases/mike-bloomberg-names-pittsburgh-philadelphia-boston-washington-dcwinners-bloomberg-american-cities-climate-challenge/ 19 Bloomberg Philanthropies. (October 2019). American Cities Climate Challenge: Climate Action Playbook Brief. https://assets.bbhub.io/dotorg/sites/2/2020/07/American-Cities-Climate-Challenge-Climate-Action-Playbook.pdf 20 Transportation Planning Board (TPB). (2021). 2017-2018 Regional Transportation Survey Briefing. TPB Board meeting presentation, January 21, 2021. https://www.mwcog.org/file.aspx?&A=Z6vLCy%2bftZyN3UR2oKU6%2bJpEZiyn3A97%2b3y8e%2bSdh%2b8%3d 21 Tomer, Adie, et. al. (October 2020). Connecting people and places: Exploring new measures of travel behavior. Brookings. https://www.brookings.edu/interactives/connecting-people-and-places-exploring-new-measures-of-travelbehavior/ 22 Coalition for Smarter Growth 2020 analysis using data from the Center for Neighborhood Technology, Transportation + Housing Index. https://htaindex.cnt.org/map/#. Accessed October 2020. 23 COG. (November 2020). Metropolitan Washington 2030 Climate and Energy Action Plan. https://www.mwcog.org/documents/2020/11/18/metropolitan-washington-2030-climate-and-energy-action-plan/ 24 TPB. (December 2017). An Assessment of Regional Initiatives for The National Capital Region: Technical Report on Phase II of the TPB Long-Range Plan Task Force. https://www.mwcog.org/documents/2017/12/20/long-rangeplan-task-force-reports-projects-regional-transportation-priorities-plan-scenario-planning-tpb/ 25 Alpert, David. (November 16, 2017). “The best way to improve transportation in our region is…”. In Greater Greater Washington. https://ggwash.org/view/65596/the-best-way-improve-transportation-our-region-tpb-study 26 WMATA. (2016). ConnectGreaterWashington: Together the DC region can grow Efficiently, Responsibly, Sustainably, Equitably, Affordably, Competitively. https://planitmetro.com/wpcontent/uploads/2016/07/ConnectGreaterWashington-ExSum-Land-Use-As-Transport-Strategy-2016-02-29-Final-forPosting.pdf 27 Langer, Ashley, Vikram Maheshri, and Clifford Winston. (August 2017). From gallons to miles: A disaggregate analysis of automobile travel and externality taxes. Journal of Public Economics. Volume 152, Pages 34-46. https://doi.org/10.1016/j.jpubeco.2017.05.003 28 Smart Growth America and Transportation for America. (October 2020). Driving Down Emissions: Transportation, land use, and climate change. https://smartgrowthamerica.org/resources/driving-down-emissions/. See pages 18-19 and 21. 29 Makarewicz, Carrie, et. al. (2020). Another Look at Location Affordability: Understanding the Detailed Effects of Income and Urban Form on Housing and Transportation Expenditures. Housing Policy Debate, vol. 30. https://doi.org/10.1080/10511482.2020.1792528 30 Curren, Ryan, Nora Liu, Dwayne Marsh, and Kalima Rose. (2016). Equitable Development as a Tool to Advance Racial Equity. Local and Regional Government Alliance on Race & Equity. https://www.racialequityalliance.org/wpcontent/uploads/2016/11/GARE-Equitable-Development.pdf 31 Pinto de Moura, Maria Cecilia and David Reichmuth. (June 21, 2019). Inequitable Exposure to Air Pollution from Vehicles in the Northeast and Mid-Atlantic. Union of Concerned Scientists. https://www.ucsusa.org/resources/inequitable-exposure-air-pollution-vehicles 32 Wu, X. et. al. (2020). Air pollution and COVID-19 mortality in the United States: Strengths and limitations of an ecological regression analysis. Science advances, 6(45). https://projects.iq.harvard.edu/covid-pm 33 Virginia Clinicians for Climate Action. (October 28, 2020). An Assessment of the Health Burden of Ambient PM2.5 Concentrations in Virginia, Final Report. https://www.virginiaclinicians.org/transportation 34 American Lung Association. (2020). The Road to Clean Air: Benefits of a Nationwide Transition to Electric Vehicles. Report; Fact Sheet: Mid-Atlantic States. https://www.lung.org/clean-air/electric-vehicle-report 35 California Air Resources Board. Brake & Tire Wear Emissions, Vehicle Non-Exhaust Particulate Matter Sources. https://ww2.arb.ca.gov/resources/documents/brake-tire-wear-emissions. Accessed December 7, 2020.
52
36 Timmers, Victor R.J.H. and Peter Achten. (March 2016). Non-exhaust PM emissions from electric vehicles. Atmospheric Environment. Volume 134. https://www.researchgate.net/deref/http%3A%2F%2Fdx.doi.org%2F10.1016%2Fj.atmosenv.2016.03.017 37 California Air Resources Board. (November 24, 2020). Draft 2020 Mobile Source Strategy. See page 70. https://ww2.arb.ca.gov/sites/default/files/2020-11/Draft_2020_Mobile_Source_Strategy.pdf 38 Litman, Todd. (February 13, 2020). “Vision Zero, Meet VMT Reductions.” In Planetizen. https://www.planetizen.com/blogs/108401-vision-zero-meet-vmt-reductions 39 Marshall, Wesley E. and Nicholas N. Ferenchak. (June 2019). Why cities with high bicycling rates are safer for all road. Journal of Transport & Health. Volume 13. https://doi.org/10.1016/j.jth.2019.03.004 40 Smart Growth America. (2021). Dangerous By Design. https://smartgrowthamerica.org/dangerous-by-design/ Accessed February 10, 2021. 41 Schmitt, Angie. (2020). Right of Way: Race, Class and the Silent Epidemic of Pedestrian Deaths in America. Island Press. https://islandpress.org/books/right-way 42 Smart Growth America and Transportation for America. (October 2020). Driving Down Emissions: Transportation, land use, and climate change. https://smartgrowthamerica.org/resources/driving-down-emissions/ See graphic on page 9. 43 OECD. (2020). Non-exhaust Particulate Emissions from Road Transport: An Ignored Environmental Policy Challenge, OECD Publishing, Paris, https://doi.org/10.1787/4a4dc6ca-en 44 Smart Growth America, 2020. See pages 11-13. 45 TPB. (December 2017). An Assessment of Regional Initiatives for The National Capital Region: Technical Report on Phase II of the TPB Long-Range Plan Task Force. https://www.mwcog.org/documents/2017/12/20/long-rangeplan-task-force-reports-projects-regional-transportation-priorities-plan-scenario-planning-tpb/ 46 Alpert, David. (November 16, 2017). “The best way to improve transportation in our region is…” In Greater Greater Washington. https://ggwash.org/view/65596/the-best-way-improve-transportation-our-region-tpb-study 47 Litman, Todd. (June 5, 2020). Understanding Smart Growth Savings: Evaluating Economic Savings and Benefits of Compact Development. https://vtpi.org/sg_save.pdf 48 TPB. (2020). 2017-2018 Regional Travel Survey Briefing: Initial Findings of Observed Daily Trips. TPB Board meeting presentation Oct. 21, 2020. https://www.mwcog.org/file.aspx?&A=y9BJx13UoT%2b2v4QCLCYSsLHTaCMFfdb49E%2bTKdVw7FI%3d 49 Rodier, C., & Michaels, J. (2018). Travel Effects and Associated Greenhouse Gas Emissions of Automated Vehicles. UC Davis: National Center for Sustainable Transportation. Retrieved from https://escholarship.org/uc/item/27p0k44g 50 Saleh, Mark and Marianne Hatzopoulou. (November 2020). Greenhouse gas emissions attributed to empty kilometers in automated vehicles. Transportation Research Part D: Transportation and Environment. Volume 88. https://doi.org/10.1016/j.trd.2020.102567. Summarized in “Owning One Self-Driving Car More Damaging Than Owning Multiple Traditional Cars.” By Saumya Jain, SSTI, November 9, 2020. https://ssti.us/2020/11/09/owning-oneself-driving-car-more-damaging-than-owning-multiple-traditional-cars/ 51 Wadud, Zia, Don MacKenzie, and Paul Leiby. (April 2016). Help or hindrance? The travel, energy and carbon impacts of highly automated vehicles. Transport Research Policy Part A: Policy and Practice. Volume 86, Pages 118. https://doi.org/10.1016/j.tra.2015.12.001 52 Alarfaj, Abdullah F., W. Michael Griffin, and Constantine Samaras. (2020). Decarbonizing US passenger vehicle transport under electrification and automation uncertainty has a travel budget. Environmental Research Letters 15 0940c2. https://doi.org/10.1088/1748-9326/ab7c89 53 ABAG and MTC. (January 2020). Futures Final Report. https://mtc.ca.gov/sites/default/files/Horz_Futures_Report.web_.pdf 54 AECOM. (April 7, 2020). DC AV Study, Final Report. DC Sustainable Transportation for DDOT. https://lims.dccouncil.us/downloads/LIMS/44545/Introduction/RC23-0172-Introduction.pdf 55 Urban Institute. (2019). Meeting the Washington Region’s Future Housing Needs. https://www.urban.org/research/publication/meeting-washington-regions-future-housing-needs
53
56 COG. (2019). The Future of Housing in Greater Washington. https://www.mwcog.org/documents/2019/09/10/thefuture-of-housing-in-greater-washington/ 57 Smart Growth America. (2020). Emergency Stabilization and Economic Recovery Recommendations. https://smartgrowthamerica.org/resources/emergency-stabilization-economic-recovery-recommendations/ 58 Freemark, Yonah. (November, 23, 2020). “What Would Providing Every City with High-Quality Zero-Emissions Public Transportation Look Like?” In Urban Institute, Urban Wire: Neighborhoods, Cities and Metros; the blog of the Urban Institute. https://www.urban.org/urban-wire/what-would-providing-every-city-high-quality-zero-emissions-publictransportation-look 59 Transportation & Climate Initiative of the Northeast and Mid-Atlantic States. TCI’s Regional Policy Design Process. https://www.transportationandclimate.org/main-menu/tcis-regional-policy-design-process-2019#COVID19%20and%20TCI Accessed December 7, 2020. 60 State of Connecticut, District of Columbia, Commonwealth of Massachusetts, and State of Rhode Island. (December 21, 2020). Transportation and Climate Initiative Program Memorandum of Understanding. https://www.transportationandclimate.org/sites/default/files/TCI%20MOU%2012.2020.pdf 61 Transportation & Climate Initiative of the Northeast and Mid-Atlantic States. (September 16, 2020). Webinar on program design, modeling, and the implications of COVID-19. https://www.transportationandclimate.org/sites/default/files/Fall%202020%20modeling%20webinar%2C%20final%20 as%20shown%20on%2020200916.pdf 62 TPB. (February 17, 2021). Visualize 2045 “Voices of the Region” Public Opinion Survey Results. TPB Board February 17, 2021, agenda item #9, meeting memo and presentation. https://www.mwcog.org/file.aspx?&A=1wYBzmI93%2b%2bBZ9uOo7ipKnYtpv6WCJ%2bnZ0WnXm1uWkU%3d 63 Pugh, Bill. (February 23, 2021). “Residents in the region want to walk and bike more, and drive less after COVID19, a “Voices of the Region” survey suggests.” In Greater Greater Washington. https://ggwash.org/view/80495/voices-of-the-region-transportation-survey-residents-wants-to-walk-and-bike-moreand-drive-less-after-covid 64 Goss, Brenda. (January 28, 2021). “How to Move America to Electric Vehicles: From a Rudderless to a Resolute 2030 EV Vision.” Rocky Mountain Institute. https://rmi.org/how-to-move-america-to-electric-vehicles/ 65 California Air Resources Board. (January 2019). California Air Resources Board 2017 Scoping Plan-Identified VMT Reductions and Relationship to State Climate Goals. https://ww2.arb.ca.gov/sites/default/files/201901/2017_sp_vmt_reductions_jan19.pdf 66 Goss, Rocky Mountain Institute, 2021. 67 USDOT. (2021). Select Summary Highway Statistics, 2017 (most recent year available). https://explore.dot.gov/t/FHWA/views/SelectSummaryHighwayStatistics/Story1?iframeSizedToWindow=true&:embed =y&:showAppBanner=false&:display_count=no&:showVizHome=no Accessed February 22, 2021. 68 WMATA. (2016). ConnectGreaterWashington: Together the DC region can grow Efficiently, Responsibly, Sustainably, Equitably, Affordably, Competitively. https://planitmetro.com/wpcontent/uploads/2016/07/ConnectGreaterWashington-ExSum-Land-Use-As-Transport-Strategy-2016-02-29-Final-forPosting.pdf 69 MWCOG. (January 31, 2016.) Multi-Sector Approach to Reducing Greenhouse Gas Emissions in the Metropolitan Washington Region: Final Technical Report. https://www.mwcog.org/committees/multi-sector-working-group/ 70 TPB. (2020). 2017-2018 Regional Travel Survey Briefing: Initial Findings of Observed Daily Trips. TPB Board meeting presentation Oct. 21, 2020. https://www.mwcog.org/file.aspx?&A=y9BJx13UoT%2b2v4QCLCYSsLHTaCMFfdb49E%2bTKdVw7FI%3d. 71 Commuter Connections. (June 2020). 2019 State of the Commute Survey Report from the Metropolitan Washington Region. https://www.mwcog.org/documents/2020/06/17/state-of-the-commute-survey-report-carsharing-state-of-the-commute-travel-surveys/ 72 WMATA (2016). ConnectGreaterWashington: Together the DC region can grow Efficiently, Responsibly, Sustainably, Equitably, Affordably, Competitively. https://planitmetro.com/wpcontent/uploads/2016/07/ConnectGreaterWashington-ExSum-Land-Use-As-Transport-Strategy-2016-02-29-Final-forPosting.pdf. Detailed mode share MOE results from the Task 7 Scenario Comparison Measures Technical Memorandum for the reported scenario (scenario A2). The range in non-motorized mode share is due to the results 54being reported for the WMATA Compact Area and for the broader regional travel demand modeling area, while the comparable TPB MPO area used in reporting pre-pandemic data is between these two.
73 ABAG and MTC. (January 2020). Futures Final Report: Resilient and Equitable Strategies for the Bay Area’s Future. https://mtc.ca.gov/sites/default/files/Horz_Futures_Report.web_.pdf. 74 DRCOG. (August 2020). 2050 Metro Vision Regional Transportation Plan, Scenario Planning Technical Memorandum. https://drcog.org/sites/default/files/Scenario_Planning_Technical_Memo.pdf The Infill+Travel Choices scenario resulted in a 16% walk and bike mode share (double the number of trips in the future baseline scenario), and the Centers+Transit scenario resulted in six times the number of transit trips and triple the number of walk and bike trips compared to the future baseline scenario; these two scenarios reduced the drive-alone commute share from 81% in 2020 to 65% and 45%, respectively, by 2050. 75 Montgomery County. (December 2020). Montgomery County Climate Action Plan, Public Draft. https://www.montgomerycountymd.gov/green/Resources/Files/climate/draft-climate-action-plan.pdf 76 District of Columbia Department of Transportation. (2014). MoveDC master transportation plan. https://movedcdcgis.hub.arcgis.com. Accessed November 16, 2020. 77 City of Alexandria. (2019). Environmental Action Plan 2040. https://www.alexandriava.gov/tes/ecocity/info/default.aspx?id=112252 78 Metro. (2018). 2018 Regional Transportation Plan. https://www.oregonmetro.gov/sites/default/files/2020/07/29/Adopted-2018-RTP-all-chapters.pdf 79 California Air Resources Board. (2018). SB 375 Regional Plan Climate Targets, 2018 Update. https://ww2.arb.ca.gov/our-work/programs/sustainable-communities-program/regional-plan-targets 80 DRCOG. (2019). Metro Vision, Environment, Performance Measures. https://metrovision.drcog.org/explore/environment. Accessed March 2, 2021. 81 DRCOG. (2019). Metro Vision, Mobility, Performance Measures. https://metrovision.drcog.org/explore/mobility. Accessed March 2, 2021. 82 City of Minneapolis. (2020). Minneapolis Streets 2030. http://go.minneapolismn.gov/minneapolis-streets-2030 83 City of Minneapolis. (2019). Minneapolis 2040. https://minneapolis2040.com/goals/climate-change-resilience/ 84 City of St. Paul. (2019). Saint Paul for All: 2040 Comprehensive Plan. https://www.stpaul.gov/departments/planning-economic-development/planning/2040-comprehensive-plan 85 City of St. Paul. (2019). City of St. Paul Climate Action and Resilience Plan. https://www.stpaul.gov/departments/mayors-office/climate-action-planning/climate-action-resilience-plan 86 Metro, 2018. 87 California Air Resources Board. (2017). Scoping Plan Update. https://ww2.arb.ca.gov/sites/default/files/classic//cc/scopingplan/scoping_plan_2017.pdf. See page 101. 88 Minnesota Department of Transportation. (December 2020). Sustainable Transportation Advisory Council Recommendations Summary. http://www.dot.state.mn.us/sustainability/docs/advisory%20council/stacrecommendations-detail-2020.pdf 89 City of Boston. (2019). 2019 Climate Action Plan Update. https://www.boston.gov/departments/environment/boston-climate-action 90 City of Boston. (2017). Go Boston 2030. https://www.boston.gov/departments/transportation/go-boston-2030 91 Metro, 2018. 92 ABAG and MTC, 2020. 93 City of Los Angeles. (2019). Green New Deal Plan. https://plan.lamayor.org 94 ABAG. (December 2020). Plan Bay Area 2050 Final Blueprint Compendium. https://www.planbayarea.org/sites/default/files/FinalBlueprintRelease_December2020_Compendium_Jan2021Update .pdf 95 City of Boston, 2017, 2019. 96 DRCOG. (2019). Metro Vision, Mobility, Performance Measures. https://metrovision.drcog.org/explore/mobility. Accessed March 2, 2021. 97 DRCOG. (August 2020). 2050 Metro Vision Regional Transportation Plan, Scenario Planning Technical Memorandum. https://drcog.org/sites/default/files/Scenario_Planning_Technical_Memo.pdf 55
98 City of Ann Arbor. (2020). A2Zero Carbon Neutrality Plan. https://www.a2gov.org/departments/sustainability/Documents/A2Zero%20Climate%20Action%20Plan%20_3.0.pdf 99 WMATA, 2016. 100 Ewing, R., Park, K., Sabouri, S., Lyons, T., Kim, K., Choi, D., Daly, K., Etminani Ghasrodashti, R., Kiani, F., Ameli, H, Tian, G., Gaspers, D., and Hersey, J. (2020). Reducing Vehicle Miles Traveled (VMT), Encouraging Walk Trips, and Facilitating Efficient Trip Chains Through Polycentric Development. NITC-RR-1217. Portland, OR: Transportation Research and Education Center (TREC). https://pdxscholar.library.pdx.edu/cgi/viewcontent.cgi?article=1221&context=trec_reports 101Center for Neighborhood Technology. Housing + Transportation Index. Coalition for Smarter Growth analysis, October 2020. 102 Coalition for Smarter Growth. (2016). GreenPlace Certification: Living where green transportation prevails. https://www.smartergrowth.net/greenplace/ 103 Coalition for Smarter Growth. (2010). Cool Communities: Identifying Climate-Friendly Developments in the Washington, DC Region. https://www.smartergrowth.net/resources/cool-communities-2/ 104 CMAP. (2018). On to 2050. Indicators: https://www.cmap.illinois.gov/2050/indicators 105 City of Los Angeles. (2019). Green New Deal Plan. https://plan.lamayor.org 106 ABAG. (2020). Plan Bay Area 2050, Final Blueprint, Growth Geographies, Final Blueprint Growth Geographies: https://www.planbayarea.org/sites/default/files/PBA2050_Blueprint_Geographies_High_Resolution.pdf. Accessed December 7, 2020. 107 ABAG. (2020). Plan Bay Area 2050: Regional Growth Framework Update – Overview of Existing and Updated Geographies. https://www.planbayarea.org/sites/default/files/pdfs_referenced/2019_Regional_Growth_Framework_Update__Whats_Changed_1.pdf. Accessed December 7, 2020. 108 Metropolitan Council. Thrive MSP 2040. Indicators website: https://metrocouncil.org/Planning/Projects/Thrive2040/Thrive-Indicator-Dashboard.aspx. Accessed December 7, 2020. 109 Housing Leaders Group of Greater Washington. (2017). Guidebook for Increasing Housing Affordability in the Greater Washington Region. https://308ae27c-49f1-40c8-b01cb82809c7781d.filesusr.com/ugd/06af46_0268b7d74a0a40ec88b5a7cfaa11333f.pdf 110 Commuter Connections. (June 2020). 2019 State of the Commute Survey Report from the Metropolitan Washington Region. https://www.mwcog.org/documents/2020/06/17/state-of-the-commute-survey-report-carsharing-state-of-the-commute-travel-surveys/ 111 McKenzie, Brian. (December 2015). Transit Access and Population Change: The Demographic Profiles of RailAccessible Neighborhoods in the Washington, DC Area. U.S. Census Bureau, SEHSD Working Paper No. 2015-023. https://www.census.gov/content/dam/Census/library/working-papers/2015/demo/SEHSD-WP2015-23.pdf 112 Center for Neighborhood Technology. Housing + Transportation Index. https://htaindex.cnt.org/map/# Accessed October 2020. 113 COG. (September 2019). The Future of Housing in Greater Washington. https://www.mwcog.org/documents/2019/09/10/the-future-of-housing-in-greater-washington/ 114 TransForm and California Housing Partnership Corporation. (May 2014). Why Creating and Preserving Affordable Homes near Transit is a Highly Effective Climate Protection Strategy. https://www.transformca.org/transformreport/why-creating-and-preserving-affordable-homes-near-transit-highly-effective-climate 115 Schmitt, Angie. (2020). Right of Way: Race, Class and the Silent Epidemic of Pedestrian Deaths in America. Island Press. https://islandpress.org/books/right-way 116 Chapple, Karen. (2019). “Assessing the Travel Demand and Co-Benefit Impacts of Affordable Transit-Oriented Developments.” California Air Resources Board. https://ww3.arb.ca.gov/research/single-project.php?row_id=65273 117 Cash, et. al. (2020). Climate Change and Displacement in the U.S. – A Review of the Literature. University of California Berkeley Center for Community Innovation, SPARCC, UC Berkeley Urban Displacement Project. https://www.urbandisplacement.org/sites/default/files/images/climate_and_displacement_-_lit_review_6.19.2020.pdf
56
118 English, Mike. (November 2, 2020). “A WMATA site tax credit overcomes a County Executive veto, setting the stage for housing decisions to come.” https://ggwash.org/view/79497/wmata-site-tax-credit-overcomes-countyexecutive-veto-setting-the-stage-for-housing-decisions-to-come 119 DC Office of Planning. Housing Framework for Equity and Growth. https://planning.dc.gov/page/housingframework-equity-and-growth. Accessed December 7, 2020. 120 City of Alexandria, City Council. (March 14, 2020). Resolution to Endorse Metropolitan Washington Council of Governments (COG) Targets to Address the Region’s Housing Needs. https://alexandria.granicus.com/ViewPublisher.php?view_id=57 121 Montgomery County Council. (November 5, 2019). Resolution to Support MWCOG’s Regional Housing Targets for Montgomery County. https://apps.montgomerycountymd.gov/ccllims/DownloadFilePage?FileName=9493_1_9869_Resolution_19284_Adopted_20191105.pdf 122 Urban Institute. (2019). Meeting the Washington Region’s Future Housing Needs. https://www.urban.org/research/publication/meeting-washington-regions-future-housing-needs 123 Enterprise. Green Communities Certification Program. Accessed December 7, 2020. https://www.enterprisecommunity.org/solutions-and-innovation/green-communities 124 Bondi, Melissa; Enterprise Community Partners. (January 22, 2021). Email correspondence. 125 Dorneles, Isabela. (January 27, 2021). “Planners Secure Zoning Reform Win in Massachusetts.” American Planning Association. https://www.planning.org/blog/9211391/planners-secure-zoning-reform-win-in-massachusetts/ 126 Logan, Tim. (January 11, 2021) “Zoning measure would require municipalities to allow higher-density housing near MBTA stations.” Boston Globe. https://www.bostonglobe.com/2021/01/11/business/new-law-would-require-highdensity-housing-near-t-stations/ 127 Marcus, Justine, and Lindsay Rosenfeld. (January 2021). California's Affordable Housing and Sustainable Communities Program: Five Years of Investments. California Housing Partnership and Enterprise Community Partners. https://www.enterprisecommunity.org/sites/default/files/media-library/where-wework/ahsc/AHSCReport_2021FINAL.pdf 128 California Strategic Growth Council. (2021). Affordable Housing and Sustainable Communities. https://sgc.ca.gov/programs/ahsc/ 129 City of Chicago. (September 2020). Equitable Transit-Oriented Development: eTOD Policy. Draft eTOD Policy Plan for Public Comment. https://www.chicago.gov/city/en/sites/equitable-transit-oriented-development/home.html 130 City of Denver, CO. (March 2020). Affordable Housing Zoning Incentive, Interim Background Report. https://www.denvergov.org/content/dam/denvergov/Portals/646/documents/Zoning/text_amendments/affordablehousing-zoning-incentive/Affordable_Housing_Zoning_Incentive_Background_Report.pdf 131 City of Denver, 2020. 132 MARTA. (January 5, 2021). “Marta Announces Regional Partnership to Protect Affordable Housing near Rail Stations.” https://itsmarta.com/marta-announces-regional-partnership-to-protect-housing.aspx 133 City of Denver, 2020. 134 Zavala, Deya. (December 1, 2020). “It’s Time for Equitable Transit-Oriented Development.” In Streetsblog. https://denver.streetsblog.org/2020/12/01/its-time-for-equitable-transit-oriented-development/ 135 Rivera, Natalie. (December 3, 2020). The Pandemic Hasn’t Stopped These Agencies from Moving Ahead with Affordable Housing Development. TransitCenter. https://transitcenter.org/despite-pandemic-agencies-move-aheadwith-affordable-housing-development/ 136 Metropolitan Council. Thrive MSP 2040. Equity Indicators website: https://metrocouncil.org/Planning/Projects/Thrive-2040/Thrive-Indicator-Dashboard.aspx. Accessed November 16, 2020. 137 CMAP. (2018). On to 2050. Indicators: https://www.cmap.illinois.gov/2050/indicators 138 Bloomberg Philanthropies. (October 2019). American Cities Climate Challenge: Climate Action Playbook Brief. https://assets.bbhub.io/dotorg/sites/2/2020/07/American-Cities-Climate-Challenge-Climate-Action-Playbook.pdf
57
139 Nichols, Brice G. and Kara M. Kockelman. (January 14, 2014). Pay-As-You-Drive Insurance: Its Impacts on Household Driving and Welfare. Transportation Research Record, Volume: 2450 issue: 1, page(s): 76-82. https://doi.org/10.3141%2F2450-10 140 Litman, Todd. (October 7, 2020). Socially Optimal Transport Prices and Markets: Principles, Strategies, and Impacts. Victoria Transportation Policy Institute. https://www.vtpi.org/sotpm.pdf 141 COG. (November 2020). Metropolitan Washington 2030 Climate and Energy Action Plan. See pages 51-53. https://www.mwcog.org/documents/2020/11/18/metropolitan-washington-2030-climate-and-energy-action-plan/ 142 TPB. (September 8, 2010). Scenario Study: CLRP Aspirations Scenario, Final Report. https://www.mwcog.org/documents/2010/09/08/clrp-aspirations-scenario/ 143 TPB. (December 2017). An Assessment of Regional Initiatives for The National Capital Region: Technical Report on Phase II of the TPB Long-Range Plan Task Force. https://www.mwcog.org/documents/2017/12/20/long-rangeplan-task-force-reports-projects-regional-transportation-priorities-plan-scenario-planning-tpb/ 144 Marshall, Norman. (October 2020). Review of Maryland I-495 & I-270 Managed Lanes Project Draft Environmental Impact Statement and Draft Section 4(f) Evaluation. https://www.sierraclub.org/sites/www.sierraclub.org/files/sce/marylandchapter/MD%20Managed%20Lanes%20DEIS%20Traffic%20Review%2010-29-2020.pdf 145 Coalition for Smarter Growth. (2020). Flexible Commuter Benefits. https://www.smartergrowth.net/parkingcashout/ 146 State of Maryland. (2020). Maryland Commuter Tax Credit Registration Details. https://onestop.md.gov/forms/maryland-commuter-tax-credit-registration-5da5b08b5d937b010116fc63. Accessed January 31, 2021. 147 D.C. Sustainable Transportation. Decongestion Pricing Study. https://dcstcoalition.org/decongestionstudy2019. Accessed December 7, 2020. 148 DeVoe, Jo. (December 2020). “Arlington County to Launch Variable Parking Pricing Along Metro Corridors.” ARLnow. https://www.arlnow.com/2020/12/08/arlington-county-to-launch-variable-parking-pricing-along-metrocorridors/ 149 ABAG. (October 2020). Plan Bay Area 2050, Final Blueprint. https://www.planbayarea.org/2050-plan/finalblueprint/plan-bay-area-2050-final-blueprint-documents 150 Seattle Department of Transportation. (May 23, 2019). Congestion Pricing. http://www.seattle.gov/transportation/getting-around/driving-and-parking/congestion-pricing. Accessed November, 13, 2020. 151 City of Vancouver. (2020). Transport Pricing. https://vancouver.ca/streets-transportation/transport-pricing.aspx Accessed December 10, 2020. 152 Shared-Use Mobility Center. (2020). Shared Mobility Benefits Calculator. https://learn.sharedusemobilitycenter.org/benefitcalculator/ Accessed December 10, 2020. 153 Cazzola, Pierpaolo and Philippe Crist. (2020). Good To Go? Assessing the Environmental Performance of New Mobility. International Transport Forum. https://www.itf-oecd.org/good-to-go-environmental-performance-new-mobility 154 Roberts, Cameron. (July 30, 2020). “There aren’t enough batteries to electrify all cars — focus on trucks and buses instead.” The Conversation. https://theconversation.com/there-arent-enough-batteries-to-electrify-all-carsfocus-on-trucks-and-buses-instead-142545 155 Cisostomo, Noel, et. al. (January 2021). Assembly Bill 2127 Electric Vehicle Charging Infrastructure Assessment: Analyzing Charging Needs to Support Zero-Emission Vehicles in 2030. California Energy Commission. https://efiling.energy.ca.gov/getdocument.aspx?tn=236237 156 Fulton, Lew, Jacob Mason, and Dominique Meroux. (May 2017). Three Revolutions in Urban Transportation. UC Davis Sustainable Transportation Energy Pathways and the Institute for Transportation & Development Policy. https://steps.ucdavis.edu/three-revolutions-landing-page/ 157 Pierce, Gregory, Britta McOmber, and J.R. DeShazo. (2020). Supporting Lower-Income Households’ Purchase of Clean Vehicles: Implications From California-Wide Survey Results. A Policy Brief. UCLA Luskin Center for Innovation. https://innovation.luskin.ucla.edu/wp-content/uploads/2020/08/Supporting_LowerIncome_Households_Purchase_of_Clean_Vehicles.pdf
58
158 Hsu, Chih-Wei, Peter Slowik, and Nic Lutsey. (January 2021). City charging infrastructure needs to reach electric vehicle goals: The case of Seattle. The International Council on Clean Transportation, Working Paper 2021-04. https://theicct.org/sites/default/files/publications/Seattle-charging%20infra-jan2021.pdf 159 Nicholas, Michael, Dale Hall, and Nic Lutsey. (January 2019). Quantifying the Electric Vehicle Charging Infrastructure Gap Across U.S. Markets. The International Council on Clean Transportation, White Paper. https://theicct.org/sites/default/files/publications/US_charging_Gap_20190124.pdf 160 Cisostomo, Noel, et. al. (January 2021). Assembly Bill 2127 Electric Vehicle Charging Infrastructure Assessment: Analyzing Charging Needs to Support Zero-Emission Vehicles in 2030. California Energy Commission. https://efiling.energy.ca.gov/getdocument.aspx?tn=236237 161 Howard, Brian, Shruti Vaidyanathan, Charlotte Cohn, Nick Henner, and Ben Jennings. (February 2021). The State Transportation Electrification Scorecard. American Council for an Energy Efficient Economy, Research Report. https://www.aceee.org/sites/default/files/pdfs/t2101.pdf 162 Shared-Use Mobility Center. (2019). Mobility Hubs: Where People Go to Move. https://sharedusemobilitycenter.org/wp-content/uploads/2019/08/Mobility-Hubs_SUMC_Web.pdf 163 Tregoning, Harriet. (January 15, 2021). Email regarding New Urban Mobility Alliance (NUMO) mobility hub work. 164 Virginia Electric Vehicle Incentive Working Group. (November 1, 2020). Electric Vehicle Incentive Working Group Feasibility Report: Recommendations on Implementing a Rebate Program to Encourage the Adoption of Electric Vehicles in the Commonwealth. 165 District of Columbia Department of Energy and Environment. (September 22, 2020). Carbon Free DC 2050. Kickoff Sessions, Transportation Overview, Presentation, September, 22, 2020. https://dc.gov/sites/default/files/dc/sites/ddoe/service_content/attachments/Carbon%20Free%20DC%202050_Transp ortation%20Overview.pdf 166 WMATA. (2020). Zero-Emission Bus Update. https://www.wmata.com/initiatives/sustainability/upload/WMATA_Zero_Emission_Bus_Update-02122020-FINAL.pdf. Accessed February 17, 2021. 167 Sierra Club. (October 2020). A Vision for Climate Leadership in Washington, DC: Seizing the Economic, Climate, and Public Health Benefits of Electrifying WMATA’s Transit Bus Fleet. https://www.sierraclub.org/sites/www.sierraclub.org/files/press-room/WMATAReport_Web.pdf 168 District of Columbia. (2021). Electric Vehicle Readiness Amendment Act. https://lims.dccouncil.us/Legislation/B230193. Accessed February 3, 2021. 169 People for Bikes. Policies + Laws. https://peopleforbikes.org/our-work/e-bikes/policies-and-laws/. Accessed December 7, 2020. 170 SANDAG. Regional Mobility Hub Strategy. https://sdforward.com/mobility-planning/regionalMobilityHub. Accessed December 7, 2020. 171 SACOG. (2018). Green Region Plan. https://www.sacog.org/green-region-plan 172 City of Boston. (October 2019). Climate Action Plan 2019 Update. https://www.boston.gov/sites/default/files/embed/file/201910/city_of_boston_2019_climate_action_plan_update_4.pdf 173 Janzer, Cinnamon. (December 3, 2020). “‘Mobility Hubs’ Become Community Anchors in Minneapolis.” In NextCity. https://nextcity.org/daily/entry/mobility-hubs-become-community-anchors-in-minneapolis 174 The Musicant Group and Minneapolis Public Works. (2020). 2019 Minneapolis Mobility Hubs Pilot. http://www2.minneapolismn.gov/www/groups/public/@publicworks/documents/webcontent/wcmsp-224822.pdf 175 Carpenter, Susan. (December 15, 2020). Santa Monica to Roll Out Nation’s First Zero-Emission Delivery Zone. Spectrum News 1. https://spectrumnews1.com/ca/la-west/transportation/2020/12/14/santa-monica-will-be-site-ofnation-s-first-zero-emissions-delivery-zone 176 Venema, Jennifer. (November 12, 2020). Presentation on City of Sacramento EV programs, as part of “E-Mobility Equity: Cities Centering Equity in Transportation Electrification” session at 2020 National E-Mobility Equity Virtual Conference. https://www.youtube.com/watch?v=y0McsXP-eF8&feature=youtu.be 177 Nairn-Birch, Nicholas. (October 6, 2020). Presentation on California EV programs, as part of “EVs and Equity” panel discussion hosted by Plug In America, for Drive Electric Week 2020. https://www.youtube.com/watch?v=yEt_5hVGUeY 59
178 City of St. Paul, MN. (2021). Twin Cities Electric Vehicle Mobility Network. https://www.stpaul.gov/departments/public-works/transportation-and-transit/twin-cities-electric-vehicle-mobilitynetwork. Accessed February 3, 2021. 179 San Diego Gas & Electric. (2021). Power Your Drive. https://www.sdge.com/residential/electric-vehicles/poweryour-drive. Accessed February 3, 2021. 180 State of Washington Department of Commerce. (December 17, 2020). Commerce awards $9.8 million for electric vehicle charging infrastructure throughout the state. https://www.commerce.wa.gov/news-releases/communitygrants/commerce-awards-9-8-million-for-electric-vehicle-charging-infrastructure-throughout-the-state/ 181 TPB. (2021). 2017-2018 Regional Transportation Survey Briefing. TPB Board meeting presentation, January 21, 2021. https://www.mwcog.org/file.aspx?&A=Z6vLCy%2bftZyN3UR2oKU6%2bJpEZiyn3A97%2b3y8e%2bSdh%2b8%3d 182 DRCOG. (2020). Metro Vision, Mobility, Performance Measures. https://metrovision.drcog.org/explore/mobility. Accessed December 7, 2020. 183 Metropolitan Council. Thrive MSP 2040. Indicators website: https://metrocouncil.org/Planning/Projects/Thrive2040/Thrive-Indicator-Dashboard.aspx. Accessed December 7, 2020.
60